. 2021 Oct;31(10):1885-1899.
doi: 10.1101/gr.271080.120. Epub 2021 Apr 9.

Mapping the regulatory landscape of auditory hair cells from single-cell multi-omics data

Affiliations

Mapping the regulatory landscape of auditory hair cells from single-cell multi-omics data

Shuze Wang et al. Genome Res. 2021 Oct.

Abstract

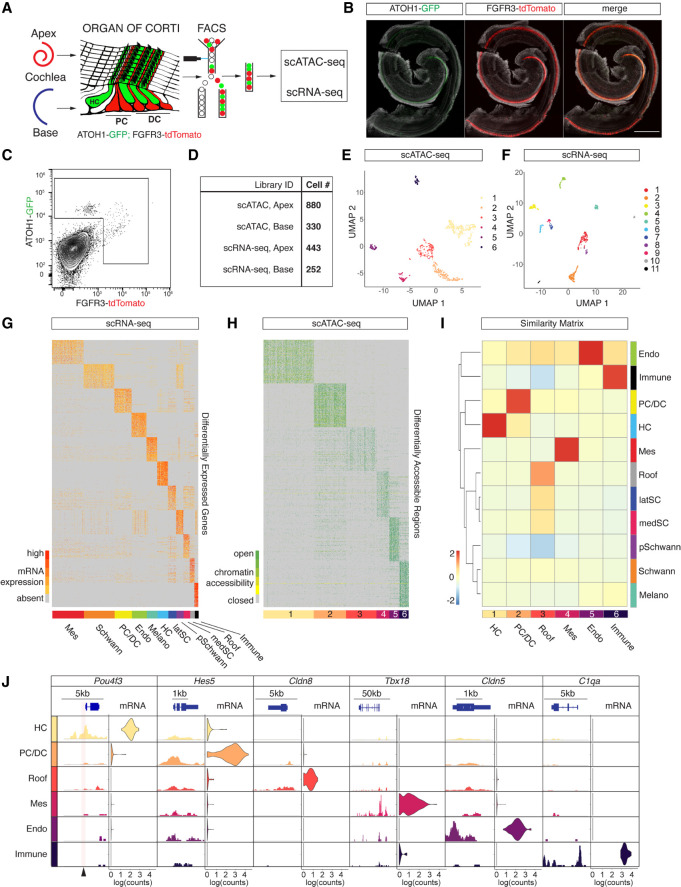
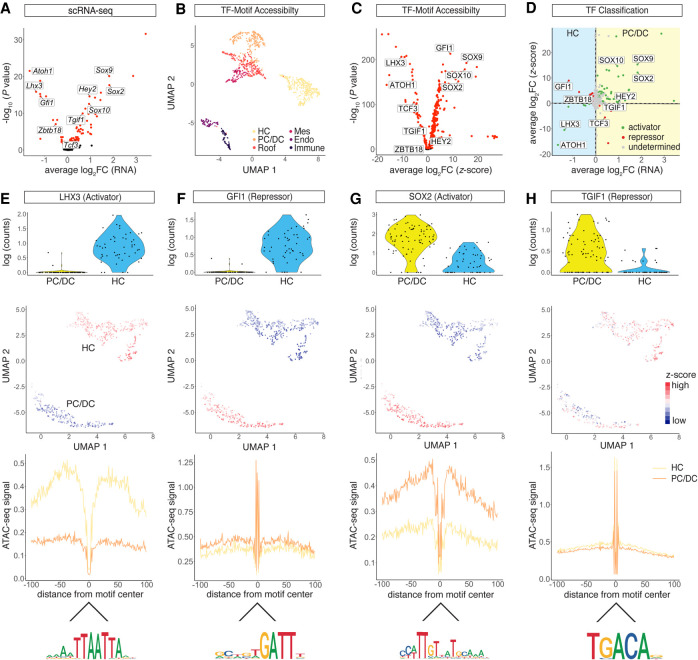
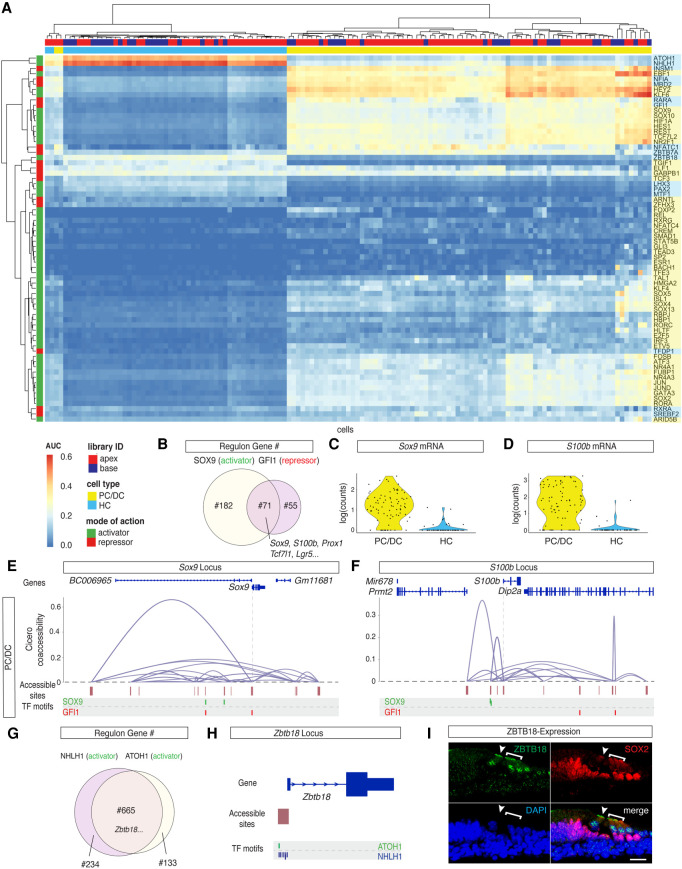
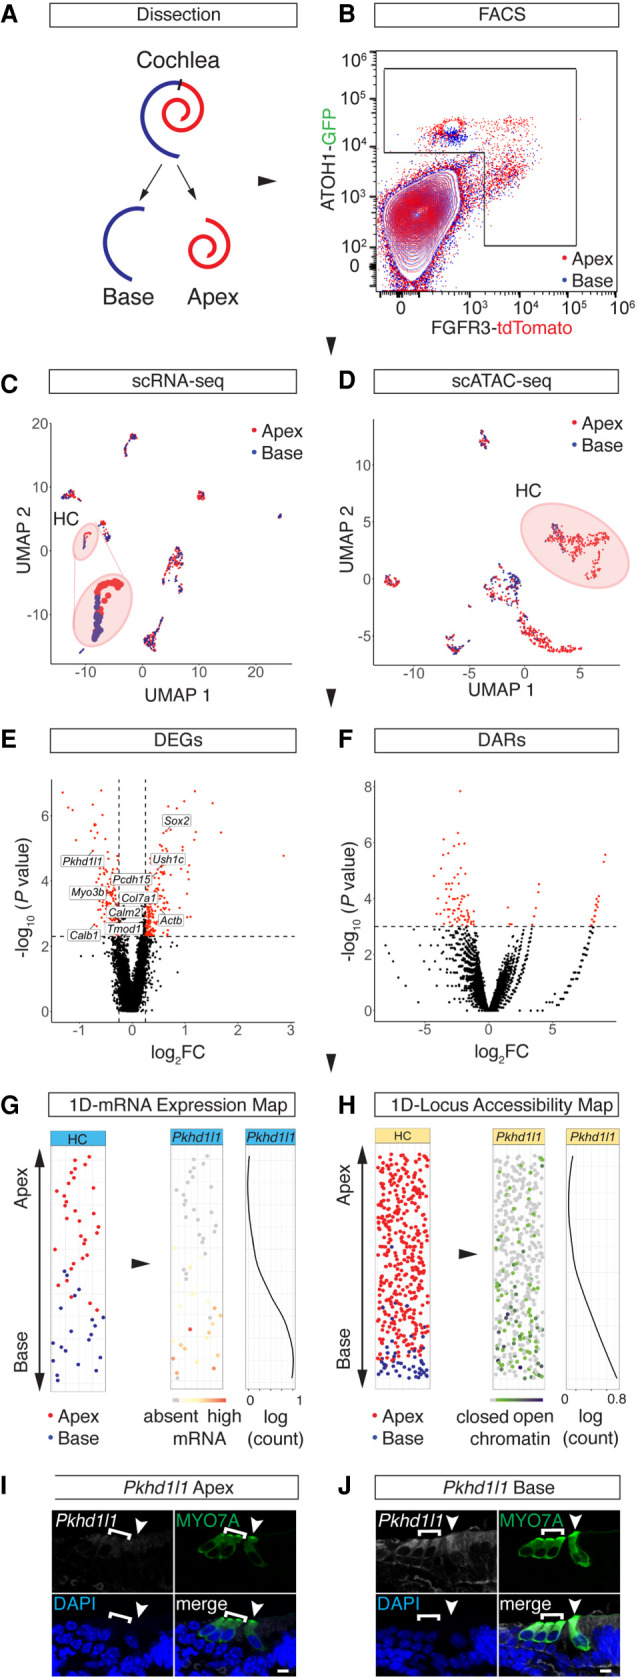
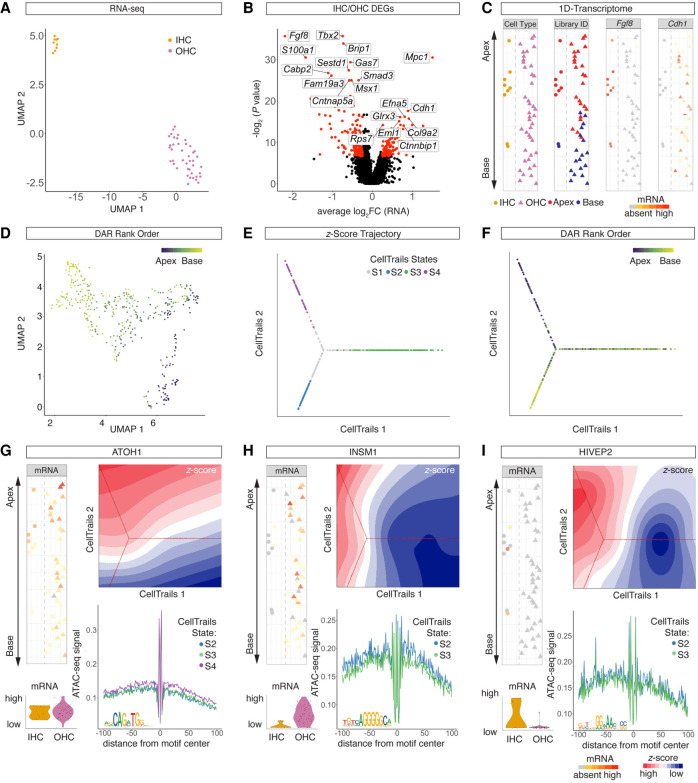
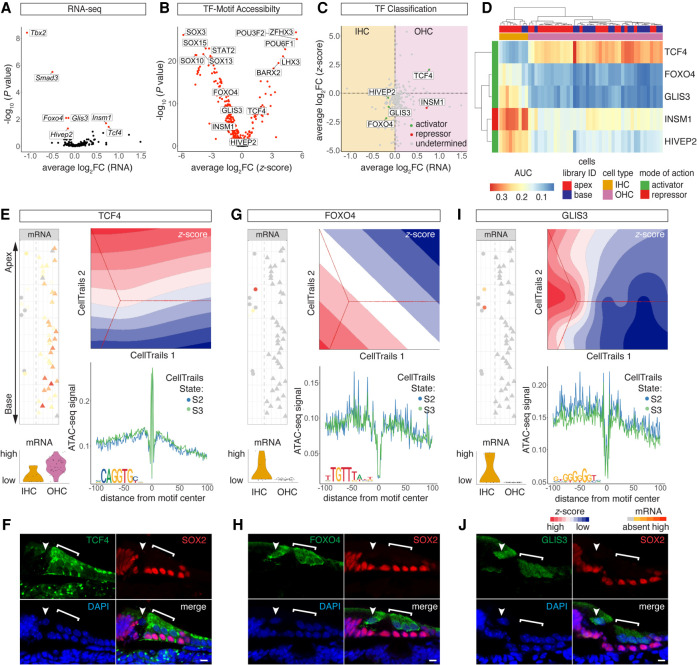
Auditory hair cells transduce sound to the brain, and in mammals, these cells reside together with supporting cells in the sensory epithelium of the cochlea, called the organ of Corti. To establish the organ's delicate function during development and differentiation, spatiotemporal gene expression is strictly controlled by chromatin accessibility and cell type-specific transcription factors, jointly representing the regulatory landscape. Bulk sequencing technology and cellular heterogeneity obscured investigations on the interplay between transcription factors and chromatin accessibility in inner ear development. To study the formation of the regulatory landscape in hair cells, we collected single-cell chromatin accessibility profiles accompanied by single-cell RNA data from genetically labeled murine hair cells and supporting cells after birth. Using an integrative approach, we predicted cell type-specific activating and repressing functions of developmental transcription factors. Furthermore, by integrating gene expression and chromatin accessibility data sets, we reconstructed gene regulatory networks. Then, using a comparative approach, 20 hair cell-specific activators and repressors, including putative downstream target genes, were identified. Clustering of target genes resolved groups of related transcription factors and was used to infer their developmental functions. Finally, the heterogeneity in the single-cell data allowed us to spatially reconstruct transcriptional as well as chromatin accessibility trajectories, indicating that gradual changes in the chromatin accessibility landscape are lagging behind the transcriptional identity of hair cells along the organ's longitudinal axis. Overall, this study provides a strategy to spatially reconstruct the formation of a lineage-specific regulatory landscape using a single-cell multi-omics approach.


Figures

Figure 1.
Figure 1.
scATAC-seq and scRNA-seq profiling of isolated HCs and PC/DCs. (A) Schematic representation of the experimental workflow used in this study. (B) Representative fluorescent reporter gene expression of ATOH1-GFP and FGFR3-tdTomato in whole-mount preparations of the organ of Corti at P2. Scale bar, 200 µm. (C) FACS plot and gating strategy to isolate cells expressing GFP and tdTomato. (D) Table summarizing sequencing libraries generated and total number of cells per library after quality control. (E,F) UMAP plots to show the clustering of all organ of Corti cells processed in two aggregated libraries to rule out technical variations for scATAC-seq (E) and scRNA-seq (F) experiments. (G) Expression heat map for 695 organ of Corti scRNA-seq cells (x-axis) and DEGs (y-axis). Shown are the top 100 DEGs for each of the 11 clusters identified. Cluster identities were determined based on DEGs known as canonical markers (also see Supplemental Fig. S2A) and indicated with a color bar at the bottom of the heat map. (H) Accessibility heat map for 1210 scATAC-seq cells. The top 100 DARs for each of the six clusters identified are shown, and cluster IDs are indicated with a color bar at the bottom of the heat map. (I) A Jaccard index similarity matrix reveals relations between scATAC-seq clusters and scRNA-seq clusters based on the overlaps between DEGs and annotated DARs. scATAC-seq cluster annotations were determined by the similarity to scRNA-seq clusters (color-coded as in E and F). (J) Enrichment of chromatin accessibility and expression level of candidate genes corresponding to their clusters. Accumulated scATAC-seq fragments at the individual gene locus (left column) and normalized gene expression levels in violin plots (right column) for the six scATAC-seq clusters. Arrowhead at the bottom of the plot indicates a position of a previously published organ of Corti–specific regulatory element (Wilkerson et al. 2019).
Figure 2.
Figure 2.
Transcriptional activator and repressor classification. (A) Volcano plot of differentially expressed TF genes between the HC and PC/DC clusters (P-adjusted < 0.05). (B) UMAP of TF motif accessibility z-scores calculated from chromVAR. Cells are color-coded based on SnapATAC clusters. (C) Volcano plot of differential TF motif accessibilities calculated from z-scores between the HC and PC/DC clusters (P-adjusted < 0.05). (D) Dot plot of TF classification shown in average log2 fold change (FC) mRNA level and z-scores. The differential expression from scRNA-seq between HCs and PC/DCs is plotted on the x-axis, and the differential accessibility from scATAC-seq is shown on the y-axis. Activators are classified in green, repressors in red, and undetermined TFs in gray. (EH) TF activities in differentiating HCs and PC/DCs in terms of mRNA expression, chromatin accessibility, and footprints. (E) LHX3, a transcriptional activator in HCs. (First row) Violin plot of RNA expression. Each dot represents a single cell. (Second row) UMAP plot of LHX3 motif accessibility calculated as z-score. Red indicates higher accessibility compared with blue. Each dot represents a single cell. (Third row) LHX3 footprint calculated from scATAC-seq data using HINT-ATAC. Activators are characterized by high scATAC-seq signal in the flanking region of the TF binding sites compared with the control population. Yellow line represents the HC cluster, and orange line represents the PC/DC cluster. (Fourth row) Mouse HOCOMOCO v10 consensus sequence for the LHX3 motif. (FH) Analogous data representation for (F) GFI1, classified as a HC repressor; (G) SOX2, a PC/DC activator; and (H) TGIF1, a repressor in PC/DCs.
Figure 3.
Figure 3.
TFs controlling HC and PC/DC differentiation. (A) AUC enrichment matrix with hierarchical clustering at single-cell resolution revealed the regulon activities during differentiation of HCs and PC/DCs. A regulon summarizes putative downstream target genes as a group of the respective TF. The activity of the regulon is color-coded from blue (depletion) to red (enrichment). Hierarchical clustering reveals similarities between individual cells (x-axis) and between different regulons (y-axis). Color bars on the top and to the side of the heat map indicate library ID, cell type, mode of action, and cell type specificity. (B) Venn diagram of the number of overlapped downstream target genes between the SOX9 regulon and GFI1 regulon. (C,D) Violin plots of Sox9 (C) and S100b (D) expression level. The two genes are representatives of overlapping downstream target genes between the SOX9 and GFI1 regulons. (E,F) Coaccessibility analysis of Sox9 and S100b loci in the PC/DC cluster using Cicero. (E) In PC/DCs, Sox9 TSS is directly and indirectly connected to the accessible sites. They correspond to predicted regulatory elements that contain putative TF binding sites for SOX9 and GFI1, as determined by FIMO motif scanning. (First row) Genome annotation from UCSC Known Genes. (Second row) Coaccessibility plot connects predicted regulatory elements with the TSS. (Third row) Accessible regions aligned with the locus. (Forth row) Putative TF binding sites of SOX9 and GFI1 motifs relative to the accessible regions. TSS position is indicated with a dashed line. (F) Analogous data representation for the S100b locus. (G) Overlapping downstream target genes between known HC transcriptional activators ATOH1 and NHLH1. (H) Zbtb18 is a shared target gene between the ATOH1 and NHLH1 regulons with accessible TF binding sites for both TFs at the TSS in HCs. (I) Immunostaining of ZBTB18 protein expression in IHCs and OHCs in cryosections of the organ of Corti (P2). Arrowhead pointing at the IHC. Bracket delineates OHC location. Scale bar, 20 µm.
Figure 4.
Figure 4.
Spatial reconstruction of HC origins along the longitudinal axis. (A) Schematic representation of the sampling strategy used in this study. Color code is as follows: apex, red; base, blue. (B) FACS plot and gating strategy to isolate GFP- and tdTomato-expressing cells. Color code identifies compartmental identities (color code same as in A). (C,D) UMAP projections of all cells analyzed in the scRNA-seq (C) and scATAC-seq (D) experiments with color code for library ID (color code as in A and B). HC populations are highlighted with a circle and are magnified for better visibility in C. Dots correspond to single cells. (E,F) Volcano plots of DEGs (E) and DARs (F) comparing apical and basal compartments. scRNA-seq cutoff: P < 0.005 and absolute value of log2FC > 0.25. scATAC-seq cutoff: P < 0.001. (G,H) 1D spatial reconstruction of single-cell transcript expression levels and chromatin accessibilities. (G) 1D HC expression map. (Left) 1D PCA based on the DEGs shown in E. y-Axis resolves predicted apex (top) to base (bottom) axis. Data points are randomly spread along x-axis for better visibility. Dots correspond to single cells. Color code depicts library ID (same as in AD). (Middle) Gene expression level of Pkhd1l1 projected onto the 1D expression map. (Right) Pkhd1l1 expression fitted into a regression line. y-Axis corresponds to the apex-to-base axis; x-axis, to expression level shown in log counts. (H) Analogous data representation as in G, showing 1D accessibility map with library ID and Pkhd1l1 accessibility projected. (I,J) RNAscope staining of Pkhd1l1 transcript comparing HCs of apical (I) and basal (J) origin. HCs were counter-stained with anti-MYO7A and DAPI nuclear stain. IHC (arrowhead) and OHC (bracket) staining using identical imaging settings. Scale bar, 10 µm.
Figure 5.
Figure 5.
Developmental bifurcation of IHCs and OHCs. (A) UMAP projection of scRNA-seq HCs delineates IHCs and OHCs subclusters. A single dot represents a single cell. (B) Volcano plot of DEGs (P < 0.01) between IHC and OHC clusters. (C) 1D spatial reconstruction map with cell identity (first column) and library ID (second column) projected. Expression levels of IHC-specific gene Fgf8 (third column) and OHC-specific gene Cdh1 (fourth column) were projected onto the 1D spatial reconstruction map. Dashed line delineates IHCs (left) from OHCs (right). (D) UMAP plot of HC cluster from scATAC-seq data with projection of spatial rank order as determined by 1D spatial reconstruction map. (E,F) Trajectory reconstruction based on scATAC-seq z-scores using CellTrails. CellTrails states (E) and DAR-based rank order (F) projected onto the trajectory. (G,I) Comparative analysis of selected TFs in terms of mRNA expression, motif accessibility, and footprints. (G, top left column) Atoh1 mRNA expression projected onto the 1D spatial reconstruction map. Dashed line delineates IHCs (left) from OHCs (right). (Bottom left column) Violin plots with mRNA levels for IHCs and OHCs. (Top right column) Contour plot of ATOH1 z-scores with CellTrails trajectory in the background. (Bottom right column) ATOH1 footprint from scATAC-seq data for selected CellTrails states (same color code as in E). ATOH1 consensus sequence is depicted at the bottom left of the footprint plot. (H,I) Analogous data representation for INSM1 (H) and HIVEP2 (I).
Figure 6.
Figure 6.
TFs controlling IHC and OHC differentiation. (A) Volcano plot of differentially expressed TF genes (P-adjusted < 0.05) between IHCs and OHCs. (B) Volcano plot of differentially accessible TF motifs (P-adjusted < 0.05) comparing IHC and OHC clusters. (C) Dot plot of TF classification shown in average log2FC mRNA transcripts and z-scores. The differential expression between IHCs and OHCs is plotted on the x-axis, and differential accessibility is shown on the y-axis. Activators are classified in green, repressors in red, and undetermined TFs in gray. (D) AUC enrichment matrix of TF regulons contributing to IHC/OHC segregation. Color bars on the top and to the side of the heat map indicate library ID, cell type as determined based on DEGs, and mode of action. (E,G,I) Comparative analysis of selected TFs in terms of mRNA expression, motif accessibility, and footprints. Analogous data representation as in Figure 5, F and G. (E) OHC activator TCF4. (F) Anti-TCF4 staining localizes to OHC nuclei and cytoplasm. HCs are counter-stained with anti-MYO7A and DAPI nuclear stain. Arrowhead points at IHC nucleus; bracket highlights OHC region. Scale bar, 10 µm. (G) IHC activator FOXO4. (H) Anti-FOXO4 staining in IHC and OHC cytoplasm and nuclei. Counter-stain, scale bar, and labeling analogous to F. (I) IHC activator GLIS3. (J) Anti-GLIS3 in IHC and OHC cytoplasm and nuclei. Counter stain, scale bar, and labeling analogous to F.

Similar articles

Cited by

References

    1. Aibar S, González-Blas CB, Moerman T, Huynh-Thu VA, Imrichova H, Hulselmans G, Rambow F, Marine JC, Geurts P, Aerts J, et al. 2017. SCENIC: single-cell regulatory network inference and clustering. Nat Methods 14: 1083–1086. 10.1038/nmeth.4463 - DOI - PMC - PubMed
    1. Aleksiūnienė B, Matulevičiūtė R, Matulevičienė A, Burnytė B, Krasovskaja N, Ambrozaitytė L, Mikštienė V, Dirsė V, Utkus A, Kučinskas V. 2017. Opposite chromosome constitutions due to a familial translocation t(1;21)(q43;q22) in two cousins with development delay and congenital anomalies: a case report. Medicine (Baltimore) 96: e6521. 10.1097/MD.0000000000006521 - DOI - PMC - PubMed
    1. Bendall SC, Davis KL, Amir e-A, Tadmor MD, Simonds EF, Chen TJ, Shenfeld DK, Nolan GP, Pe'er D. 2014. Single-cell trajectory detection uncovers progression and regulatory coordination in human B cell development. Cell 157: 714–725. 10.1016/j.cell.2014.04.005 - DOI - PMC - PubMed
    1. Berest I, Arnold C, Reyes-Palomares A, Palla G, Rasmussen KD, Giles H, Bruch PM, Huber W, Dietrich S, Helin K, et al. 2019. Quantification of differential transcription factor activity and multiomics-based classification into activators and repressors: diffTF. Cell Rep 29: 3147–3159.e12. 10.1016/j.celrep.2019.10.106 - DOI - PubMed
    1. Bermingham-McDonogh O, Oesterle EC, Stone JS, Hume CR, Huynh HM, Hayashi T. 2006. Expression of Prox1 during mouse cochlear development. J Comp Neurol 496: 172–186. 10.1002/cne.20944 - DOI - PMC - PubMed

Publication types