. 2021 Apr 9;12(1):2113.
doi: 10.1038/s41467-021-22179-z.

Adenosine integrates light and sleep signalling for the regulation of circadian timing in mice

Affiliations

Adenosine integrates light and sleep signalling for the regulation of circadian timing in mice

Aarti Jagannath et al. Nat Commun. .

Abstract

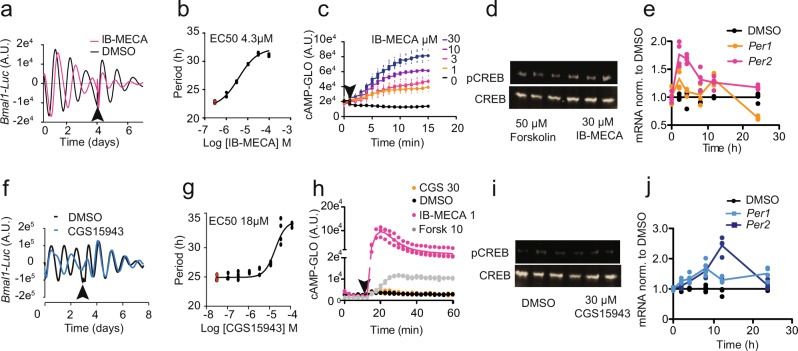
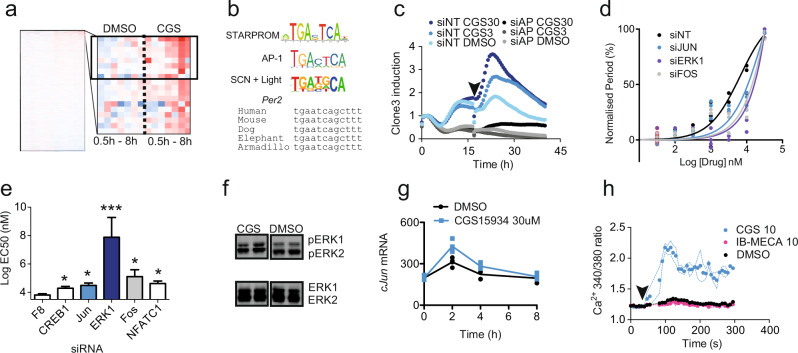
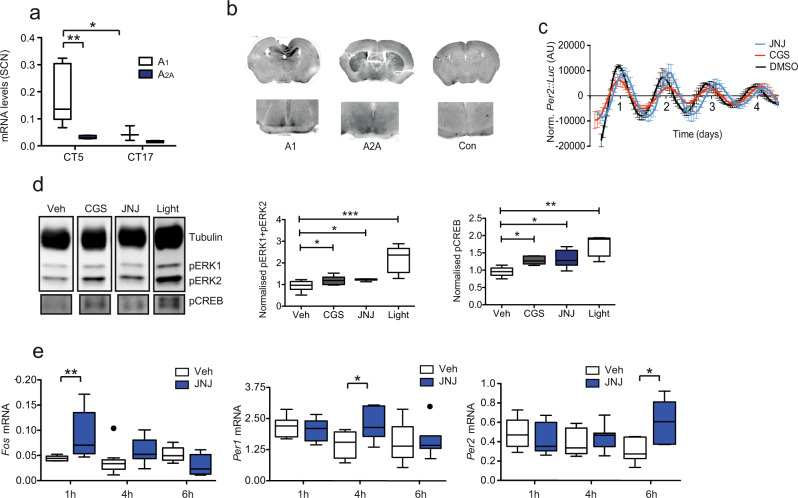
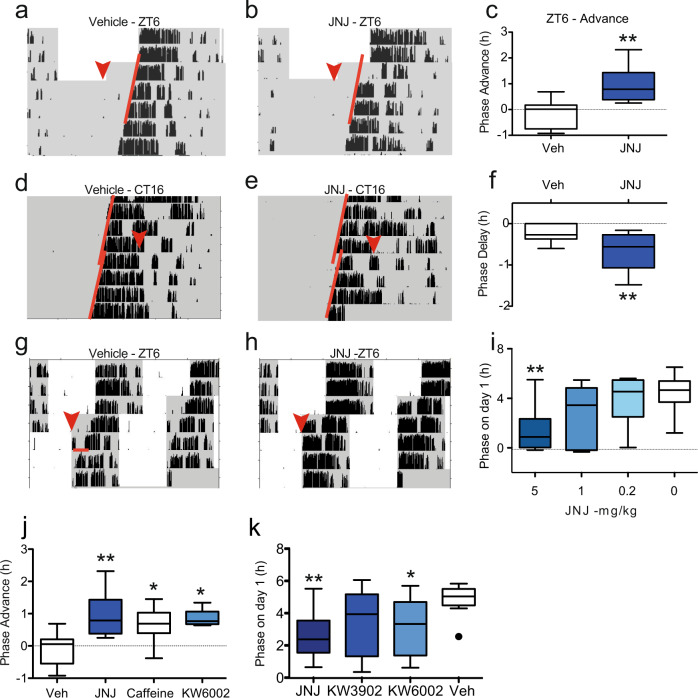
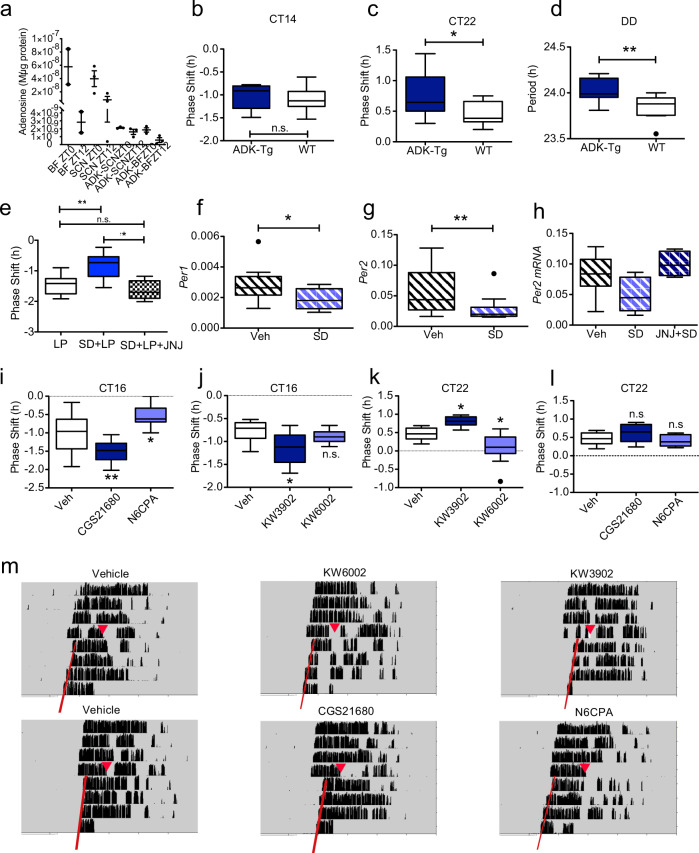
The accumulation of adenosine is strongly correlated with the need for sleep and the detection of sleep pressure is antagonised by caffeine. Caffeine also affects the circadian timing system directly and independently of sleep physiology, but how caffeine mediates these effects upon the circadian clock is unclear. Here we identify an adenosine-based regulatory mechanism that allows sleep and circadian processes to interact for the optimisation of sleep/wake timing in mice. Adenosine encodes sleep history and this signal modulates circadian entrainment by light. Pharmacological and genetic approaches demonstrate that adenosine acts upon the circadian clockwork via adenosine A1/A2A receptor signalling through the activation of the Ca2+ -ERK-AP-1 and CREB/CRTC1-CRE pathways to regulate the clock genes Per1 and Per2. We show that these signalling pathways converge upon and inhibit the same pathways activated by light. Thus, circadian entrainment by light is systematically modulated on a daily basis by sleep history. These findings contribute to our understanding of how adenosine integrates signalling from both light and sleep to regulate circadian timing in mice.


Conflict of interest statement

A.J., R.G.F. and S.V. have received funding from Circadian Therapeutics Ltd. All other authors declare no competing interests.

Figures

Fig. 1
Fig. 1. Mechanisms of action of adenosine signalling to the clock.
a 10 μM IB-MECA increased period length in Bmal1-Luc U2OS cells which revert to normal rhythms after washout (arrow) in a concentration-dependent manner (traces are an average of n = 4) as shown in b (n = 4, DMSO control samples in red); c IB-MECA increases cAMP levels (as monitored by the cAMP-GLO assay) in a concentration-dependent manner (n = 6); d 30 µM IB-MECA increases phosphorylation of CREB (pCREB S133) as shown by Western blot (n = 3), Forskolin positive control; e PER1 and PER2 mRNA levels in U2OS cells increase after administration of 10 µM IB-MECA (n = 4, p < 0.001 with two-way ANOVA, p = 0.000074 at 2 h for PER1, and p = 0.00000000000021 and 0.000000024 at 2 h and 4 h for PER2, Šídák’s multiple comparisons test). DMSO control in black. f 10 μM CGS15943 (CGS) increased period length in Bmal1-Luc U2OS cells, which revert to normal rhythms after washout (arrow), in a concentration-dependent manner as shown in g, n = 4 DMSO control samples in red. h cAMP increases as monitored by the cAMP-GLO assay, CGS (30 µM) administered at arrow, controls DMSO, 10 µM Forskolin and IB-MECA 1 µM shown, n = 3; i 30 µM CGS did not increase phosphorylation of CREB as shown by Western blot (n = 3). DMSO control shown; note d and i are part of the same blot, forskolin positive control. j PER1 and PER2 mRNA levels in U2OS increase after treatment with 10 µM CGS (n = 4, p = 0.03 for PER1 and p = 0.0006 for PER2 with two-way ANOVA). DMSO control in black.
Fig. 2
Fig. 2. STAR_PROM identifies ERK-AP1 pathway downstream of adenosine signalling.
a Time course of RNA-seq reads for barcoded luciferase from BC-STARPROM reporter transfected U2OS cells treated with DMSO control or 30 μM CGS (n = 2, timeline – 0, 0.5, 1, 2, 4 and 8 h after treatment). The enlarged cluster shows the top 20 upregulated clones, of which 8 were statistically significant (boxed, p < 0.05, two-way ANOVA). b Consensus sequence from the upregulated clones with the consensus AP-1 RE and the light-regulated SCN transcriptome motif shown for comparison. The conservation of the AP-1 RE in the PER2 gene is indicated, genomic position 2:238287740 (hg38) in humans and 1:91458384 (mm9) in mice. c Reporter activity of clone3 after knockdown of FOS and JUN (siAP1 – grey) when compared with a non-targeting siRNA control (siNT – blue) in response to CGS (30 μM – C30, 3 μM – C3 or DMSO, n = 4, single trace shown for clarity). d, e Concentration response curves and EC50 of CGS-mediated period lengthening in Per2-Luc U2OS cells after knockdown of the genes indicated (n = 4, DMSO controls outlined in red * = p < 0.05, *** = p < 0.001 One-way ANOVA, Bonferroni post-hoc test); EC50 error calculated from raw data in (n). f Increased phosphorylation of ERK1/2 (pT202/Y204 – pERK) with 30 μM CGS treatment in U2OS cells (48% ± 18% increase, p = 0.03, n = 3 to 6, one-way ANOVA, Tukey’s post-hoc test). g cJUN mRNA increases after treatment with 30 μM CGS – C30 (n = 4, ** = p < 0.0021 at 2 h, Šídák’s multiple comparisons test). h Ca2+ release in response to 10 µM CGS administered at arrow, measured by Fura2 reporter. IB-MECA caused no change. Dashed lines indicate range of data. Individual data points overlaid on all charts with line representing mean, unless otherwise indicated, error bars = S.E.M.
Fig. 3
Fig. 3. The SCN expresses adenosine receptors and responds to adenosine receptor antagonists.
a Expression of adenosine receptor (Adora) subtypes within the mouse SCN at two different circadian times (n = 5, A1 at a higher concentration compared to A2A p = 0.0138, and at higher levels at CT5 (0.178 ± 0.04) compared to CT17 (0.073 ± 0.03) p = 0.0223, two-way ANOVA with Bonferroni post-hoc test). b Immunohistochemistry for A2A and A1 receptor subtypes showing expression within the SCN (inset). c SCN slice cultures from Per2::Luc mice treated with the A2A/A1 antagonists CGS15943 (CGS) 10 μM (red, period length 25.1 ± 0.1 h, n = 3) and JNJ40255392 (JNJ) 10 μM (blue, period length 26.24 ± 0.3 h; n = 5; DMSO 23.1 h ± 0.3 h n = 5; p = 0.0000076439 for CGS and 0.0484 for JNJ, Tukey’s multiple comparisons test. d Western blot with antibodies against pERK1/2 (pT202/Y204 - pERK) and pCREB (pS133) within the SCN collected from mice 45 min after i.p. injection of CGS or JNJ at 5 mg/kg at CT6, SCN collected from mice exposed to a 30 min CT16 light pulse included for comparison (n = 7 from two experiments of n = 3 and n = 4, uncut blots shown in Supplementary material, one-way ANOVA with Bonferroni post-hoc test). Box plots show relative expression. e Increases in Fos, Per1, and Per2 mRNA within the SCN after i.p. injection of JNJ at CT6 after 1, 4 and 6 h respectively, n = 6–10. p = 0.0387 for Fos, 1 h; p = 0.0183 for Per1, 4 h and p = 0.0322 for Per2, 6 h, one-way ANOVA with Bonferroni post-hoc test. Tukey’s box plots used throughout (central line – mean, box represents 25th to 75th percentile data, whiskers are 1.5 interquartile range).
Fig. 4
Fig. 4. A2A/A1 adenosine receptor antagonists modify circadian behaviour.
ac Mice were housed in 12:12 L:D cycle, (grey – dark, white – light, black vertical bars show wheel running activity). At the red arrow (ZT6), animals received an i.p. injection of a vehicle or b 5 mg/kg JNJ40255392 (JNJ) and released into constant dark (DD). Activity onset on subsequent days is indicated by red line and c phase shifts expressed as a Tukey’s box plot (n = 12 and 8, ** = p = 0.0012, one-way ANOVA with Dunnett’s multiple comparisons test). d Mice were housed in DD (CT16) received either vehicle or e 5 mg/kg JNJ at red arrow (CT16) and f phase shifts measured (n = 11 and 10, *p = 0.007, t-test). gi Mice were housed in 12:12 LD received either g vehicle (n = 12) or h JNJ at 5 (n = 12), 1 (n = 6) or 0.2 (n = 6) mg/kg at ZT6 (red arrow) and LD cycle advanced by 6 h. The phase of activity was measured the day after the injection (red line) (i) (n as above). JNJ in a dose-dependent manner enhances re-entrainment (p = 0.0031, one-way ANOVA). j JNJ at 5 mg/kg (n = 8) causes the largest phase shifts when administered at CT6 (p = 0.0012) compared with either caffeine (n = 9, 50 mg/kg, p = 0.0063) or KW6002 (n = 5, 1 mg/kg, p = 0.0151) (one-way ANOVA with Dunnett’s multiple comparisons test, no significant difference between caffeine and JNJ treatment). k JNJ is more effective than the control and the specific A2A antagonist KW6002 1 mg/kg, and the specific A1 antagonist KW3902 1 mg/kg for re-entrainment as measured using the 6 h phase advance protocol, n = 12. One-way ANOVA, Dunnett’s multiple test correction, p = 0.0023 for JNJ and p = 0.0342 for KW6002 vs vehicle. Tukey’s box plots used throughout (central line – mean, box represents 25th to 75th percentile data, whiskers are 1.5 interquartile range).
Fig. 5
Fig. 5. Altered levels of endogenous adenosine regulate circadian rhythms in vivo.
a Basal forebrain (BF) and SCN were collected from wild type and human adenosine kinase overexpressing transgenic mice (Adk-Tg - ADK) at indicated circadian times. Each sample is a pool of 5–7 individual tissue punches. b Phase shifting in Adk-Tg animals (ADK-Tg) and wild type (WT) in response to a 1 h 200 lux light pulse at CT14 (n = 10 and 9, no significant difference, t-test) (b) and CT22 (c) (n = 14 and 8, p = 0.0439, t-test). d Free running period of the same mice in DD (n = 12 and 9, p = 0.0071). * = p < 0.05, ** = p < 0.01 t-test. e Behavioural phase-shifts in response to a 30 min 20 lux light pulse (LP) at CT14 (n = 14) is attenuated by sleep deprivation (SD, n = 10) for the previous 6 h (p = 0.0001, n = 9–11), but potentiated when pretreated with 5 mg/kg JNJ (n = 9, p = 0.0007) one-way ANOVA with Tukey multiple comparisons. f Sleep deprivation (ZT6-12) reduces the expression of Per1 (n = 11,11, t-test, p = 0.031) and g Per2 mRNA (n = 12,12 t-test, p = 0.025) within the SCN. h JNJ (5 mg/kg i.p. administered at ZT6) reverses the attenuation of Per2 within the SCN (n = 9,11, 8, p = 0.0006, one-way ANOVA with Dunnett’s multiple test correction). im Behavioural phase shifts in response to light and drugs that modulate adenosine signalling via specific A1 or A2A receptor agonists or antagonists: i N6CPA (A1 agonist, 0.5 mg/kg, p = 0.0164) and CGS21680 (A2A agonist, 0.5 mg/kg, p = 0.0046) (n = 12, 9, 13) and j KW3902 (A1 antagonist, 1 mg/kg, p = 0.0051) and KW6002 (A2A antagonist, 1 mg/kg) (n = 11, 9, 11). In i and j the phase-delaying phase shifts induced by a light pulse (30 min, 10 lux) delivered at CT16 are shown. For comparison, the phase-advance induced by a 30 min 100 lux light pulse at CT22 is shown in k (n = 10, 9, 10) and l (n = 10, 8, 8) (p = 0.0188 for KW3902 and p = 0.0078 for KW6002. One-way ANOVA for il, Dunnett’s multiple test correction. Tukey’s box plots used throughout (central line – mean box represents 25th to 75th percentile data, whiskers are 1.5 interquartile range). m Representative actograms are shown for iI.

References

    1. Hughes S, Jagannath A, Hankins MW, Foster RG, Peirson SN. Photic regulation of clock systems. Methods Enzymol. 2015;552:125–143. doi: 10.1016/bs.mie.2014.10.018. - DOI - PubMed
    1. Jagannath A, et al. The CRTC1-SIK1 pathway regulates entrainment of the circadian clock. Cell. 2013;154:1100–1111. doi: 10.1016/j.cell.2013.08.004. - DOI - PMC - PubMed
    1. Balsalobre A, et al. Resetting of circadian time in peripheral tissues by glucocorticoid signaling. Science. 2000;289:2344–2347. doi: 10.1126/science.289.5488.2344. - DOI - PubMed
    1. Welsh DK, Takahashi JS, Kay SA. Suprachiasmatic nucleus: cell autonomy and network properties. Annu Rev. Physiol. 2010;72:551–577. doi: 10.1146/annurev-physiol-021909-135919. - DOI - PMC - PubMed
    1. Golombek DA, Rosenstein RE. Physiology of circadian entrainment. Physiol. Rev. 2010;90:1063–1102. doi: 10.1152/physrev.00009.2009. - DOI - PubMed

Publication types

MeSH terms

LinkOut - more resources