Observational Study
. 2021 Apr 9;12(1):2126.
doi: 10.1038/s41467-021-22344-4.

A prevalent and culturable microbiota links ecological balance to clinical stability of the human lung after transplantation

Affiliations
Observational Study

A prevalent and culturable microbiota links ecological balance to clinical stability of the human lung after transplantation

Sudip Das et al. Nat Commun. .

Abstract

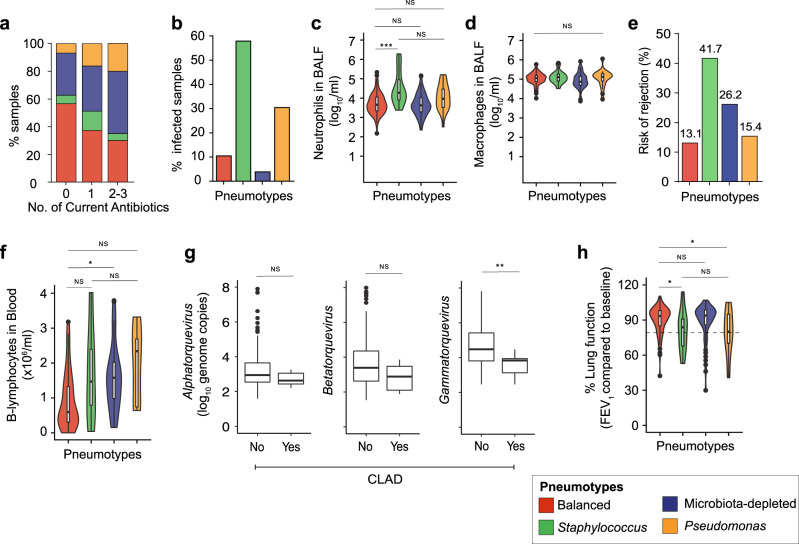
There is accumulating evidence that the lower airway microbiota impacts lung health. However, the link between microbial community composition and lung homeostasis remains elusive. We combine amplicon sequencing and bacterial culturing to characterize the viable bacterial community in 234 longitudinal bronchoalveolar lavage samples from 64 lung transplant recipients and establish links to viral loads, host gene expression, lung function, and transplant health. We find that the lung microbiota post-transplant can be categorized into four distinct compositional states, 'pneumotypes'. The predominant 'balanced' pneumotype is characterized by a diverse bacterial community with moderate viral loads, and host gene expression profiles suggesting immune tolerance. The other three pneumotypes are characterized by being either microbiota-depleted, or dominated by potential pathogens, and are linked to increased immune activity, lower respiratory function, and increased risks of infection and rejection. Collectively, our findings establish a link between the lung microbial ecosystem, human lung function, and clinical stability post-transplant.


Conflict of interest statement

The authors declare no competing interests.

Figures

Fig. 1
Fig. 1. Combining BALF amplicon sequencing and bacterial culturing to deduce the microbial ecology of deep lung microbiota.
a Schematic of the sampling of Bronchoalveolar lavage fluid (BALF) from lung transplant recipients over time (months post-transplant). b Relative abundances (%) of most abundant phyla across BALF samples. Box plots show median (middle line), 25th, 75th percentile (box) and 5th and 95th percentile (whiskers) as well as outliers (single points). c Prevalence (% samples) vs contribution to total reads across samples for most abundant phyla. Dot color shows different genera and size show total rarefied reads. Gray dashed horizontal line shows prevalence ≥50%. d Scatter plot shows correlation between number of observed OTUs and bacterial counts per BALF sample obtained by quantifying 16S rRNA gene copies with qPCR. Linear regression is shown by the blue line with gray shaded area showing 95% confidence interval (n = 234, two-sided, F(1, 232) = 91.04, P = 2.2 × 10−16), Coefficient of correlation; R2 = 0.28. e Bar chart shows lung taxa (genera; OTU IDs) that contributed ≥75% of total bacterial biomass across samples (n = 234). Venn diagram inset shows overlap (yellow) between the most prevalent (≥50% incidence, light blue) and the most abundant (≥75% total count, red) taxa in the transplanted lung. Bar colors also show the same.
Fig. 2
Fig. 2. A lung microbiota culture collection (LuMiCol) reveals extended diversity and phenotypic characteristics of the lower airway bacterial community.
a Phylogenetic tree of the 47 OTU-isolate matching pairs inferred with FastTree. Branch bootstrap support values (size of dark gray circles) ≥80% are displayed. b Growth characteristics of each OTU-isolate matching pair in three different oxygen conditions (Anaerobic - light brown, 5% CO2-yellow, aerobic-light blue, n = 3). Column with pie charts shows growth on semi-solid agar. Heatmap shows median change in Optical Density (OD) at 600 nm growth in three different liquid media (THY, RPMI, RPMI without glucose) over 3 days. c Cumulative counts of each OTU-isolate matching pair across all BALF samples (gray). d Number of isolates in Lumicol (black) per OTU-isolate matching pair. Taxa are labeled as genus; OTU ID, with an indication of whether they are prevalent (gray rectangle) or opportunistic (magenta rectangle) in the lower airway community. The names of the closest hit in databases: eHOMD and SILVA are used as species descriptor.
Fig. 3
Fig. 3. Bacterial communities of the lung post-transplant fall into four ‘pneumotypes’ with distinct community characteristics.
a, b Principal component analysis shows Partition around medoids (PAMs) at phylum and OTU level respectively generated by k-medoid-based unsupervised machine learning using Bray–Curtis dissimilarity (occurrence and abundance). Pneumotypes are color coded: Balanced (red, n = 115), Staphylococcus (green, n = 19), Microbiota-depleted (MD, blue, n = 76), and Pseudomonas (orange, n = 24). cg Violin plots show distributions of pairwise species occurrence (Sorenson’s index, PERMANOVA, two-sided, F(3, 229) = 8.49, P = 9.9 × 10−5), OTU diversity (Kruskal–Wallis test, χ2 = 89.2, df = 3, two-sided, P = 2.2 × 10−16), OTU richness (ANOVA, F(3, 229) = 43.9, two-sided, P = 2.2 × 10−16), proportion of most dominant OTUs (Kruskal–Wallis test, χ2 = 94.45, df = 3, two-sided, P = 2.2 × 10−16), and total bacterial counts (ANOVA, F(3, 229) = 43.9, two-sided, P = 2.2 × 10−16), respectively, across the four pneumotypes. h, i Enrichment analysis of prevalence (green dotted line ≥50%) and absolute abundance across all samples of the 30 most dominant taxa (i.e., OTUs) in PneumotypeBalanced and PneumotypeMD respectively, when each was compared to the other three combined pneumotypes (gray boxes). Differential abundances after enrichment analysis was calculated between each PAM and the other three PAMs combined, using ART-ANOVA. j Heatmap shows relative percentage of taxa (right colored panel) cultured from paired samples of Bronchial aspiration (BA) and Bronchoalveolar lavage fluid (BALF) from each pneumotype (left colored panel). Oropharyngeal flora mainly corresponds to PneumotypeBalanced (i.e., Streptococcus, Prevotella, Veillonella). All box plots including insets show median (middle line), 25th, 75th percentile (box) and 5th and 95th percentile (whiskers) as well as outliers (single points). Multiple comparison of beta diversity indices was done by pairwise PERMANOVA (adonis) with False Discovery rate (FDR). Post hoc analyses (95% Confidence Interval) were done by using Tukey’s test (ANOVA) or Dunn’s test (Kruskal test) with False Discovery Rate (FDR) or least-squares means (ART-ANOVA) with False Discovery Rate (FDR). * P < 0.05, ** P < 0.01, *** P < 0.001, NS = not significant.
Fig. 4
Fig. 4. Host gene expression in the lung differs according to pneumotype and bacterial load.
a Radar plots show median-normalized expression of 31 host genes (radial axes) in the cell fraction of all BALF samples split by four pneumotypes. Circular distribution of genes is color-coded by seven functional categories and ticks (gray shading) show increase in expression from the inside to outside of the circle. b Importance scores (99% Confidence Interval) of host genes predictors of pneumotypes analyzed by Random Forest classification model and Boruta feature selection. Predictor genes are categorized into Confirmed (Green), Tentative (Yellow) and Rejected (Orange), ntrees = number of decision trees, splits per try = number of random predictors sub-sampled. ch Violin plots showing distribution of expression (log2 fold) of host genes with Importance scores >10 for pneumotype prediction (n = 229): IFNLR1 (Kruskal test, χ2 = 59.18, df = 3, two-sided, P = 8.8 × 10−13), MRC1 (ANOVA, F(3, 225) = 17.93, two-sided, P = 1.8 × 10−10), LY96 (Kruskal test, χ2 = 33.87, df = 3, two-sided, P = 2.1 × 10−7), IL10 (Kruskal test, χ2 = 58.82, df = 3, two-sided, P = 1.0 × 10−12), IL1RN (Kruskal test, χ2 = 58.02, df = 3, two-sided, P = 1.5 × 10−12) and PDGFD (Kruskal test, χ2 = 58.02, df = 3, two-sided, P = 8.7 × 10−10) across the pneumotypes. i Importance scores (99% Confidence Interval) of host genes in predicting bacterial counts analyzed by Random Forest regression model and Boruta feature selection. In addition to ntrees and splits per try = number of random predictors sub-sampled at each step and percent variance explained. j, k Scatter plots show correlation between expression(log2 fold) of PDGFD (stepwise regression AIC = 62.4, ANOVA, t = −5.9, P = 1.09 × 10−8) and IFNLR1 (stepwise regression AIC:35.7, ANOVA, t = 2.5, P = 1.15 × 10−2) and bacterial counts (log10 16 S rRNA copies) across samples (n = 234). Linear regression is shown by the blue line with gray shaded area showing 95% confidence interval. All box plots including insets show median (middle line), 25th, 75th percentile (box) and 5th and 95th percentile (whiskers) as well as outliers (single solid/hollow points). Post hoc analyses (95% Confidence Interval) were done by using Tukey’s test (ANOVA) or Dunn’s test (Kruskal test) with False Discovery Rate (FDR). * P < 0.05, ** P < 0.01, *** P < 0.001, NS = not significant.
Fig. 5
Fig. 5. Anellovirus loads differ according to pneumotype and correlate with host physiology in the transplanted lung.
a Longitudinal progression of Anellovirus load (log10 pan-Anelloviridae genome copies, pink) and its three major genera: Alphatorquevirus (green), Betatorquevirus (turquoise) and Gammatorquevirus (violet) over five time windows after transplantation. Data presented here as mean viral load (points) with error bars showing ±SD. Statistical significance is shown for total Anellovirus loads against time windows (n = 225, ANOVA, F(5, 219) = 13.57, two-sided, P = 6.7 × 10−10). bd Violin plots show distribution of Alphatorquevirus (n = 217, Kruskal test, χ2 = 17.04, df = 3, two-sided, P = 6.9 × 10−4), Betatorquevirus (n = 215, ANOVA, F(3, 211) = 4.57, two-sided, P = 3.97 × 10−3) and Gammatorquevirus (n = 216, Kruskal test, χ2 = 8.94, df = 3, two-sided, P = 3.0 × 10−2) load across pneumotypes (plot colors). e Intra-individual analysis of Gammatorquevirus loads upon transition from PneumotypeBalanced (Red) to PneumotypeMD (Blue) (Wilcoxon test, two-sided, paired, P = 1.7 × 10−3) and vice-versa (Wilcoxon test, two-sided, paired, P = 1.72 × 10−2). Paired data (joined by black lines) presented here are viral genome copies (log10, points). f Importance scores (99% Confidence Interval) of host genes in predicting anellovirus load analyzed by Random Forest regression model and Boruta feature selection. Predictor genes are categorized into Confirmed (Green), Tentative (Yellow) and Rejected (Orange), ntrees = number of decision trees, splits per try = number of random predictors sub-sampled and percent variance explained. g Scatter plots show correlation between expression (log2 fold) of TLR3 (stepwise regression AIC:73.9, ANOVA, t = 3.56, P = 4.58 × 10−4) with total anellovirus load (log10 genome copies) across samples (n = 231). Linear regression is shown by the blue line with gray shaded area showing 95% confidence interval. h Violin plots show distribution of TLR3 expression (log2 fold) across the four pneumotypes (n = 231, Kruskal test, χ2 = 10.66, df = 3, two-sided, P = 1.3 × 10−2),. All box plots including insets show median (middle line), 25th, 75th percentile (box) and 5th and 95th percentile (whiskers) as well as outliers (single points). Post hoc analyses (95% Confidence Interval) were done by using Tukey’s test (ANOVA) or Dunn’s test (Kruskal test) with False Discovery Rate (FDR). * P < 0.05, ** P < 0.01, *** P < 0.001, NS = not significant.
Fig. 6
Fig. 6. Association of post-transplant pneumotypes with pulmonary environment, local and peripheral host immunity and clinical status.
a Stacked bar plots showing proportion of samples associated (n = 223, Fisher’s test, P = 2.0 × 10−3) with the four pneumotypes relative to the number of antibiotics administered. b Bar plots show the proportion of infected samples across four pneumotypes. Presence of infection was categorized as yes/no and statistical analysis was done by a generalized linear model, family = binomial, n = 234, PneumotypeStaphylococcus; P < 0.001 and PneumotypePseudomonas P = 1.6 × 10−2, respectively; Fig. 6b) c, d Violin plots show distribution of Neutrophils (n = 213, ANOVA, F(3, 209) = 11.72, two-sided, P = 3.95 × 10−7) and Macrophages (n = 224, ANOVA, F(3, 211) = 2.35, two-sided, P = 7.57 × 10−2) counts (log10 cells per ml BALF) in lung linked to pneumotypes (plot colors). e Risk of rejection associated with each pneumotype (bar colors) was assessed by the cumulative percentages (%) of samples associated with each of the following conditions (See Methods): Chronic Lung Allograft Dysfunction (CLAD), presence of Donor-specific antibodies (DSA, Mean Fluorescence Intensity > 1000) or Acute cellular rejection (Biopsy score A2). f Violin plots show distribution of B-lymphocytes counts (n = 87, ANOVA, F(3, 83) = 3.84, two-sided, P = 1.26 × 10−2) in the blood associated with the four pneumotypes (plot colors). g Burden of three major anellovirus genera: Alphatorquevirus (Wilcoxon test, two-sided, P = 1.5 × 10−1), Betatorquevirus (Wilcoxon test, two-sided, unpaired, P = 9.0 × 10−2) and Gammatorquevirus (Wilcoxon test, two-sided, unpaired, P = 7.0 × 10−3) (log10 genome copies) in samples associated with CLAD (No or Yes, n = 29). h Violin plot showing distribution of lung function (% compared to baseline) measured by Forced Expiratory Volume in 1 s (FEV1, n = 206, Kruskal test, χ2 = 11.05, df = 3, two-sided, P = 1.1 × 10−2) across four pneumotypes (plot colors). All box plots including insets show median (middle line), 25th, 75th percentile (box) and 5th and 95th percentile (whiskers) as well as outliers (single points). Post hoc analyses (95% Confidence Interval) were done by using Tukey’s test (ANOVA) or Dunn’s test (Kruskal test) with False Discovery Rate (FDR). * P < 0.05, ** P < 0.01, *** P < 0.001, NS = not significant.
Fig. 7
Fig. 7. Longitudinal analysis of lung microbiota post-transplant and dynamics of pneumotype transitions.
a Sankey diagram showing transition of paired samples between pneumotypes (colors) across five time windows. b Markov chain model (See Methods) fitted to the observed pneumotype transitions (n = size of circle). Model was initiated with equal probabilities for each pneumotype (0.25, 100 bootstraps, left panel) and given transition matrix. Pneumotypes are represented by colored arrows/boxes, and the direction of a transition is indicated by a colored arrow of a thickness denoting the probability. c A patient case study showing transition of pneumotypes with clinical characteristics across two transplantation events. The heatmap shows host gene expression with functional categories (see also Fig. 4a, right vertical colored bars), neutrophil counts, bacterial and anellovirus loads in BALF across time and pneumotypes. Taxa obtained in routine clinical culture were abbreviated with letters. Samples positive for infection, ongoing antibiotic treatment or CLAD (black boxes) are presented above bar plots showing % lung function (see also Fig. 6g), across transplantation events and time post-transplantation (months) and pneumotypes (bar colour). d Scheme of bimodal disruption in lung ecosystem (colored arrows in a x–y plot) leading either to (i) a microbiota-depleted pneumotype with ambigous bacterial diversity (brown), low counts of bacteria (black) and viruses (gray), high lung cellular proliferation and chronic decline in lung function leading to rejection (purple), or (ii) pneumotypes dominated by opportunistic pathogens (Staphylococcus and Pseudomonas) with loss in bacterial diversity, high infection rate and inflammation (red), acute decline in lung function and rejection. Best-case scenario is defined by a middle ground with a balanced pneumotype consisting of the most prevalent bacteria in a homogenous composition with intermediate bacterial diversity, bacterial and viral abundance, high immune-modulatory activity and best preserved lung function. Original graphical art “Created using BioRender.com”.

References

    1. Charlson ES, et al. Topographical continuity of bacterial populations in the healthy human respiratory tract. Am. J. Respir. Crit. Care Med. 2011 doi: 10.1164/rccm.201104-0655OC. - DOI - PMC - PubMed
    1. Bassis, C. M. et al. Analysis of the Upper Respiratory Tract Microbiotas as the Source of the Lung and Gastric Microbiotas in Healthy Individuals. mBio10.1128/mBio.00037-15 (2015). - PMC - PubMed
    1. Dickson, R. P. et al. Bacterial Topography of the Healthy Human Lower Respiratory Tract. mBio10.1128/mBio.02287-16 (2017). - PMC - PubMed
    1. Pattaroni C, et al. Early-Life Formation of the Microbial and Immunological Environment of the Human Airways. Cell Host Microbe. 2018;24:857–865.e4. doi: 10.1016/j.chom.2018.10.019. - DOI - PubMed
    1. Segal LN, et al. Enrichment of lung microbiome with supraglottic taxa is associated with increased pulmonary inflammation. Microbiome. 2013;1:19. doi: 10.1186/2049-2618-1-19. - DOI - PMC - PubMed

Publication types

MeSH terms

LinkOut - more resources