. 2021 Apr 9;12(1):2127.
doi: 10.1038/s41467-021-22333-7.

Bark-dwelling methanotrophic bacteria decrease methane emissions from trees

Affiliations

Bark-dwelling methanotrophic bacteria decrease methane emissions from trees

Luke C Jeffrey et al. Nat Commun. .

Abstract

Tree stems are an important and unconstrained source of methane, yet it is uncertain whether internal microbial controls (i.e. methanotrophy) within tree bark may reduce methane emissions. Here we demonstrate that unique microbial communities dominated by methane-oxidising bacteria (MOB) dwell within bark of Melaleuca quinquenervia, a common, invasive and globally distributed lowland species. In laboratory incubations, methane-inoculated M. quinquenervia bark mediated methane consumption (up to 96.3 µmol m-2 bark d-1) and reveal distinct isotopic δ13C-CH4 enrichment characteristic of MOB. Molecular analysis indicates unique microbial communities reside within the bark, with MOB primarily from the genus Methylomonas comprising up to 25 % of the total microbial community. Methanotroph abundance was linearly correlated to methane uptake rates (R2 = 0.76, p = 0.006). Finally, field-based methane oxidation inhibition experiments demonstrate that bark-dwelling MOB reduce methane emissions by 36 ± 5 %. These multiple complementary lines of evidence indicate that bark-dwelling MOB represent a potentially significant methane sink, and an important frontier for further research.


Conflict of interest statement

The authors declare no competing interests

Figures
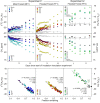
Fig. 1
Fig. 1. Methane oxidising bacteria (MOB) time series incubation experiments of methane-inoculated M. quinquenervia bark.
The panels depict oxidation as δ13C–CH4 enrichment vs time (top), decrease in methane concentration (ppm) vs time (middle) and the δ13C–CH4 vs fraction remaining (bottom). Note: Different δ13C–CH4 (‰) starting values between the first (MF, FF1) and second (FF2) experiments are due to using a different methane gas standard. Coloured symbols represent each bark sample (see Supplementary Table 1, T = tree), error bars are ±SD and α = fractionation factor. Average values for both controls (blank bottles and sterilised bark) are shown as grey symbols with trend line. Note: T1, T2 and T6 were removed from fraction remaining correlation due to lack of MOB oxidation, which was supported by lower MOB abundance within the paired bark samples (see microbial data in Fig. 2). Fraction remaining is the proportion of methane not oxidised by MOB during the time series.
Fig. 2
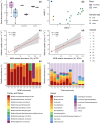
Fig. 2. Summary of abundance, composition and structure of total microbial and methanotroph (MOB) communities in M. quinquenervia bark (n = 14, T = tree), sediment sample (n = 2, S = sediment) and water samples (n = 2, W = water).
a Abundance determined by quantitative PCR of the total microbial community (universal 16 S rRNA gene copy number) and of the MOB community (pmoA gene copy number). Box plots depict medians, lower and upper quartiles and maximum and minimum values. b Non-metric multidimensional scaling (nMDS) ordination of the MOB community structure (beta diversity) measured by Bray–Curtis distance matrix of the 16 S rRNA gene amplicon sequences affiliated with known methanotrophic families and genera. c, d Correlation between laboratory incubation measurements of the first 24 h of methane uptake from bark samples (Supplementary Table 1) and logit-transformed MOB community proportion in the total community (percentage of MOB relative abundance) inferred from qPCR (c) and 16 S rRNA amplicon sequence variants (d) (linear regression and t test; n = 7; df = 6; the grey area indicates 95% confidence interval) e Relative abundance of methanotrophic genera identified from the analysis of the 16 S rRNA gene amplicon sequences. In the case of uncultured genera, taxonomic resolution according to family is reported. f Relative abundance of 16 S rRNA gene amplicon sequences resolved at the taxonomic level of genus.
Fig. 3
Fig. 3. Summary of in situ methanotroph (MOB) inhibitor tests conducted using difluoromethane (DFM) on M. quinquenervia bark revealing the mostly positive % increase in methane fluxes ~1 h after the addition of DFM and non-parametric distribution (Shapiro–Wilk, W-stat = 0.841).
The blank replicates (i.e. repeated chamber measurements after ~1 h, but no DFM addition) showed no change in mean methane fluxes (3.1 ± 2.5%) and normal distribution (Shapiro–Wilk, W-stat = 0.989). There were significant differences between treatments a and b (ANOVA on-ranks, p < 0.001). Note: The box represents the 25–75 percentile, error bars 1–99 percentile, the solid horizontal line is the median, dashed line and small square = mean () and the curved line and scatter plots show the data distribution.

References

    1. Neubauer SC, Megonigal JP. Moving beyond global warming potentials to quantify the climatic role of ecosystems. Ecosystems. 2015;18:1000–1013. doi: 10.1007/s10021-015-9879-4. - DOI
    1. Barba J, et al. Methane emissions from tree stems: a new frontier in the global carbon cycle. N. Phytologist. 2019;222:18–28. doi: 10.1111/nph.15582. - DOI - PubMed
    1. Covey KR, Megonigal JP. Methane production and emissions in trees and forests. N. Phytologist. 2019;222:35–51. doi: 10.1111/nph.15624. - DOI - PubMed
    1. Saunois, M. et al. The global methane budget 2000-2017. Earth Syst. Sci. Data10.5194/essd-2019-128 (2019).
    1. Pangala SR, et al. Large emissions from floodplain trees close the Amazon methane budget. Nature. 2017;552:230. doi: 10.1038/nature24639. - DOI - PubMed

Publication types