. 2021 Apr 9;12(1):2130.
doi: 10.1038/s41467-021-22397-5.

Coding and non-coding roles of MOCCI (C15ORF48) coordinate to regulate host inflammation and immunity

Affiliations

Coding and non-coding roles of MOCCI (C15ORF48) coordinate to regulate host inflammation and immunity

Cheryl Q E Lee et al. Nat Commun. .

Abstract

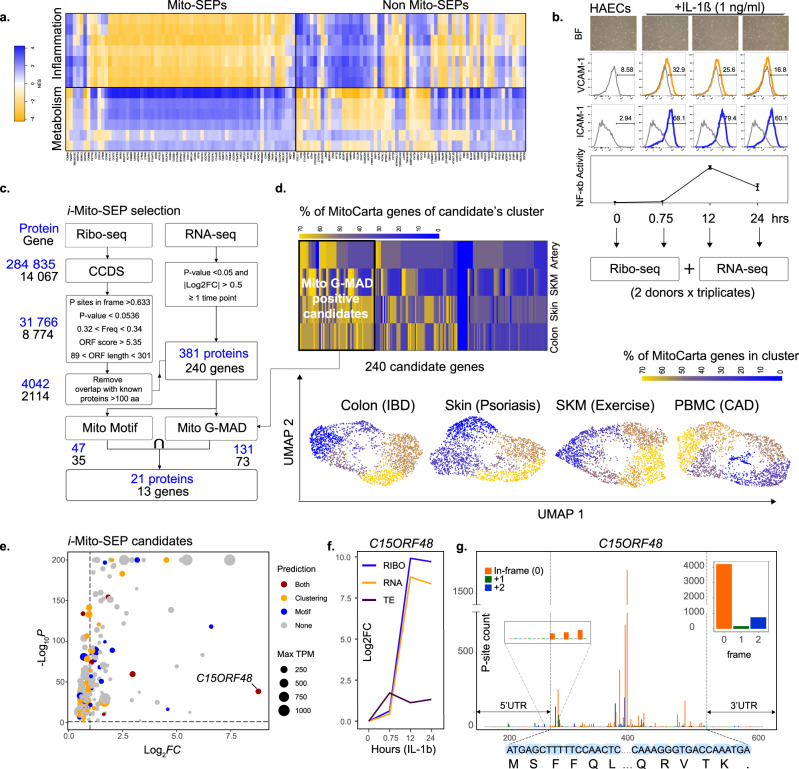
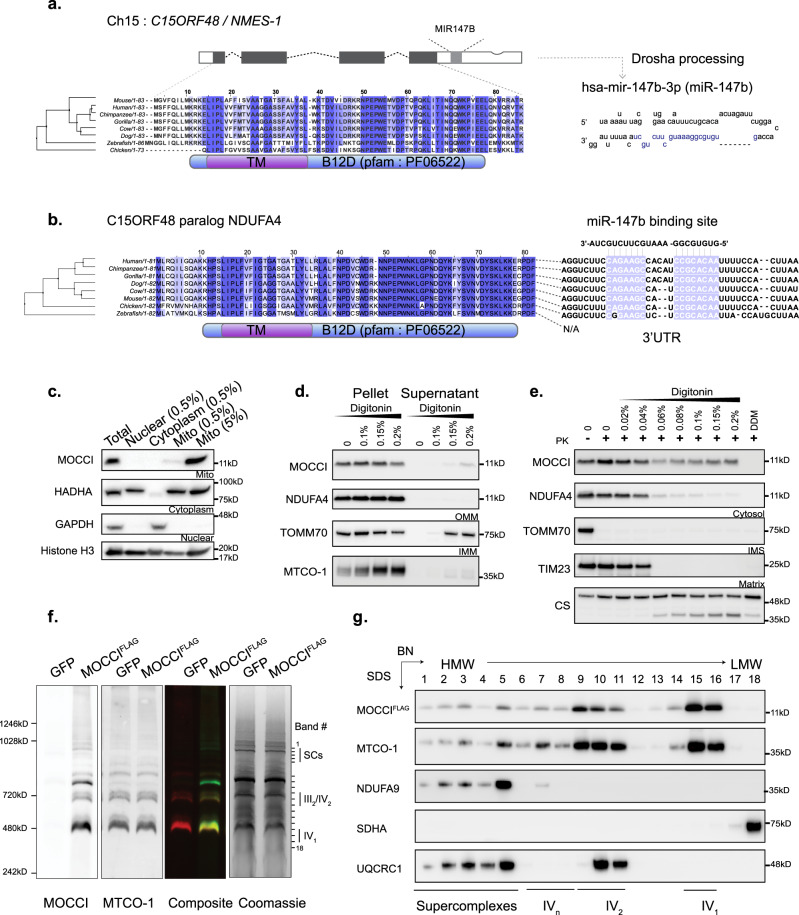
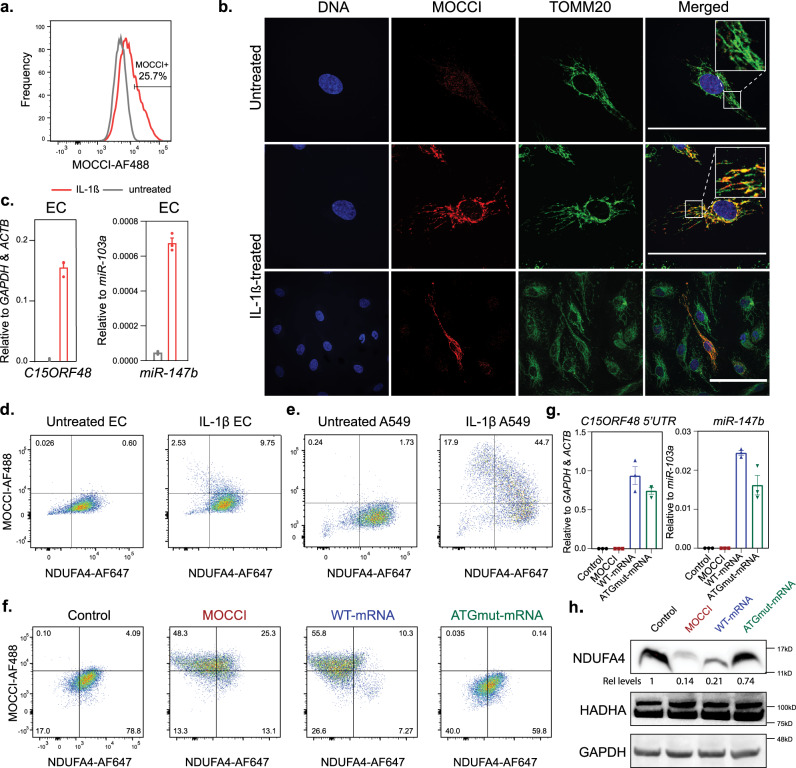
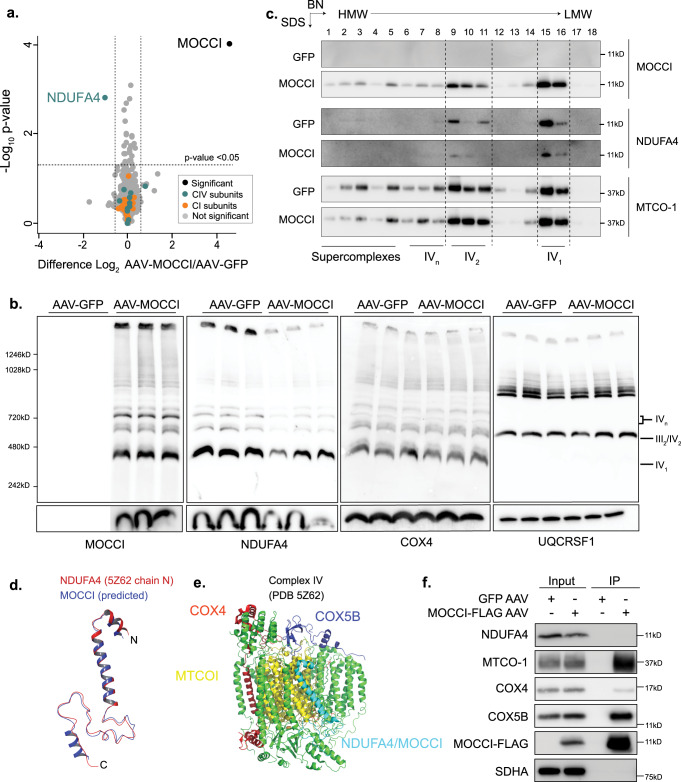
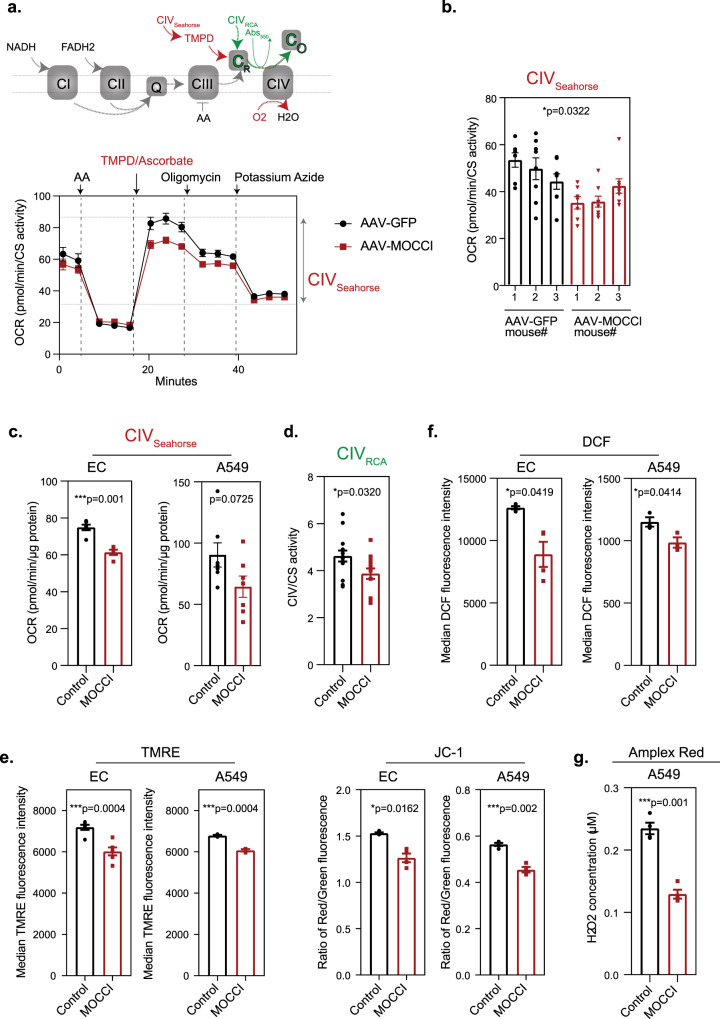
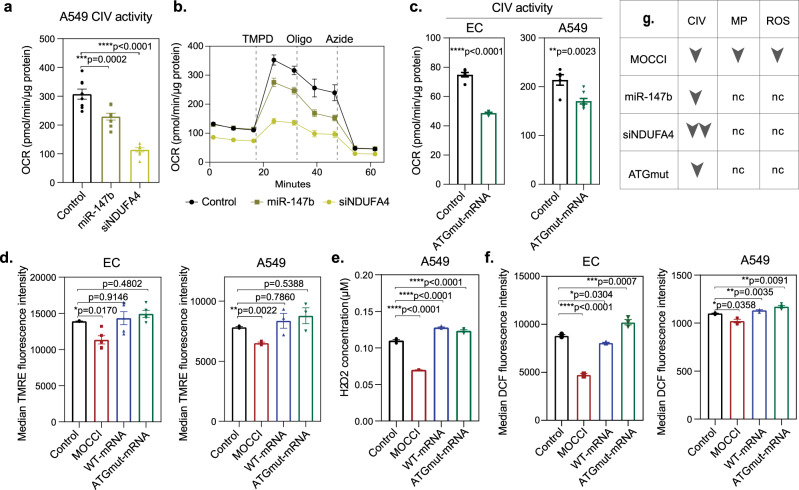
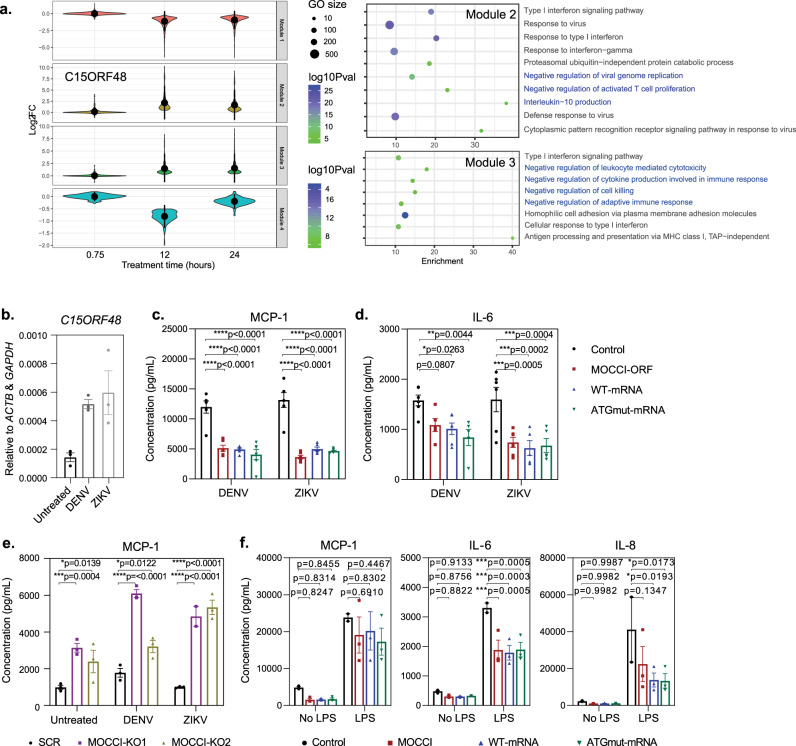
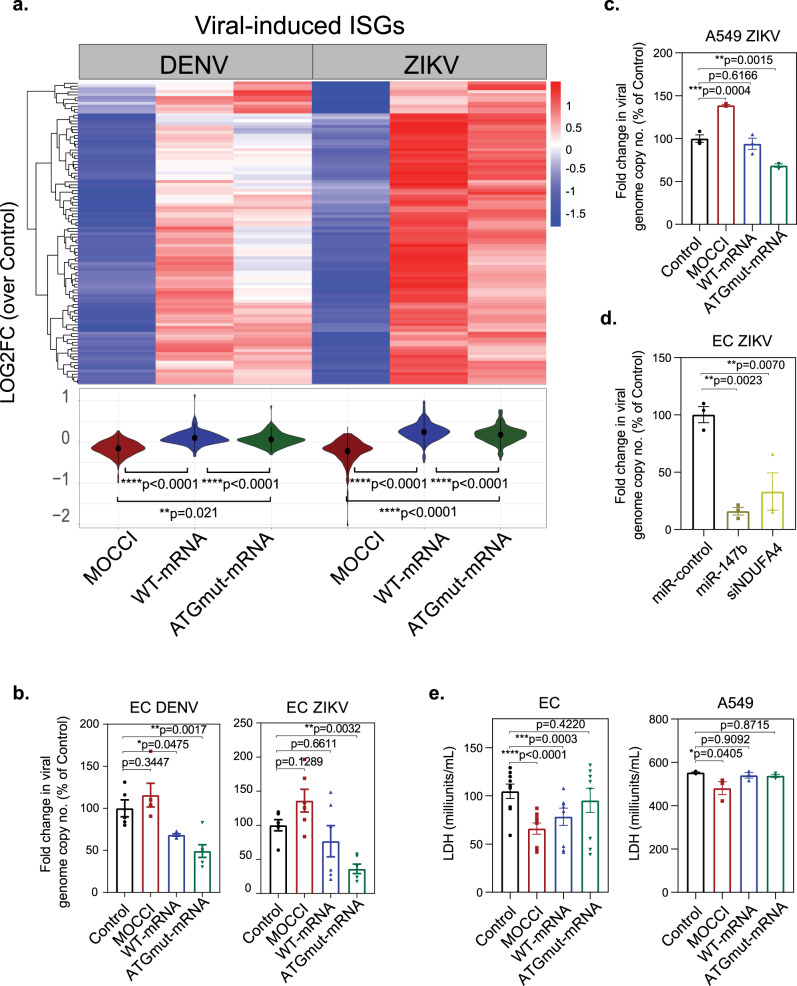
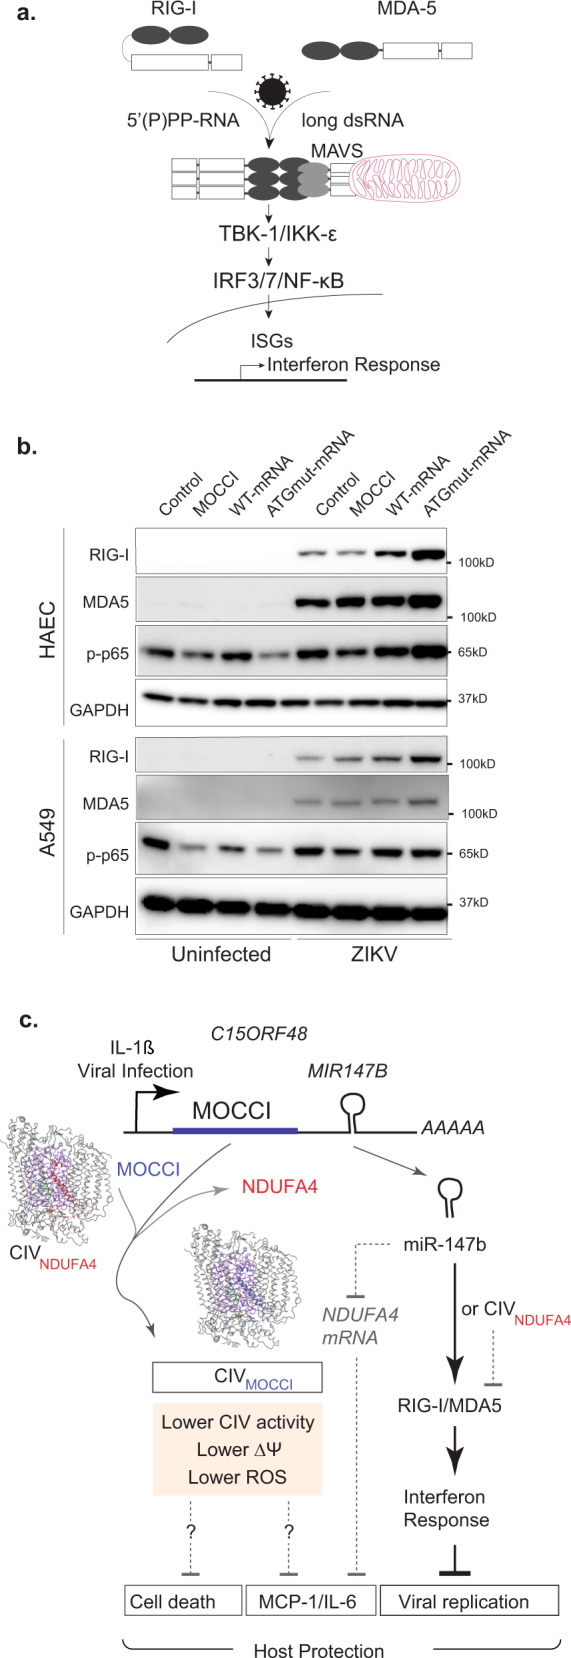
Mito-SEPs are small open reading frame-encoded peptides that localize to the mitochondria to regulate metabolism. Motivated by an intriguing negative association between mito-SEPs and inflammation, here we screen for mito-SEPs that modify inflammatory outcomes and report a mito-SEP named "Modulator of cytochrome C oxidase during Inflammation" (MOCCI) that is upregulated during inflammation and infection to promote host-protective resolution. MOCCI, a paralog of the NDUFA4 subunit of cytochrome C oxidase (Complex IV), replaces NDUFA4 in Complex IV during inflammation to lower mitochondrial membrane potential and reduce ROS production, leading to cyto-protection and dampened immune response. The MOCCI transcript also generates miR-147b, which targets the NDUFA4 mRNA with similar immune dampening effects as MOCCI, but simultaneously enhances RIG-I/MDA-5-mediated viral immunity. Our work uncovers a dual-component pleiotropic regulation of host inflammation and immunity by MOCCI (C15ORF48) for safeguarding the host during infection and inflammation.


Conflict of interest statement

The authors declare no competing interests.

Figures

Fig. 1
Fig. 1. Proteogenomic screen in human endothelial cells (HAECs) identifies MOCCI as an inflammatory Mito-SEP (i-Mito-SEP).
a WGCNA-GSEA analysis of mito versus non-mito-SEPs in human failing heart reveals strong anti-correlation of mito-SEPs with inflammation. Each row represents one pathway and the pathways are separated into those that are involved in metabolism and those that are involved in inflammation. Color scale = NES score. Dataset used: European Genome-Phenome Archive EGAS00001002454. b HAECs from two healthy male donors were treated with 1 ng/mL IL-1β for 45 min, 12 and 24 h. All timepoints including untreated controls were analyzed by RNA-seq and Ribo-seq in triplicate. NF-kb reporter activity, ICAM-1, and VCAM-1 expression illustrate the dynamics of the HAEC response: an increase in inflammation up to 12 h followed by resolution thereafter. Data for NF-kb reporter activity are presented as mean ±  SEM. n = 4 biological replicates for NF-kb reporter activity. c Workflow to identify i-Mito-SEPs. Blue numbers indicate the number of SEPs called by RiboTaper and black numbers indicate the number of genes encoding those SEPs (see methods). d Summary of the mitochondrial gene signature workflow. (Bottom) UMAP of gene module association determination (G-MAD) scores of MitoCarta and random genes in human colon, skin, skeletal muscle (SKM), and PBMCs undergoing inflammation. Color scale indicates the percentage of mitochondrial genes in each cluster. Based on their G-MAD, the 240 candidate genes from c were assigned to a cluster in each dataset. (Top) Heatmap depicting the percentage of mitochondrial genes in a candidate’s cluster in each of the four datasets. Each column represents one candidate. Top scoring candidates were returned to the pipeline in c for further consideration. Datasets used were: GSE11223, GSE14905, GSE120862, and GSE9820. e Volcano plot of the maximal fold change of the 240 candidate genes during the IL-1β treatment compared to untreated cells. The size of each dot represent the highest TPM reached at any timepoint, while its color indicates if candidate SEP was predicted to localize to the mitochondria by motif, G-MAD or both. The p adjusted values were attained by applying the Wald chi-squared test, followed by correction for multiple testing using the Benjamini and Hochberg method through the DESeq2 pipeline. f MOCCI transcript and translation levels increase by 1000-fold after IL-1β treatment. TE translational efficiency. g Ribo-seq derived p-site read coverage across the MOCCI locus. In-frame (0) and out-of-frame (+1,+2) colored in orange, green, and blue respectively. Inset on the left shows that p-site reads are detected only at the start codon. Inset on the right summarizes the total number of in-frame (0) and out-of frame (+1,+2) reads in dataset.
Fig. 2
Fig. 2. MOCCI is a subunit of Complex IV (cytochrome C oxidase).
a The MOCCI ORF is conserved across vertebrates and contains a predicted transmembrane (TM) domain and the B12D domain found only in NADH-ubiquinone reductase complex 1 MLRQ subunits. The MOCCI transcript is also the host gene for hsa-miR-147b (right), located in the 3′UTR of the transcript. The letters in blue are the sequence of the mature miRNA. b MOCCI is a paralog of NDUFA4 which also contains both the B12D and TM domains. The 3′UTR of the NDUFA4 transcript contains top target site of miR-147b-3p as predicted by TargetScan, miRDB, and miRBase. It is not clear if the binding site in chicken Ndufa4 is functional, as it is not as well conserved. c MOCCI was found in mitochondria-enriched fractions of HEK293T transfected with MOCCI ORF-expressing plasmid (MOCCI-HEK293T). Values given indicates percentage of the total fraction loaded onto the gel. n = 2 biological replicates. Source data are provided as a Source Data file. d Differential solubilization of MOCCI-HEK293T mitochondria indicated that MOCCI was located in the inner membrane (IMM). TOMM70 and MTCO-1 serve as control for outer (OMM) and inner (IMM) mitochondrial membrane proteins, respectively. n = 1 biological replicate. Source data are provided as a Source Data file. e Proteinase K protection assay of MOCCI-HEK293T mitochondria further confirmed IMM localization of MOCCI. n = 1 biological replicate. Source data are provided as a Source Data file. f Blue native PAGE (BN-PAGE) of mouse heart mitochondria with AAV9-mediated MOCCI-FLAG expression (AAV-MOCCI). Probing with α-MOCCI and α-MTCO-1 antibodies, the core enzymatic subunit of CIV, reveal co-migration of MOCCI signal with CIV. AAV-GFP was used as a negative control. Coomassie blue stain of the gel is shown on the right. n = 4 biological replicates. g Two-dimensional BN-SDS-PAGE to confirm co-migration of MOCCI and CIV. The lanes correspond to the bands annotated on the Coomassie blue-stained gel in (f). n = 2 biological replicates. Source data are provided as a Source Data file.
Fig. 3
Fig. 3. MOCCI and miR-147b reduce NDUFA4 expression during inflammation.
a Intracellular flow cytometry staining for MOCCI in untreated (gray line) and IL-1β-treated (red line) human aortic endothelial cells (HAECs). Percentage of MOCCI-positive HAECs is 25.7 ± 5.2% (mean ± se), n = 4 biological replicates per condition. b Co-immunofluorescent staining for MOCCI and TOMM20, a mitochondrial protein in HAECs. Scale bar = 100 µm, n = 3 biological replicates. c C15ORF48 mRNA and miR-147b expression in untreated and IL-1β-treated HAECs. Data are presented as mean ±  SEM, n = 3 biological replicates per condition. d Intracellular flow cytometry staining for NDUFA4 and MOCCI in untreated or IL-1β-treated HAECs. e Intracellular flow cytometry staining for NDUFA4 and MOCCI in untreated or IL-1β-treated A549 cells. f Intracellular flow cytometry staining for NDUFA4 and MOCCI in HAECs overexpressing MOCCI, C15ORF48 WT-mRNA (both MOCCI and miR-147b), and C15ORF48 ATGmut-mRNA (only miR-147b), n = 3 biological replicates per condition. g Levels of C15ORF48 mRNA (primers binding to the 5′UTR of C15ORF48) or miR-147b by qPCR in HAECs with the indicated overexpression. Data were presented as mean ±   SEM, n = 3 biological replicates per condition. h Western blot of NDUFA4 in HAECs with the indicated overexpression. n = 3 biological replicates. Source data are provided as a Source Data file.
Fig. 4
Fig. 4. NDUFA4 is exchanged for MOCCI in Complex IV during inflammation.
a Volcano plot of proteins detected by quantitative TMT-mass spec in AAV-GFP or AAV-MOCCI mouse heart mitochondria. p = two-tailed Student’s t test, n = 3 mice per AAV. b BN-PAGE (top) and SDS-PAGE (bottom) of AAV-MOCCI/GFP mouse heart mitochondria probed for the indicated respiratory chain proteins. Each lane represents mitochondria from one mouse. Quantification of NDUFA4 shown in Supplementary Fig. 4a. c Two-dimensional BN-SDS-PAGE to show downregulation of NDUFA4 in CIV complexes. n = 3 biological replicates. Source data are provided as a Source Data file. d Alignment of the predicted secondary structure of MOCCI (iTASSER model) and known structure of NDUFA4 in Maestro (Schrodinger). e The position of NDUFA4 (ribbon) in CIV cryo-EM structure (PDB 5Z62). All other subunits are depicted in tube representation. MTCO-1 (purple) and the redox centers (HEME-A and Cu2+) are highlighted to illustrate the relative position of NDUFA4. f Co-IP of NDUFA4 and MOCCI. Digitonin (1%)-solubilized isolated mouse heart mitochondria were immunoprecipitated with anti-FLAG and probed for the proteins as indicated. AAV-GFP served as negative control. Source data are provided as a Source Data file.
Fig. 5
Fig. 5. MOCCI reduces CIV activity, membrane potential, and ROS production.
a (Top) Schematic uncoupled electron flow assay on Agilent’s Seahorse platform to measure CIV activity in isolated mitochondria using TMPD/ascorbate as electron donor (see Methods). (Bottom) Seahorse uncoupled electron flow analysis of AAV-MOCCI and AAV-GFP isolated mouse heart mitochondria. Oxygen consumption rate (OCR) was normalized with citric synthase (CS) activity. Dotted line shows the compounds injected at each time point. CIV activity = maximal activity after TMPD addition − minimal activity after azide injection. AA antimycin A, TMPD N,N,N′,N′-Tetramethyl-p-phenylenediamine dihydrochloride. Data were presented as mean and SEM of 3 biological replicates. b CIV activity of AAV-MOCCI and AAV-GFP isolated mouse heart mitochondria as measured by uncoupled electron flow assay on Seahorse shown in (a). Each column represents one mouse, and each dot represents one technical replicate. Data were presented as mean ±  SEM; P = two-tailed unpaired Student’s t test; n = 3 biological replicates with 6 technical replicates each. c CIV activity of digitonin (0.0025%) permeabilized MOCCI and control cells as measured by Seahorse. Data were presented as mean ±  SEM; P = two-tailed unpaired Student’s t test; n = 6 technical replicates each. d CIV activity of MOCCI and control A549 cells as measured by respiratory chain enzyme assay (RCA). Data were presented as mean ±  SEM; P = two-tailed unpaired Student’s t test; n = 8 biological replicates each. e Membrane potential of MOCCI and control cells as measured by flow cytometry of TMRE or JC-1 dye incorporation. Data are presented as mean ±  SEM; P = one-way ANOVA; n = 4 biological replicates per condition from two repeats. f Total cellular ROS levels of MOCCI and control cells as measured by flow cytometry of DCF dye reaction. Data were presented as mean ±  SEM; P = one-way ANOVA; n = 3 biological replicates per condition. g Total cellular ROS levels of MOCCI and control cells as measured by Amplex Red assay. Data were presented as mean ±  SEM; P = one-way ANOVA; n = 4 biological replicates per condition.
Fig. 6
Fig. 6. miR-147b reduces CIV activity but not membrane potential and ROS production.
a CIV activity of permeabilized A549 cells transfected with miR-control, miR-147b mimic, or siNDUFA4 as measured by Seahorse. Data were presented as mean ± SEM; P = one-way ANOVA; n = 8 technical replicates per condition. b Seahorse uncoupled electron flow analysis of CIV activity in permeabilized A549 cells transfected with miR-control, miR-147b mimic, or siNDUFA4, as shown in (a). Oxygen consumption rate (OCR) reads were normalized with protein levels quantified with BCA. Dotted line shows the compounds injected at each time point. CIV activity was measured as activity between the maximal activity after TMPD addition and the minimal activity after azide injection. AA antimycin A, TMPD N,N,N′,N′-Tetramethyl-p-phenylenediamine dihydrochloride, Oligo oligomycin. Data were presented as mean and SEM of eight biological replicates. c CIV activity of permeabilized WT or ATGmut-mRNA overexpressing- HAECs and A549 cells, as measured by Seahorse. Data were presented as mean ± SEM; P = two-tailed unpaired Student’s t test; n = 8 technical replicates per condition. d Membrane potential of HAECs and A549 cells with indicated transgenes as measured by flow cytometry of TMRE dye incorporation. Data were presented as mean ±  SEM; P = one-way ANOVA; n = 4 biological replicates per condition from two repeats. e Total cellular ROS levels of A549 cells with indicated transgenes as measured by Amplex Red assay. Data were presented as mean ± SEM; P = one-way ANOVA; n = 4 biological replicates per condition. Data for control and MOCCI were shown in Fig. 5g. f Total cellular ROS levels of HAECs and A549 cells with indicated transgene as measured by flow cytometry of DCF dye reaction. Data were presented as mean ± SEM; P = one-way ANOVA; n = 3 biological replicates per condition. g Effects of MOCCI, miR-147b mimic, siNDUFA4, and ATGmut-mRNA on CIV activity, membrane potential (MP), and ROS production.
Fig. 7
Fig. 7. MOCCI and miR-147b reduce MCP-1 and IL-6 secretion during viral infection.
a (Left) Differentially expressed genes in the HAECs treated with IL-1β across the timepoint series (Fig. 1b) were clustered into co-expression modules by dynamic tree cut. The log-fold change is relative to the untreated cells. C15ORF48 resides in Module 2. (Right) Panther GO analysis of genes in Module 2 and closely related Module 3 reveal significant enrichments in the ontologies depicted. Size of dot indicates the number of members in each GO annotation and the color indicates the p value of enrichment. b C15ORF48 mRNA levels in HAECs following DENV and ZIKV infection. Data were presented as mean ± SEM; n = 3 biological replicates per condition. c Levels of MCP-1 (CCL2) secreted by HAECs with indicated transgenes following DENV/ZIKV infection. Data were presented as mean ± SEM; P = two-way ANOVA; n = 6 biological replicates per condition. d Levels of IL-6 secreted by HAECs with indicated transgenes following DENV/ZIKV infection. Data were presented as mean ± SEM; P = two-way ANOVA; n = 6 biological replicates per condition. e Levels of MCP-1 (CCL2) secreted by WT and MOCCI-KO HAECs at basal and following DENV/ZIKV infection. Data were presented as mean ± SEM; P = two-way ANOVA; n = 3 biological replicates per condition. f Levels of MCP-1 (CCL2), IL-6, and IL-8 secreted by HAECs with indicated transgenes at basal and following LPS treatment after 24 h. Data were presented as mean ± SEM; P = two-way ANOVA; n = 3 biological replicates per condition.
Fig. 8
Fig. 8. MOCCI and miR-147b coordinate to optimize host protection.
a Heatmap of a subset of DENV and ZIKV-induced genes that were downregulated in MOCCI-expressing cells compared to control, based on RNA-seq (see “Module Detection” in Methods for more details). P = one-way ANOVA; n = 3 biological replicates per condition. MOCCI = MOCCI ORF only; WT-mRNA = MOCCI + miR-147b; ATGmut-mRNA = miR-147b only. b HAECs with the indicated transgenes were infected with DENV and ZIKV (MOI = 1.0). Forty-eight hours later, viral replication was measured by qPCR-mediated viral genome quantification, compared to a baseline obtained at 2 h postinfection. Values are expressed as percentage of the control of each biological replicate. Data were presented as mean ± SEM; P = one-way ANOVA; n = 6 biological replicates per condition. c A549 cells with the indicated transgenes were infected with DENV and ZIKV (MOI = 0.1). Fold change was calculated as the same in “c”. Data were presented as mean ± SEM; P = one-way ANOVA; n = 3 biological replicates per condition. d HAECs transfected with miR-control, miR-147b mimic, or siNDUFA4 were infected with ZIKV (MOI = 1.0). Fold change was calculated as the same in “c”. Data were presented as mean ± SEM; P = one-way ANOVA; n = 3 biological replicates per condition. e Quantitation of cell death in HAECs and A549 cells with indicated transgenes following ZIKV infection as measured by lactate dehydrogenase (LDH) release. Data were presented as mean ± SEM; P = one-way ANOVA; n = 6 biological replicates per condition from two repeats for HAECs and 3 biological replicates per condition for A549 cells.
Fig. 9
Fig. 9. miR-147b works through RIG-I/MDA5 pathway to modulate interferon response.
a RIG-I/MDA5 pathway of viral RNA recognition and interferon response. ISG interferon-stimulated genes. b Western blot of RIG-I, MDA5, and phosphorylated p65 in uninfected and 24 h ZIKV-infected HAECs and A549 cells with the indicated overexpression. n= 2 biological replicates. Source data are provided as a Source Data file. c Model of how coding and non-coding functions of C15ORF48 transcript coordinate to provide host protection during viral infection. The exact mechanism on how inhibiting CIV activity can modulate cytokine secretion and cell death remains an outstanding question.

References

    1. Sugimoto MA, Sousa LP, Pinho V, Perretti M, Teixeira MM. Resolution of inflammation: what controls its onset? Front. Immunol. 2016;7:160. doi: 10.3389/fimmu.2016.00160. - DOI - PMC - PubMed
    1. Bäck, M., Yurdagul, A., Tabas, I., Öörni, K. & Kovanen, P. T. Inflammation and its resolution in atherosclerosis: mediators and therapeutic opportunities. Nat. Rev. Cardiol. 10.1038/s41569-019-0169-2 (2019). - PMC - PubMed
    1. Mehta MM, Weinberg SE, Chandel NS. Mitochondrial control of immunity: beyond ATP. Nat. Rev. Immunol. 2017;17:608–620. doi: 10.1038/nri.2017.66. - DOI - PubMed
    1. Rimessi A, Previati M, Nigro F, Wieckowski MR, Pinton P. Mitochondrial reactive oxygen species and inflammation: molecular mechanisms, diseases and promising therapies. Int. J. Biochem. Cell Biol. 2016;81:281–293. doi: 10.1016/j.biocel.2016.06.015. - DOI - PubMed
    1. Vazquez C, Horner SM. MAVS coordination of antiviral innate immunity. J. Virol. 2015;89:6974–6977. doi: 10.1128/JVI.01918-14. - DOI - PMC - PubMed

Publication types

MeSH terms

LinkOut - more resources