. 2021 Apr 9;12(1):2141.
doi: 10.1038/s41467-021-22331-9.

Single-cell RNA sequencing reveals the mesangial identity and species diversity of glomerular cell transcriptomes

Affiliations

Single-cell RNA sequencing reveals the mesangial identity and species diversity of glomerular cell transcriptomes

Bing He et al. Nat Commun. .

Abstract

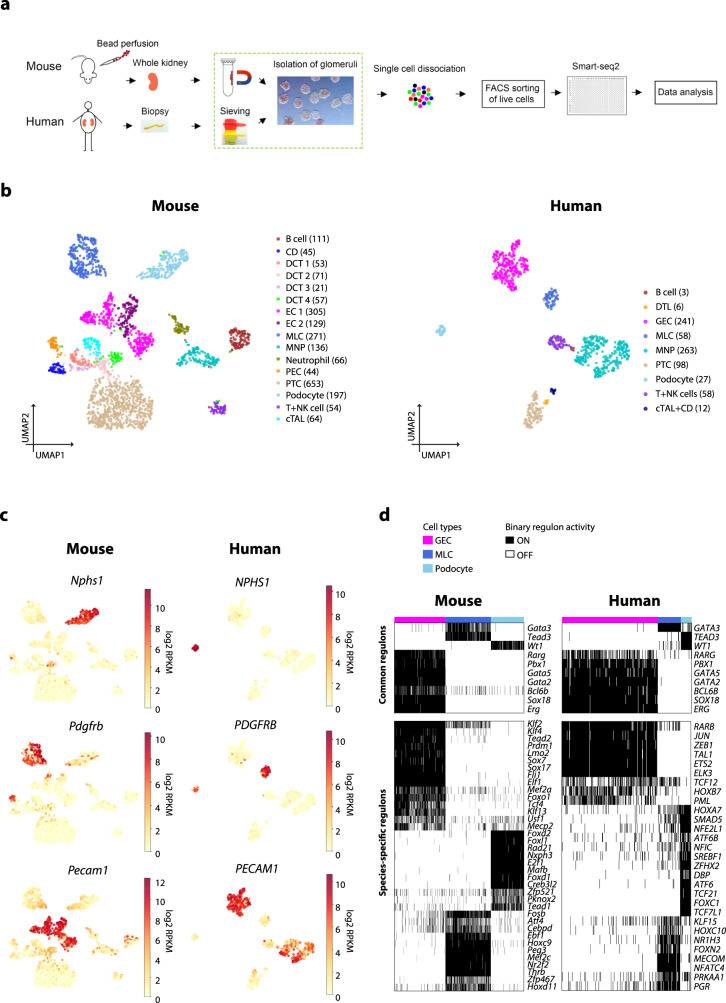
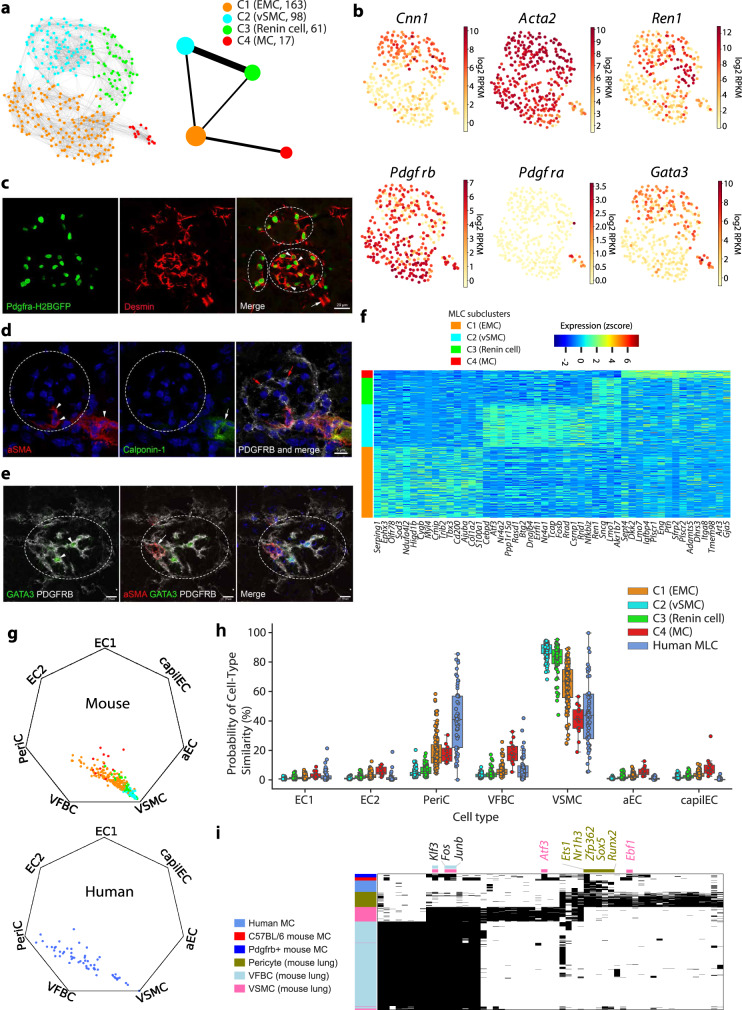
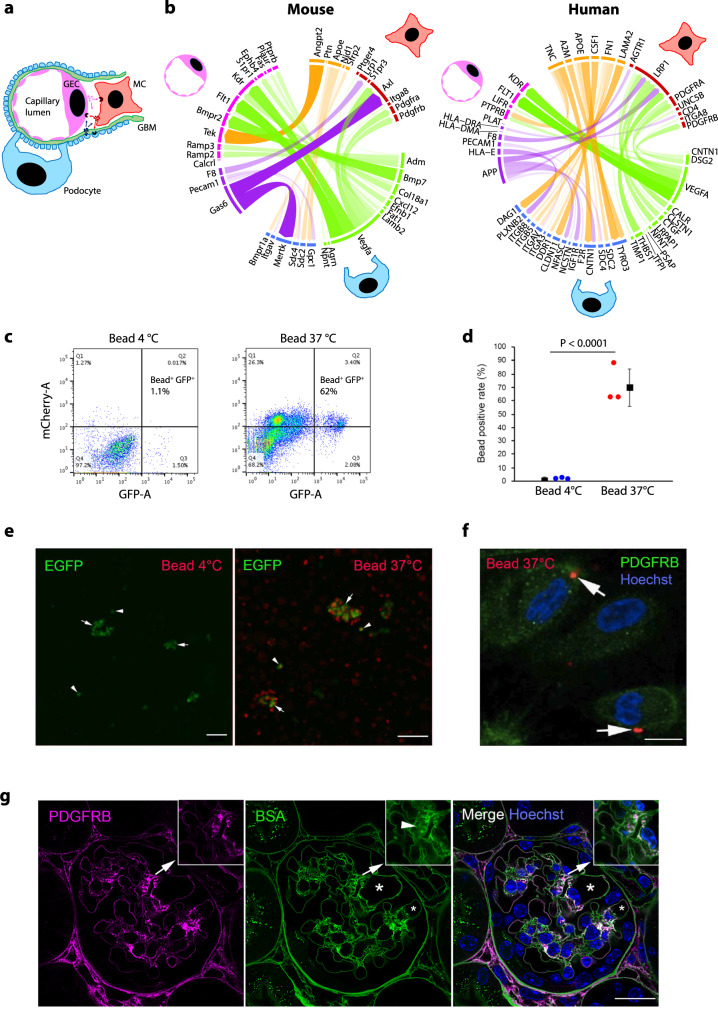
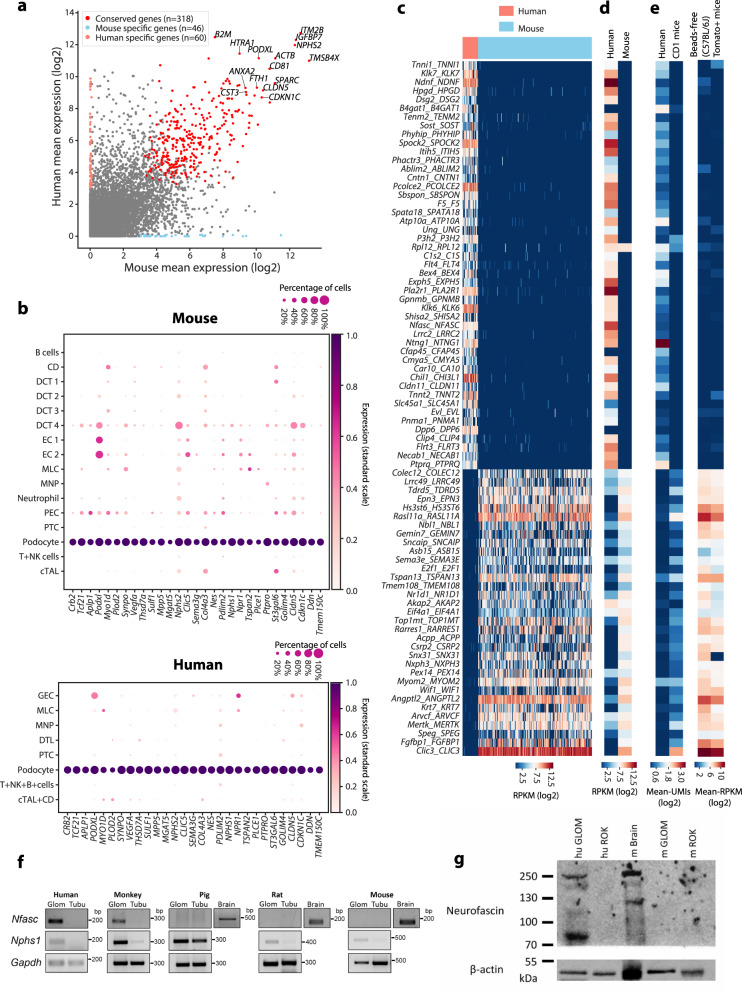
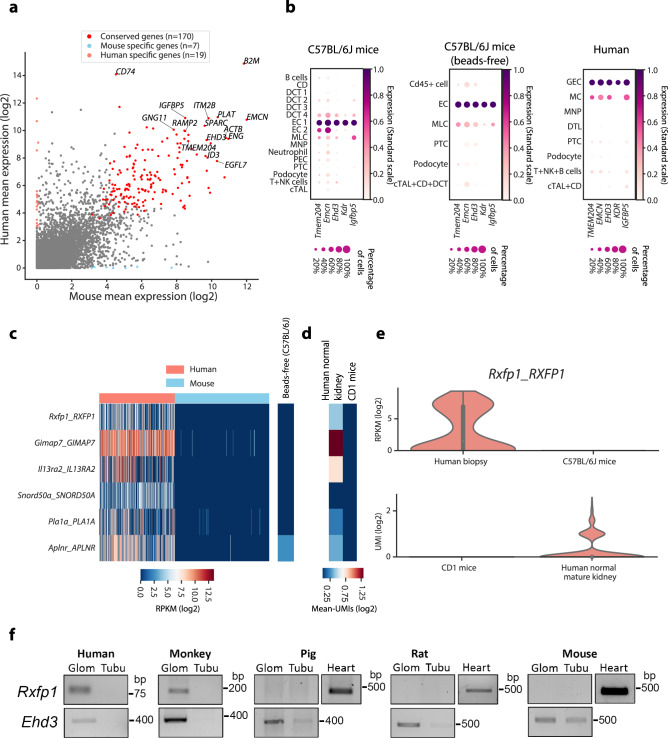
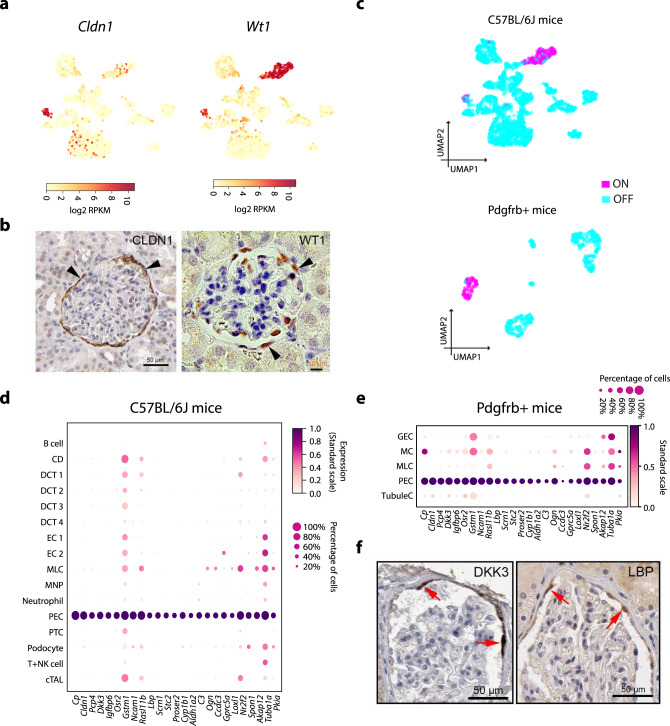
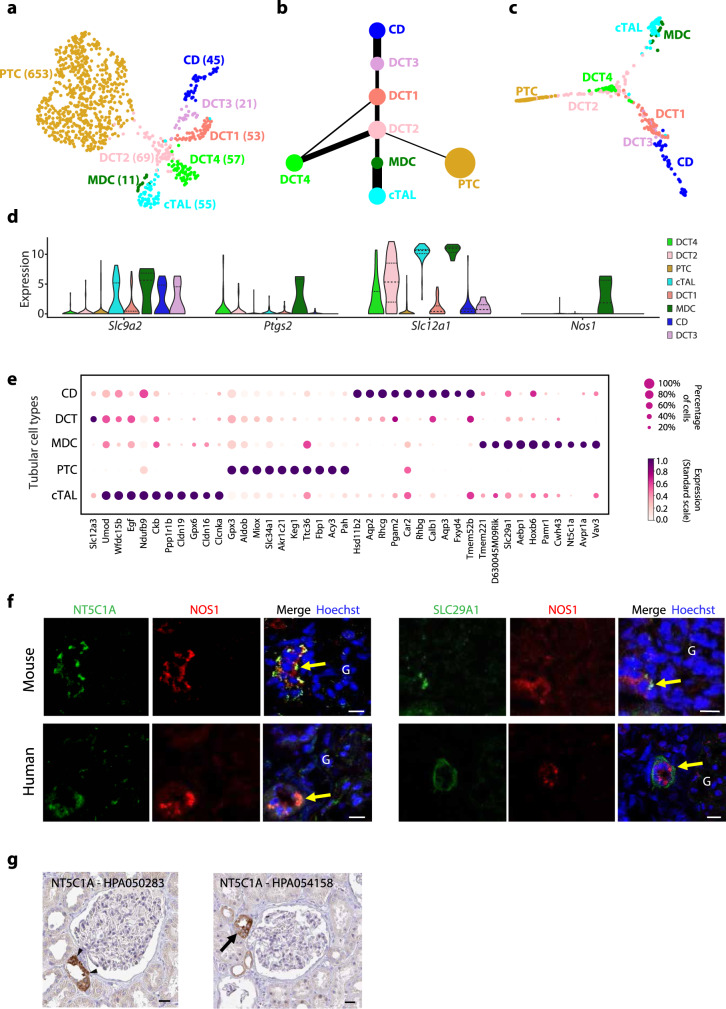
Molecular characterization of the individual cell types in human kidney as well as model organisms are critical in defining organ function and understanding translational aspects of biomedical research. Previous studies have uncovered gene expression profiles of several kidney glomerular cell types, however, important cells, including mesangial (MCs) and glomerular parietal epithelial cells (PECs), are missing or incompletely described, and a systematic comparison between mouse and human kidney is lacking. To this end, we use Smart-seq2 to profile 4332 individual glomerulus-associated cells isolated from human living donor renal biopsies and mouse kidney. The analysis reveals genetic programs for all four glomerular cell types (podocytes, glomerular endothelial cells, MCs and PECs) as well as rare glomerulus-associated macula densa cells. Importantly, we detect heterogeneity in glomerulus-associated Pdgfrb-expressing cells, including bona fide intraglomerular MCs with the functionally active phagocytic molecular machinery, as well as a unique mural cell type located in the central stalk region of the glomerulus tuft. Furthermore, we observe remarkable species differences in the individual gene expression profiles of defined glomerular cell types that highlight translational challenges in the field and provide a guide to design translational studies.


Conflict of interest statement

AstraZeneca is financially supporting C.B., R.S. and J.P. laboratories, M.L. is an employee of AstraZeneca, C.B. is a consultant for AstraZeneca. The remaining authors declare no competing interests.

Figures

Fig. 1
Fig. 1. scRNA-seq analysis of isolated mouse and human glomerulus-associated cells.
a Summarized study design and experimental procedure. b Projection of mouse and human single cells onto 2-D UMAP space coloured by assigned cell types. Cell numbers in each population are shown in parenthesis. c The expression of known cell type marker genes in mouse and human principal glomerular cells. The markers include Nphs1/NPHS1 for podocytes, Pdgfrb/PDGFRB for mesangial-like cells (MLCs) and Pecam1/PECAM1 for ECs. The colour intensity of dots represents the expression level. The colour scale is defined by log2(mean RPKM). d Mouse and human podocyte, glomerular EC, and MLC enriched active regulons constructed by SCENIC. Regulons active in >50% of cells in one cell type but not in other two cell types were considered as cell-type enriched regulons. Binary activity scores are shown in the heatmap with black indicating ‘ON/active’ and white indicating ‘OFF/inactive’. CD collecting duct, DCT distal convoluted tubule, PTC proximal tubule cell, EC endothelial cell, MLC mesangial-like cell, MNP mononuclear phagocyte, PEC glomerular parietal epithelial cell, cTAL cortical thick ascending limb; colour dots indicate diverse cell types.
Fig. 2
Fig. 2. The heterogeneity of mousePdgfrb-expressing MLCs.
a Trajectory of all mouse Pdgfrb-expressing MLCs by UMAP (left) and partition-based graph abstraction (right). MLCs were classified into four subclusters (MLC-C1–C4). Batch effect correction was performed as the cells were generated from two independent experimental batches using unbiased and CD45 CD31 sorting. In the PAGA graph, each node represents one MLC subcluster and the edge weights quantify the neighbourhood relation. The node size indicates the number of cells in each subcluster. EMC extraglomerular cell, vSMC vascular smooth muscle cell, MC mesangial cell. b The expression (log2-transformed RPKM) of classical marker genes for vSMCs (Cnn1, Acta2), renin cells (Ren1), pericytes (Pdgfrb), fibroblasts (Pdgfra) and Gata3 visualized in UMAP. The colour scale is defined by log2(mean RPKM). c The mesangial localization of PDGFRA in the mouse glomerulus. The staining for desmin (red) localizes to PDGFRA-positive cells (green, arrowheads) in glomeruli in the Pdgfra-H2BGFP reporter mouse line. Desmin-positive vSMCs (arrow) outside glomeruli show no GFP signal for PDGFRA. White discontinuous circles indicate glomeruli. Scale bar: 20 µm. d Triple labelling for PDGFRB, Calponin-1 and aSMA in the mouse kidney. Calponin-1 (green) is detected only in afferent/efferent arteriolar SMCs (white arrow), whereas aSMA (red) is detected in both vSMCs and PDGFRB (white)-positive cells located in the central stalk of the glomerulus (white arrowheads). PDGFRB is also positive in intraglomerular MCs (red arrows). Scale bar: 5 µm. e Triple labelling for PDGFRB, aSMA and GATA3 in the mouse kidney. Nuclear location of GATA3 (green) is detected in PDGFRB (white)-positive intraglomerular MCs (arrowheads), but not in double aSMA (red) and PDGFRB (white)-positive cells (arrows) located in the central stalk of the glomerulus. Scale bar: 10 µm. f Heatmap showing the top 15 genes significantly upregulated in each MLC subcluster. The genes were selected based on the magnitude of expression range among four MLC subclusters. A full list of differentially expressed genes is presented in Supplementary Data 4. g Radar visualization of the probabilistic similarity of mouse and human MLCs in relation to defined pericytes, vSMCs, fibroblasts and various EC subpopulations from mouse lung. h The boxplot showing the probabilistic similarity of MLCs (y-axis) to reference cell types (x-axis) binned by MLC subclusters. The estimation was done on n = 339 mouse and n = 58 human MLCs over n = 1209 reference cells from mouse lung. The box plot illustrates the first quartile, median and the third quartile with whiskers of maximum 1.5 IQR (the interquartile range). i The activity of mouse lung pericyte, vFBC and vSMC active regulons (n = 57) in mouse and human glomerular MCs. Binary activity scores are shown in the heatmap with black indicating ‘ON/active’ and white indicating ‘OFF/inactive’. Regulators active in MCs from two mouse strains and/or in human MCs are highlighted with colour matching to mouse lung cell types.
Fig. 3
Fig. 3. Crosstalk between principal glomerular cell types and phagocytic activity in mesangial cells.
a Schematic relation of three principal glomerular cell types (MCs, GECs and podocytes). MC mesangial cell, GEC glomerular endothelial cell. b Chord diagrams showing ligand–receptor interactions between MCs, GECs and podocytes identified in mouse and human scRNA-seq datasets. Colours correspond to cell types and ligand/receptor categories, MCs (ligands: orange, receptors: dark red), GECs (ligands: purple, receptors: hot pink) and podocytes (ligands: lime, receptors: blue). The thickness and opacity of the arcs are proportional to the weights of ligand–receptor interactions as used in the NicheNet model. c Ex vivo phagocytosis by mouse glomerular cells. FACS scatter plots show gating of viable glomerular bead+ GFP+ cells isolated from Pdgfrb-EGFP mice. Conjugated pH-sensitive fluorescence is detectable in phagocytosed cells by the mCherry channel. Baseline was determined by incubating cells with beads at 4 °C (left). Notably, 62% of glomerular GFP+ cells are bead+ (phagocytic) when incubated with beads at 37 °C (right). Original flow cytometry plots and gating raw data for all three independent assays are available in the Source data file. d Dot plot showing percentage of bead+ cells in two groups. Percentages (%) of bead-positive cells in triplicate independent assays in 4 °C- and 37 °C-treated groups are presented as dots. Each assay included at least two mice. Error bars are defined as mean values and SD. The two-sided P value of 6.5 × 10−71 was calculated using the proportion test. e Visualization of phagocytosis by EGFP+ cells. In the left image, at 4 °C, fluorescent signal (red) of beads is not detectable. Arrows and arrowheads indicate partially digested glomerular EGFP+ MCs and EGFP+ single cells, respectively. In the right image, at 37 °C, partially digested glomerular EGFP+ MCs co-localize with fluorescent beads (arrows). Bead+ EGFP+ single cells are also visible (arrowheads). Scale bars: 50 µm. f In vitro phagocytosis by human glomerular PDGFRB+ cells. Fluorescent beads (arrows) are detected inside cultured PDGFRB+ (green) human glomerular cells. Hoechst-stained cellular nuclei. Scale bar: 100 µm. g Super-resolution STED microscopy analysis of mouse mesangial accumulation of injected FITC-BSA in vivo. Immunostaining of PDGFRB labelling MCs (violet) and FITC signal of BSA (green) in the mouse glomerulus 1 h after intravenous injection of FITC-BSA. Zoomed mesangium (insets) is indicated by arrows. FITC accumulation is indicated by arrowhead in inset. Glomerular capillary lumens are marked with *. Scale bar: 100 µm. Source data.
Fig. 4
Fig. 4. Differential and conserved gene expression profile of MCs between mouse and human.
a The expression (mean log2-transformed RPKM) of mouse and human gene homologues in MCs. Human- (n = 40) and mouse-specific (n = 70) genes are indicated in salmon and light blue, respectively. Conserved genes highly expressed in both species (n = 243) are indicated in red. Detailed information can be found in Supplementary Data 8. b The expression of conserved MC overexpressing genes in single-cell data generated from C57BL/6J mice with viable CD45 CD31 cell sorting (left), Pdgfrb-EGFP mice (middle) and human donor biopsies (right). The colour intensity and size of each dot represents the mean expression (standard scale) and the percentage of cells expressing each gene in individual cell types, respectively. c Heatmap showing the expression of differentially expressed genes in MCs between mouse and human. The colour scale is defined by log2(mean RPKM). d Validation of mouse-specific desmin expression in MCs. Immunofluorescence staining for desmin (red) shows abundant expression in the mouse glomerulus (arrowheads). Expression of desmin is undetectable in human glomeruli (www.proteinatlas.org, https://creativecommons.org/licenses/by-sa/3.0/), but strong signal in vSMCs (arrowheads) is detected as a positive control. Scale bars are indicated in images. e Validation of human-specific COL6A1 expression in MCs. COL6A1 (red) is detected in human MCs (arrowheads), whereas in mouse no significant reactivity in glomeruli is observed. PDGFRB (green) labels MCs in the glomerulus. Abundant extraglomerular interstitial reactivity for COL6A1 (arrowheads) serves as a positive control in mouse. Discontinuous circles indicate glomeruli. Scale bars: 15 µm for mouse and 35 µm for human.
Fig. 5
Fig. 5. Differential and conserved podocyte gene expression profile between mouse and human.
a The expression (mean log2-transformed RPKM) of mouse and human gene homologues in podocytes. Human- (n = 60) and mouse-specific (n = 46) genes are indicated in salmon and light blue, respectively. Conserved genes highly expressed in both species (n = 318) are indicated in red. Detailed information can be found in Supplementary Data 9. b The expression of conserved podocyte highly expressing genes in identified cell types in mouse (C57BL/6J) (upper panel) and human (lower panel). The colour intensity and size of each dot represents the mean expression (standard scale) and the percentage of cells expressing each gene in individual cell types, respectively. c Heatmap showing the levels of differentially expressed genes in podocytes between mouse and human. The colour scale is defined by log2(mean RPKM). d In silico validation of podocyte species-specific genes using published bulk podocyte RNA-seq data from mouse and human. The expression levels are shown as log2-transformed RPKM. e In silico validation of podocyte species-specific genes using published (left) and in-house (right) scRNA-seq data of annotated human and mouse podocytes. Expression levels are shown as log2-scale average UMI counts (published data) and as log2-scale average RPKM (in-house data). f Experimental validation for the gene expression of human-specific gene NFASC. RT-PCR was used to detect the expression of Nfasc in kidney fractions (glom: glomerulus, tubu: tubule) isolated from human, cynomolgus monkey, minipig, rat and mouse. Nphs1 and Gapdh were used as loading controls. cDNA generated from the brain tissue served as an experimental positive control. The molecular-weight size of PCR amplicons is indicated in the right side as bp. g Western blot analysis of NFASC in mouse and human glomeruli. Lysates of human and mouse glomeruli (hu GLOM, m GLOM) and tubules (hu ROK, m ROK, glomerulus-free or rest of kidney) were used. As a positive control, the mouse brain lysate (m Brain) was used. β-actin was used as a loading control. Protein molecular mass (kDa) is shown on the left side of the blot image. Of note, the blots for NFACS and β-actin were derived from the same Western blot, but were treated separately for the exposure processes due to notably weaker signal for NFASC than β-actin. The original raw data for blots and PCR gel images are available in the Source data file. Source data
Fig. 6
Fig. 6. Differential and conserved glomerular endothelial cell gene expression profile between mouse and human.
a The expression (mean log2-transformed RPKM) of mouse and human gene homologues in GECs. Human- (n = 19) and mouse-specific (n = 7) genes are indicated in salmon and light blue, respectively. Conserved genes highly expressed in both species (n = 170) are indicated in red. Detailed information is found in Supplementary Data 10. b The expression of conserved GEC highly expressing genes in identified cell types in data generated from C57BL/6J mice (left panel), C57BL/6J mice where glomeruli were isolated using a bead-free glomerulus isolation method (middle) and human donor biopsies (right panel). The colour intensity and size of each dot represents the mean expression (standard scale) and the percentage of cells expressing each gene in individual cell types, respectively. c Heatmap showing the expression of differentially expressed genes in GECs between mouse and human. Only six human-specific genes and no mouse-specific genes were detected in GECs (left). These human-specific genes were not expressed or expressed at very low level in our in-house C57BL/6J mice data generated using the bead-free isolation method (right). The colour scale is defined by log2(mean RPKM). d In silico validation of GEC species-specific genes using published scRNA-seq data. Expression levels are shown as log2-scale average UMI counts. e Violin plots showing the expression of RXFP1 in GECs of human (n = 241 cells) and mouse (n = 305 cells) from this study and in GECs from two independent data (n = 1556 mouse cells and n = 731 human cells). The miniature box plot in the violin plot illustrates the first quartile, median and the third quartile with whiskers of maximum 1.5 IQR (the interquartile range). f Experimental validation for the gene expression of human-specific gene RXFP1. RT-PCR was used to detect expression of Rxfp1 in kidney fractions (glom: glomerulus, tubu: tubule) isolated from human, cynomolgus monkey, minipig, rat and mouse. Ehd3 was used as loading controls. cDNA generated from heart tissues served as an experimental positive control. The molecular-weight size of PCR amplicons is indicated in the right side as bp. The original PCR gel images are available in the Source data file. Source data
Fig. 7
Fig. 7. Identification of mouse glomerular parietal epithelial cells (PECs).
a The expression of Cldn1 and Wt1 in the mouse glomerulus. Wt1 is abundantly expressed in mouse Nphs1-expressing podocytes and the Cldn1-expressing cluster. The colour scale is defined by log2(mean RPKM). b Immunohistochemistry confirms the localization of human CLDN1 and mouse WT1 in PECs on Bowman’s capsule (arrowheads). The CLDN1 image is downloaded from www.proteinatlas.org (https://creativecommons.org/licenses/by-sa/3.0/). c UMAP showing the Wt1 regulon activity in single cells of C57BL/6J mice (upper) and Pdgfrb+ mice (bottom). d The expression of 25 genes significantly overexpressed in PECs compared to all other identified cell types from C57BL/6J mice. The colour intensity and size of each dot represent the mean expression (standard scale) and the percentage of cells expressing each gene (x-axis) in individual cell types (y-axis), respectively. e Validation of the 25 PEC signatures in an independent data from Pdgfrb-EGFP mice. f Immunohistochemical staining of DKK3 and LBP in human Bowman’s capsule. Staining for DKK3 and LBP in PECs are indicated (red arrows). The images are downloaded from www.proteinatlas.org (https://creativecommons.org/licenses/by-sa/3.0/). Scale bars: 50 µm.
Fig. 8
Fig. 8. Identification of macula densa cells from captured mouse tubular cells.
a UMAP of captured tubular cells from C57BL/6J mice coloured by cell types and DCT subclusters. CD collecting duct, DCT distal convoluted tubule, PTC proximal tubule cell, MDC macula densa cell, cTAL cortical thick ascending limb. Colour dots indicate diverse subsets. b PAGA graph of cell type topological relations. c Two-dimensional diffusion map trajectory of tubular cells. d The expression (log2-transformed RPKM) of classical MDC markers in tubular cell populations. Colours represent tubular corresponding subsets described in a. e The expression of top 10 genes significantly overexpressed in each identified tubular cell subpopulation. f Double immunofluorescence staining for NT5C1A (green) and SLC29A1 (green) with NOS1 (red) in mouse (left) and human kidney tissues (right). Both proteins NT5C1A and SLC29A1 localize to the same subpopulation of NOS1-positive tubular cells (yellow arrows) next to the glomerulus (G). g Immunostaining for NT5C1A using two different antibodies (HPA HPA050283—left and HPA054158—right) show strong reactivity in a small subpopulation of tubular cells next to the root of the glomerular tuft (arrowheads or arrow). The images are downloaded from www.proteinatlas.org (https://creativecommons.org/licenses/by-sa/3.0/). Scale bars (f, g): 30 µm.

Similar articles

Cited by

References

    1. Scott RP, Quaggin SE. Review series: the cell biology of renal filtration. J. Cell Biol. 2015;209:199–210. doi: 10.1083/jcb.201410017. - DOI - PMC - PubMed
    1. Schlondorff D, Banas B. The mesangial cell revisited: no cell is an island. J. Am. Soc. Nephrol. 2009;20:1179–1187. doi: 10.1681/ASN.2008050549. - DOI - PubMed
    1. Shankland SJ, Smeets B, Pippin JW, Moeller MJ. The emergence of the glomerular parietal epithelial cell. Nat. Rev. Nephrol. 2014;10:158–173. doi: 10.1038/nrneph.2014.1. - DOI - PubMed
    1. Park J, et al. Single-cell transcriptomics of the mouse kidney reveals potential cellular targets of kidney disease. Science. 2018;360:758–763. doi: 10.1126/science.aar2131. - DOI - PMC - PubMed
    1. Karaiskos N, et al. A single-cell transcriptome atlas of the mouse glomerulus. J. Am. Soc. Nephrol. 2018;29:2060–2068. doi: 10.1681/ASN.2018030238. - DOI - PMC - PubMed

Publication types

Substances