. 2021 Apr 9;4(1):451.
doi: 10.1038/s42003-021-01979-5.

Multinucleation associated DNA damage blocks proliferation in p53-compromised cells

Affiliations

Multinucleation associated DNA damage blocks proliferation in p53-compromised cells

Madeleine Hart et al. Commun Biol. .

Abstract

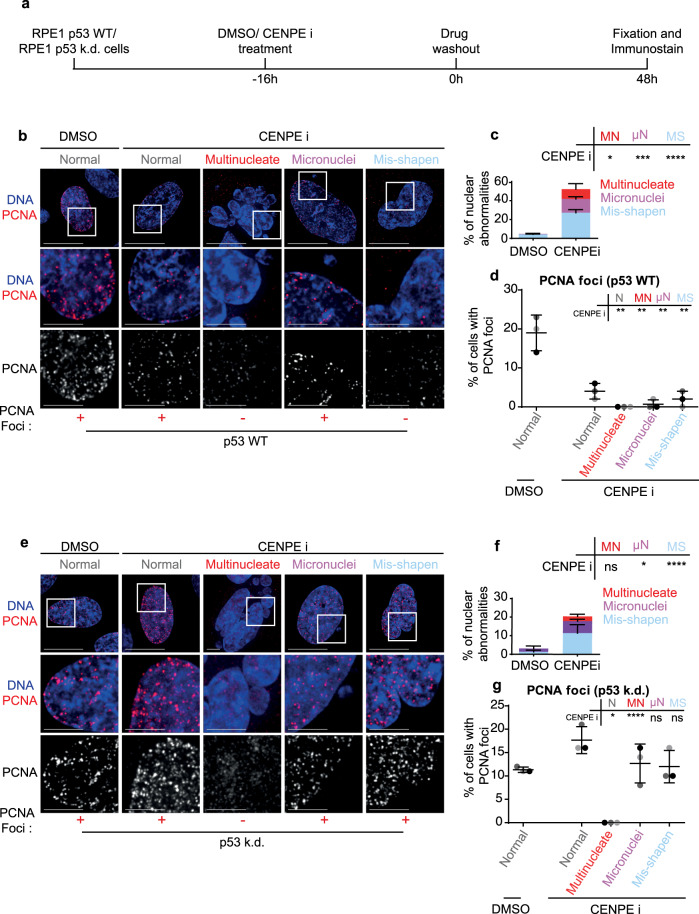
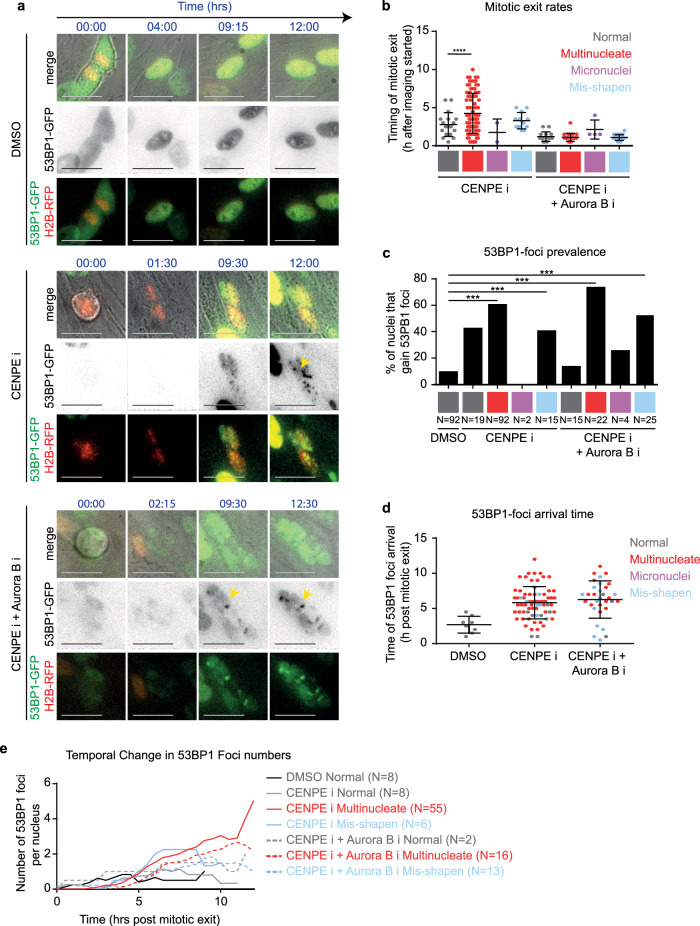
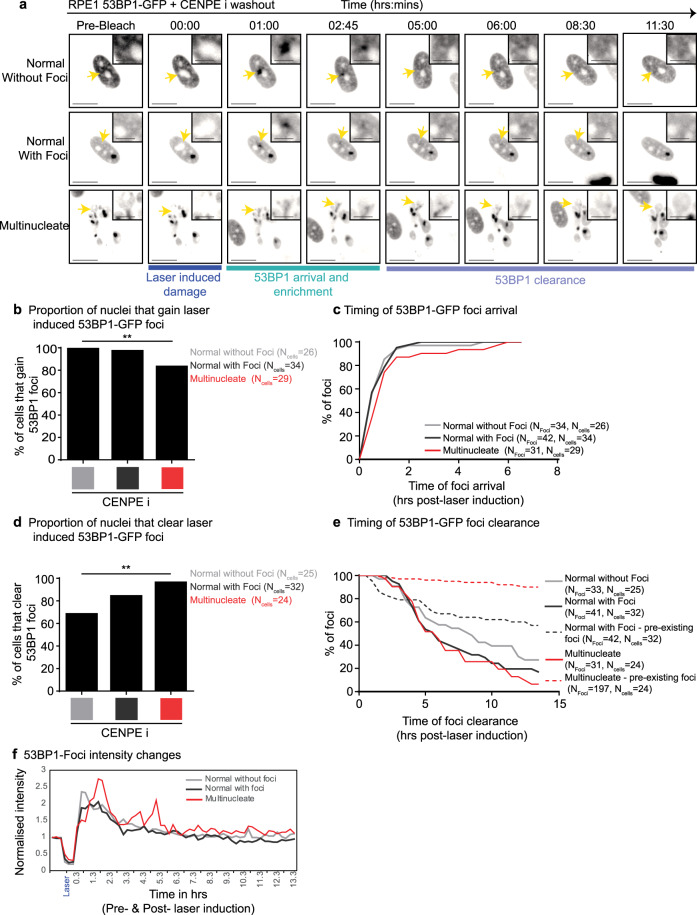
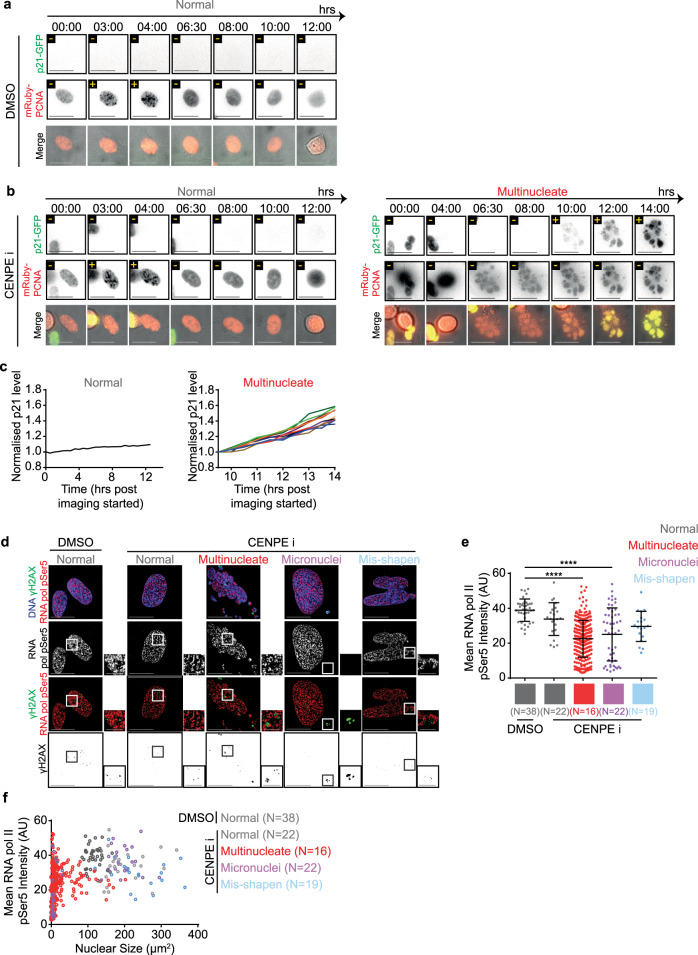
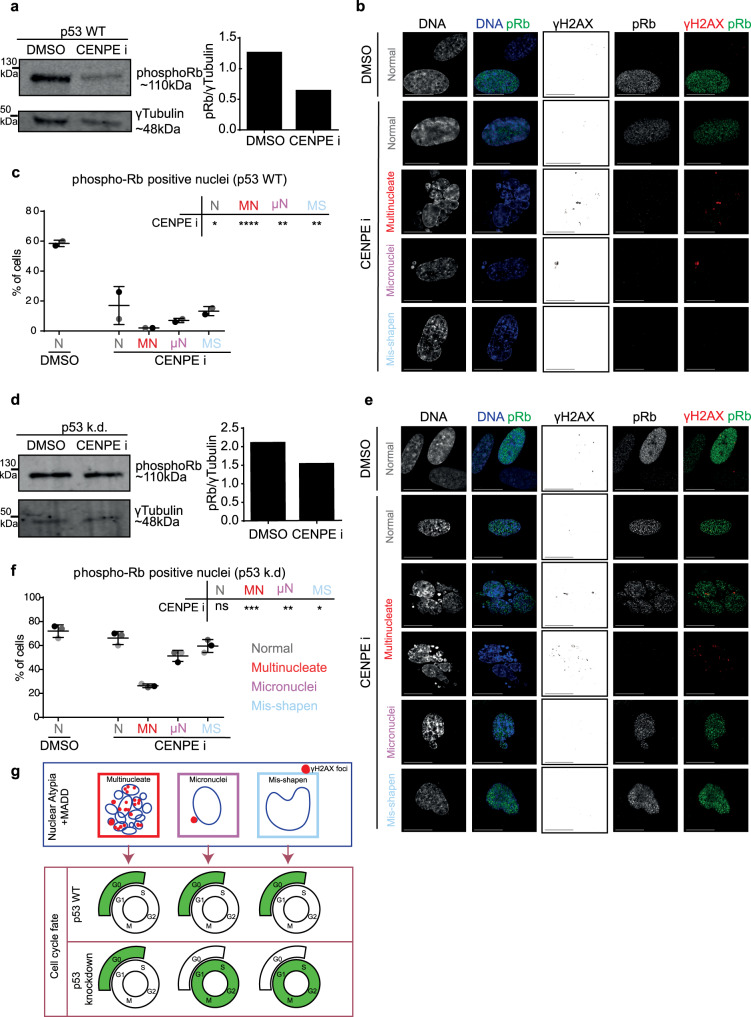
Nuclear atypia is one of the hallmarks of cancers. Here, we perform single-cell tracking studies to determine the immediate and long-term impact of nuclear atypia. Tracking the fate of newborn cells exhibiting nuclear atypia shows that multinucleation, unlike other forms of nuclear atypia, blocks proliferation in p53-compromised cells. Because ~50% of cancers display compromised p53, we explored how multinucleation blocks proliferation. Multinucleation increases 53BP1-decorated nuclear bodies (DNA damage repair platforms), along with a heterogeneous reduction in transcription and protein accumulation across the multi-nucleated compartments. Multinucleation Associated DNA Damage associated with 53BP1-bodies remains unresolved for days, despite an intact NHEJ machinery that repairs laser-induced DNA damage within minutes. Persistent DNA damage, a DNA replication block, and reduced phospho-Rb, reveal a novel replication stress independent cell cycle arrest caused by mitotic lesions. These findings call for segregating protective and prohibitive nuclear atypia to inform therapeutic approaches aimed at limiting tumour heterogeneity.


Conflict of interest statement

The authors declare no competing interests.

Figures

Fig. 1
Fig. 1. Unlike other nuclear atypia, multinucleation induces a G1 arrest, independent of p53.
a Experimental regime; RPE1 p53 wild type (WT) or RPE1 p53 knockdown (k.d.) were treated with DMSO or CENPE inhibitor for 16 h, then washed out. 48 h later cells were assessed for PCNA and nuclear status. Images of RPE1 p53 WT (b) or p53 k.d (e) cells treated as in a. Scale 15 μm, insets 5 μm. ± refers to PCNA foci positive or negative nuclei displayed. In Fig. 1b, a micronuclei bearing cell displaying PCNA-foci has been chosen, although the majority lack PCNA-foci. Quantification of nuclear morphology changes after treatment of RPE1 p53 WT (c) or p53 k.d (f) cells with DMSO or CENPE inhibitor, as in (a). Nuclei were classified as either Mis-shapen (MS), Micronucleated (μN) or Multinucleated (MN). N = 600 cells, 3 independent experimental repeats shown as shades of grey. Statistical analysis was using a two-way ANOVA with multiple comparisons and a confidence interval of 95%. d, g Quantification of the percentage of PCNA-foci positive cells, within each nuclear morphology bin, following DMSO or CENPE inhibitor treatment, of RPE1 p53 WT (c) or p53 k.d (f) cells. N > 150, 3 independent experimental repeats shown as shades of grey. Statistical analysis was using multiple unpaired t tests, comparing each morphology after CENPE inhibition to normal nuclei after DMSO treatment.
Fig. 2
Fig. 2. Multinucleate cells exhibit delayed DNA damage signalling and an increase in damage foci through time.
a Representative time-lapse images of normal shaped nuclei exiting mitosis after DMSO treatment, or multinucleated cells exiting mitosis after CENPE i or CENPEi and Aurora Bi treatment as in Supplementary Fig. 5a. Scale 25 μm. Yellow arrows indicate 53BP1-GFP foci within multinucleate cells. In the 53BP1-GFP lane, GFP intensities are inverted to highlight 53BP1-foci as soon as they form (associated supplementary movies present non-inverted GFP intensities). b Graph shows the timing of mitotic exit, based on nuclear morphology of daughter cells (indicated by colour). Statistical significance was assessed using an unpaired student’s t test. **** indicates p < 0.0001. c Graph of the proportion of daughter nuclei which gain 53BP1 foci during time-lapse imaging. N values below bars indicate the number of nuclei from at least three independent experimental repeats. Statistical significance was assessed using a proportions test with 95% confidence interval. *** indicates p < 0.001. d Graph of the timing of 53BP1 foci arrival in nuclei which gain 53BP1 foci, after drug treatments as indicated. Time-lapse movies as in Fig. 2a were used to determine the earliest time-point of visible 53BP1 foci following mitotic exit. Each value represents one nucleus. The colour of plotted values represents nuclear morphology. e Quantification of 53BP1 foci number per nucleus over time from mitotic exit.
Fig. 3
Fig. 3. MADD is not resolved despite intact DDR signalling in multinucleate cells.
RPE1 H2B-RFP 53BP1-GFP cells were treated with CENPEi for 24 h, washed and imaging initiated. One laser induced bleach/damage site in each nucleus was tracked. a Representative pre-bleach, bleach (at 00:00) and post-bleach images of nuclei—either normal nuclei without pre-existing 53BP1 foci, normal nuclei with pre-existing 53BP1 foci or multinucleate nuclei with 53BP1 foci. Yellow arrows indicate sites of bleaching and are highlighted in crops. Scale 15μm; insets 5μm. b Graph shows the proportion of nuclei that gain 53BP1-GFP foci at the site of laser-induced damage, for multinucleate, normal with pre-existing foci and normal nuclei without pre-existing foci. N indicates the number of cells, from across 3 independent repeats. Statistical significance was assessed using a proportions test with a 95% confidence interval. ** indicated p < 0.05. c Graph shows timing, post-bleach, of 53BP1-GFP foci arrival at the laser bleach site. d Quantification of the proportion of nuclei that cleared laser-induced 53BP1-GFP foci, for normal and multinucleate cells. Statistics was assessed using a proportions test with a 95% confidence interval. ** indicates p < 0.05. e Graph shows the timing of 53BP1-GFP foci clearance after bleach time, for foci induced at the bleach site (solid lines) and foci existing prior to laser bleach (dashed lines). N indicates the number of foci and cells analysed. f Graph shows changes in 53BP1-GFP foci intensity at laser-induced damage site in cells shown in Fig. 3a. 53BP1-GFP intensities were normalised using pre-laser damage intensity values.
Fig. 4
Fig. 4. Multinucleation favours heterogeneous nuclear protein levels.
Representative images of RPE1 mRuby-PCNA p21-GFP cells treated with DMSO (a) or CENPEi (b) for 16 h and washed 10 h prior to live-cell imaging for 14 h. Scale bar 25 μm. Yellow ± refers to p21 or PCNA foci positive or negative respectively. Images show a normal shaped nucleus with low p21 and nuclear PCNA foci and a multinucleate cell, exiting mitosis and building p21-GFP levels through time, without gaining nuclear PCNA foci. c Graph of the mean p21 level per nucleus for the normal, or per compartment for multinucleated cells from movies as in Fig. 4a & b. Values are normalised to the mean p21 value from the first time point measured. PCNA signal was used to identify nuclear areas. Colours of lines correspond to different nuclear compartments. d RPE1 cells treated with DMSO or CENPEi for 16 h were fixed 48 h later for immunostaining with antibodies against gamma H2AX and RNA pol II CTD pSer5. DNA was stained with DAPI. Representative images of non-overlap between gamma H2AX and RNA pol II pSer5 in cells following DMSO (control) or CENPEi treatment. Scale 15 μm; insets 5 μm. e Graph of the mean RNA pol II CTD pSer5 intensity per nucleus (normal or misshapen nuclei) or nuclear compartment (micronucleated and multinucleate). Each plot represents one nucleus/nuclear compartment respectively. N refers to the number of cells analysed, across 3 independent repeats. Statistical significance was assessed using a one way ANOVA with multiple comparisons. f Mean RNA pol II CTD pSer5 intensity per nucleus/nuclear compartments plotted against the size of the nucleus/nuclear compartment. Line colours represent nuclear morphology as indicated. N refers to the number of cells from 3 independent repeats.
Fig. 5
Fig. 5. Multinucleated cells uniquely display reduced phospho-Rb despite compromised p53.
RPE1 p53 WT (ac) or RPE1 H2B-GFP p53 k.d. df cells were treated with DMSO or CENPEi for 16 h and 48 h later cells were immunostained with antibodies against pRb and gamma H2AX, or cells were lysed for immunoblot. a & d Immunoblot shows pRb or gamma-tubulin levels in RPE1 p53 WT (a) or p53 kd (d) cells following DMSO or CENPEi treatment, as indicated. Note the gamma-tubulin is the same as displayed in Supplementary Fig. 1. Right panel shows a graph of pRb fluorescent intensity, normalised to gamma-tubulin. Representative images of nuclear atypia following CENPEi treatment of RPE1 p53 WT (b) or p53 kd (e) cells. Scale 15 μm. Graph of proportion of pRb positive or negative RPE1 WT (c) or p53 kd (f) cells, after DMSO or CENPEi treatment. N > 100 for WT or >150 for p53 k.d cells from 2 or 3 independent repeats (shown as shades of grey), respectively. Statistical analysis using multiple unpaired t-tests, comparing each morphology after CENPEi treatment to normal nuclei after DMSO. g Model comparing nuclear atypia shows large-scale DNA damage in multinucleate cells, but not in misshapen nuclei, and in micronucleated cells, gamma H2AX foci are majority confined to the micronucleus. Nuclear atypia causes G0 arrest in p53 WT. In p53 k.d. conditions, only multinucleate cells are G0 arrested.

Similar articles

Cited by

References

    1. Kadota K, et al. A nuclear grading system is a strong predictor of survival in epitheloid diffuse malignant pleural mesothelioma. Mod. Pathol. 2012;25:260–271. doi: 10.1038/modpathol.2011.146. - DOI - PMC - PubMed
    1. Kadota K, et al. A grading system combining architectural features and mitotic count predicts recurrence in stage I lung adenocarcinoma. Mod. Pathol. 2012;25:1117–1127. doi: 10.1038/modpathol.2012.58. - DOI - PMC - PubMed
    1. Hatch EM, Fischer AH, Deerinck TJ, Hetzer MW. Catastrophic nuclear envelope collapse in cancer cell micronuclei. Cell. 2013;154:47–60. doi: 10.1016/j.cell.2013.06.007. - DOI - PMC - PubMed
    1. Crasta K, et al. DNA breaks and chromosome pulverization from errors in mitosis. Nature. 2012;482:53–58. doi: 10.1038/nature10802. - DOI - PMC - PubMed
    1. Zhang C-Z, et al. Chromothripsis from DNA damage in micronuclei. Nature. 2015;522:179–184. doi: 10.1038/nature14493. - DOI - PMC - PubMed

Publication types

Substances