. 2021 Apr 9;11(1):7838.
doi: 10.1038/s41598-021-87476-5.

Conditional RAC1 knockout in motor neurons restores H-reflex rate-dependent depression after spinal cord injury

Affiliations

Conditional RAC1 knockout in motor neurons restores H-reflex rate-dependent depression after spinal cord injury

Curtis A Benson et al. Sci Rep. .

Abstract

A major complication with spinal cord injury (SCI) is the development of spasticity, a clinical symptom of hyperexcitability within the spinal H-reflex pathway. We have previously demonstrated a common structural motif of dendritic spine dysgenesis associated with hyperexcitability disorders after injury or disease insults to the CNS. Here, we used an adeno-associated viral (AAV)-mediated Cre-Lox system to knockout Rac1 protein expression in motor neurons after SCI. Three weeks after AAV9-Cre delivery into the soleus/gastrocnemius of Rac1-"floxed" adult mice to retrogradely infect spinal alpha-motor neurons, we observed significant restoration of RDD and reduced H-reflex excitability in SCI animals. Additionally, viral-mediated Rac1 knockdown reduced presence of dendritic spine dysgenesis on motor neurons. In control SCI animals without Rac1 knockout, we continued to observe abnormal dendritic spine morphology associated with hyperexcitability disorder, including an increase in mature, mushroom dendritic spines, and an increase in overall spine length and spine head size. Taken together, our results demonstrate that viral-mediated disruption of Rac1 expression in ventral horn motor neurons can mitigate dendritic spine morphological correlates of neuronal hyperexcitability, and reverse hyperreflexia associated with spasticity after SCI. Finally, our findings provide evidence of a putative mechanistic relationship between motor neuron dendritic spine dysgenesis and SCI-induced spasticity.


Conflict of interest statement

The authors declare no competing interests.

Figures

Figure 1
Figure 1
Study design. All animals underwent baseline behavioral testing and were randomly assigned to either SCI or sham groups. Spinal reflex excitability (EMG) and locomotor behavior was tested one-week post SCI or Sham prior to intramuscular injection of AAV9CMVCre into the left hindlimb soleus and gastrocnemius muscles. To assess the effect of conditional Rac1 KO (SCI Rac1−/−), locomotor behavior and spinal reflex testing was conducted after AAV9CMVCre injection at four weeks post-SCI. After completion of EMG and behavioral testing, tissue samples were collected for histology and dendritic spine analysis.
Figure 2
Figure 2
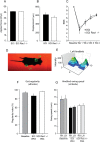
AAV9CMVCre mediated Rac1 KO does not impair recovery after SCI. (A, B) Biomechanical impact data provided by the Infinite Horizon impactor demonstrates that SCI Rac1−/− and SCI control groups received consistent injuries. (C) Blinded observers performed BMS testing at baseline, and weekly following SCI (Wk1-Wk4). Both SCI Rac1−/− and SCI control groups recovery equally over a 4-week period. (D) Representative video-still image of paw prints used for stepping pattern analysis acquired and analysis using the CatWalkXT (Noldus Information Technology). (E) Intensity plot of the left hind paw (virally injected side) acquired using the CatWalkXT (Noldus Information Technology) from an SCI animal four weeks post injury. (F) Four weeks after SCI, both SCI Rac1−/− and SCI control groups have a gait pattern (regularity index) similar to baseline testing. (G) Swing speed of the right (RH) and left (LH) hind limbs of SCI Rac1−/− and SCI group. Post SCI and viral injection there was no difference between hindlimb swing speed and compared to baseline. (* = p < 0.05). Graphs are mean ± SEM.
Figure 3
Figure 3
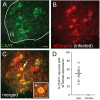
Intramuscular injection of AAV9CMVCre leads to expression of tdTomato in ventral spinal cord motor neurons. (A) ChAT positive motor neurons within lamina IX of the spinal cord. (B) AAV9CMVCre transfected motor neurons expressing tdTomato. (C) Merged image of (A) and (B) shows colocalization of ChAT positive neurons and tdTomato expression (arrow shows inset *). (D) The percentage of ChAT labelled motor neuron expressing tdTomato in the ventral horn of the spinal cord. AAV9CMVCre intramuscular injection tranfects 51.2% of ChAT-positive neurons in lamina IX on the ipsilateral injected side (Ipsi-). On the contralateral side (Contra-) there was no co-labelling between ChAT motor neurons and tdTomato expression. Data shown as scatterplot with mean. Scale bar in (A) = 50 µm and applies to images in (B) and (C).
Figure 4
Figure 4
Conditional Rac1 KO in alpha-motor neurons did not alter microglia or astrocyte reactivity in the ventral horn. (A, B) IBA1 immunolabelling for microglia in the ventral horn of the spinal cord in SCI animals with (A) Rac1 or (B) Rac1 KO in alpha motor neurons. (C) No difference in the percent area labelled for IBA1 between SCI and SCI Rac1−/− groups. (D, E) Image of GFAP immunolabelling for astrocytes in the ventral horn of the spinal cord from animals with (D) Rac1 or (E) Rac1 KO in alpha motor neurons. (F) There was no difference in the percent area labelled for GFAP between SCI and SCI Rac1−/− groups. Graphs are Mean ± SEM; Scale bar in (A) and (D) = 50 µm and applies to images in (B), and (E).
Figure 5
Figure 5
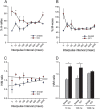
Enhanced H-reflex response 1-week after SCI. To confirm the development of hyperreflexia after SCI, we measured the H-reflex response using a paired-pulse paradigm (stimulating interpulse intervals 5–2000 ms). (A, B) % H-reflex and % M-wave are normalized values of the test pulse compared to the control pulse. (A) In Sham animals, shorter interpulse intervals are associated with less %H-reflex, demonstrating RDD. After SCI there was significant increase in the %H-reflex at 10, 50, 100 and 2000 ms interpulse intervals (* = p < 0.05). (B) There was no significant difference in %M-wave response between Sham and SCI. (C) H/M ratio was calculated by comparing peak amplitude of the test pulse evoked H- and M-wave response. H/M ratio in Sham produced a greater linear regression slope as compared to SCI, e.g., shallow slope. (D) SCI significantly increased the H/M ratio at 10 and 100 ms compared to Sham (* = p < 0.05). Graphs are mean ± SEM.
Figure 6
Figure 6
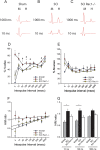
Disruption of Rac1 in alpha-motor neurons attenuates hyperreflexia after SCI. Representative test pulse traces of stim evoked H- and M-wave responses in (A) Sham, (B) SCI, and (C) SCI Rac1−/−. (A) Note that in Sham animals, as the interpulse intervals increases (10–1000 ms) between the test and control pulse, the amplitude of the H-response increase. (B) In contrast, SCI produces an exaggerated H-response at short (10 ms) interpulse intervals. (C) SCI Rac1−/− restores H-response depression at the short (10 ms) interpulse intervals. (D) After SCI there was a significant increase in %H-reflex at 5, 10, 50 and 100 ms interpulse intervals compared to Sham, indicating a loss of RDD (* = p < 0.05). SCI Rac1−/− animals had reduced %H-reflex at 10, 50, 100, 150 and 1000 ms interpulse intervals compared to control SCI animals, suggesting a restoration of RDD (# = p < 0.05). (E) %M-wave was mostly similar across the three groups with small, but significant differences between Sham and SCI at 300 ms interpulse interval (* = p < 0.05) and between Sham and SCI Rac1−/− at 500 ms interpulse interval (§ = p < 0.05). (F) SCI increased H/M ratio as demonstrated as stable linear trend line. Whereas, SCI Rac1−/− animals displayed a closer-to-normal H/M ratio, with a steeper linear trend line. G) SCI increased the H/M ratio at 10 and 100 ms compared to sham, indicating a loss of RDD (* = p < 0.05). Graphs are mean ± SEM.
Figure 7
Figure 7
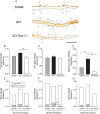
Conditional Rac1 KO in alpha-motor neurons reduces abnormal dendritic spine morphology associated with SCI and hyperreflexia. Analysis of dendritic spine profiles reveals differences in (BD) spine density and (EF) distribution. (A) Reconstructed dendritic segments from tdTomato filled spinal motor neurons showing apparent differences in dendritic spine profile between Sham, SCI and SCI Rac1−/− (arrow denotes spine). (B) Total spine density, which includes all spines, was significantly lower in the SCI Rac1−/− compared to control (* = p < 0.05). (C) There was no difference in the density of thin-shaped spines between groups. (D) SCI induced a significant increase in mushroom spine density compared to Sham (* = p < 0.05). In contrast, SCI Rac1−/− reduced mushroom spine density compared to SCI (* = p < 0.05). (EG) Assessment of dendritic spine density within the (E) proximal (0–40 µm), (F) medial (40–80 µm) and (G) distal (80–120 µm) dendritic branches of tdTomato filled motor neurons. (E, G) Dendritic spine density was not different within the proximal or distal region between Sham, SCI and SCI Rac1−/−. (F) SCI induced an increase in mushroom spine density in the medial region, which was not observed in SCI Rac1−/− animals (# = p < 0.05). Graphs are mean ± SEM. Scale bar in (A) = 10 µm.
Figure 8
Figure 8
Conditional Rac1 KO normalizes dendritic shape on alpha-motor neurons after SCI. Analysis if dendritic spine (AC) length and (DF) spine head width. (A, B) SCI increased the length of total (all spines) and thin-shaped spine compared to Sham (* = p < 0.05). (C) Mushroom-shaped dendritic spines were significantly shorter in SCI Rac1−/− compared to control SCI (* = p < 0.05). (D, E) SCI resulted in a significant increase in spine head width for total and thin-shaped spines, which was not seen in the SCI Rac1−/− group (* = p < 0.05). (F) SCI Rac1−/− decreased the width mushroom-shaped spines compared to control SCI (* = p < 0.05). Graphs are mean ± SEM.

Similar articles

Cited by

References

    1. Skold C, Levi R, Seiger A. Spasticity after traumatic spinal cord injury: nature, severity, and location. Arch. Phys. Med. Rehabil. 1999;80:1548–1557. doi: 10.1016/S0003-9993(99)90329-5. - DOI - PubMed
    1. Walter JS, et al. A database of self-reported secondary medical problems among VA spinal cord injury patients: its role in clinical care and management. J. Rehabil. Res. Dev. 2002;39:53–61. - PubMed
    1. Lance JW. In: Spasticity: Disordered Motor Control. Feldman RG, Yound RR, Koella WP, editors. Year Book Medical; 1980. pp. 485–494.
    1. Bennett DJ, et al. Spasticity in rats with sacral spinal cord injury. J. Neurotrauma. 1999;16:69–84. doi: 10.1089/neu.1999.16.69. - DOI - PubMed
    1. Boulenguez P, Vinay L. Strategies to restore motor functions after spinal cord injury. Curr. Opin. Neurobiol. 2009;19:587–600. doi: 10.1016/j.conb.2009.10.005. - DOI - PubMed

Publication types

MeSH terms