

Gender-specific analysis for the association between trunk muscle mass and spinal pathologies
- PMID: 33837250
- PMCID: PMC8035169
- DOI: 10.1038/s41598-021-87334-4
Gender-specific analysis for the association between trunk muscle mass and spinal pathologies
Abstract
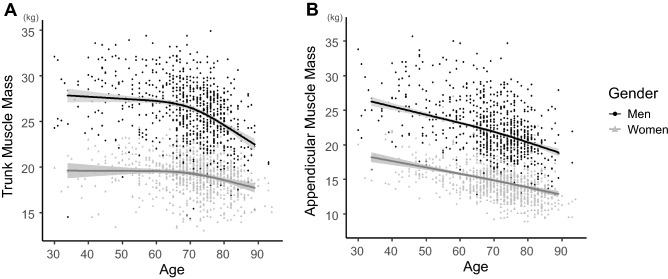
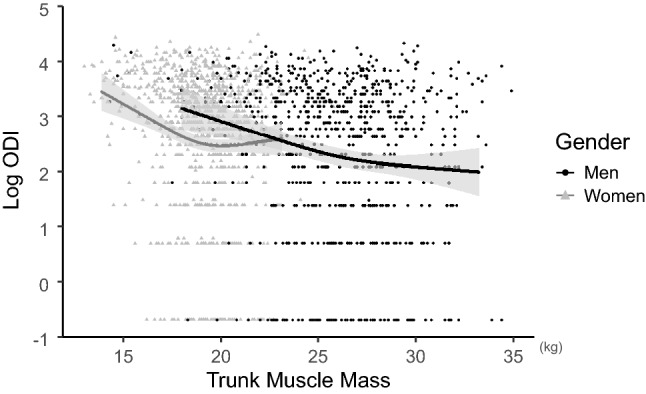
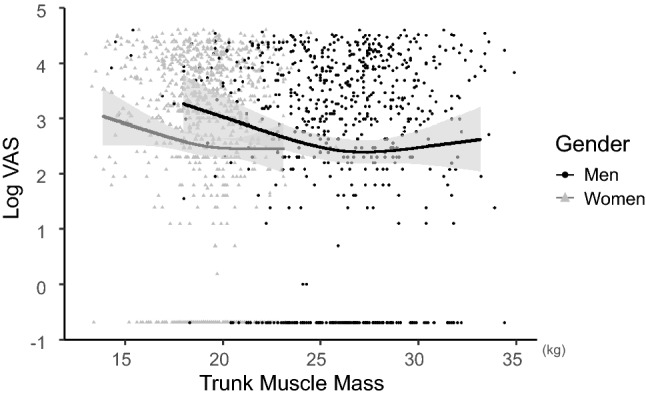
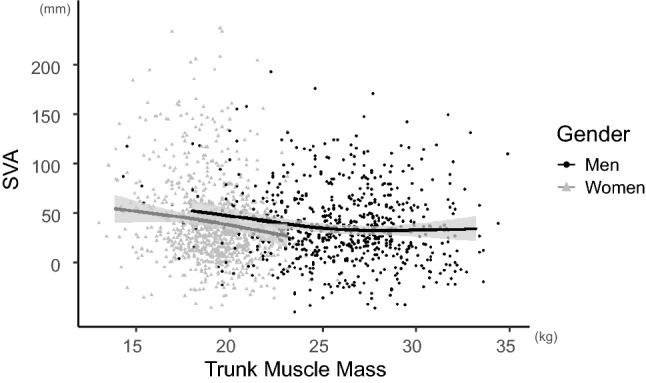
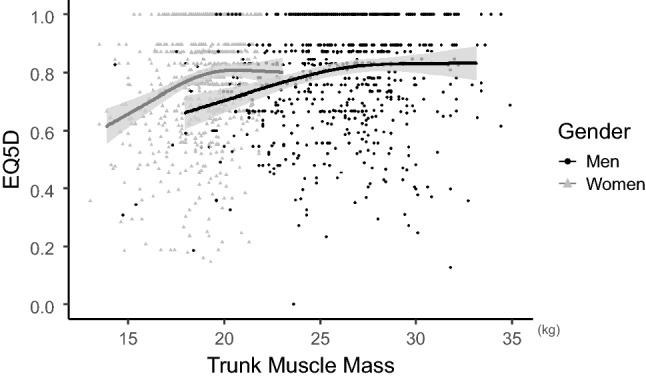
We investigated the relationship between trunk muscle mass and spinal pathologies by gender. This multicenter cross-sectional study included patients aged ≥ 30 years who visited a spinal outpatient clinic. Trunk and appendicular muscle mass were measured using bioelectrical impedance analysis. The Oswestry Disability Index (ODI), visual analog scale (VAS) score for low back pain, sagittal vertical axis (SVA), and EuroQol 5 Dimension (EQ5D) score were investigated to evaluate spinal pathology. The association between trunk muscle mass and these parameters was analyzed by gender using a non-linear regression model adjusted for patients' demographics. We investigated the association between age and trunk muscle mass. We included 781 men and 957 women. Trunk muscle mass differed significantly between men and women, although it decreased with age after age 70 in both genders. Lower trunk muscle mass was significantly associated with ODI, SVA, and EQ5D score deterioration in both genders; its association with VAS was significant only in men. Most parameters deteriorated when trunk muscle mass was < 26 kg in men and < 19 kg in women. Lower trunk muscle mass was associated with lumbar disability, spinal imbalance, and poor quality of life in both genders, with significant difference in muscle mass.
Conflict of interest statement
The authors declare no competing interests.
Figures
Similar articles
-
ISSLS PRIZE IN CLINICAL SCIENCE 2019: clinical importance of trunk muscle mass for low back pain, spinal balance, and quality of life-a multicenter cross-sectional study.Eur Spine J. 2019 May;28(5):914-921. doi: 10.1007/s00586-019-05904-7. Epub 2019 Feb 6. Eur Spine J. 2019. PMID: 30729293
-
Relationship between body mass index and spinal pathology in community-dwelling older adults.Eur Spine J. 2023 Feb;32(2):428-435. doi: 10.1007/s00586-022-07495-2. Epub 2022 Dec 20. Eur Spine J. 2023. PMID: 36538114
-
Associations between sarcopenia and degenerative lumbar scoliosis in older women.Scoliosis Spinal Disord. 2017 Mar 16;12:9. doi: 10.1186/s13013-017-0116-0. eCollection 2017. Scoliosis Spinal Disord. 2017. PMID: 28331906 Free PMC article.
-
Comparative analysis of 3 surgical strategies for adult spinal deformity with mild to moderate sagittal imbalance.J Neurosurg Spine. 2018 Jan;28(1):40-49. doi: 10.3171/2017.5.SPINE161370. Epub 2017 Nov 3. J Neurosurg Spine. 2018. PMID: 29087808
-
The Effectiveness of Hollowing and Bracing Strategies With Lumbar Stabilization Exercise in Older Adult Women With Nonspecific Low Back Pain: A Quasi-Experimental Study on a Community-based Rehabilitation.J Manipulative Physiol Ther. 2018 Jan;41(1):1-9. doi: 10.1016/j.jmpt.2017.06.012. Epub 2017 Dec 16. J Manipulative Physiol Ther. 2018. PMID: 29254626 Review.
Cited by
-
Probabilistic prediction of segmental body composition in Iranian children and adolescents.BMC Pediatr. 2022 Sep 3;22(1):524. doi: 10.1186/s12887-022-03580-z. BMC Pediatr. 2022. PMID: 36057547 Free PMC article.
-
Association between the sarcopenia index and abnormal liver function in the adult population in the United States: a cross-sectional study.Front Med (Lausanne). 2023 Nov 21;10:1266253. doi: 10.3389/fmed.2023.1266253. eCollection 2023. Front Med (Lausanne). 2023. PMID: 38076231 Free PMC article.
-
The Relationship Between Low Back Pain and Sagittal Spinal Alignment and Back Muscle Mass in Korean Fishery Workers.Ann Rehabil Med. 2023 Dec;47(6):459-467. doi: 10.5535/arm.23075. Epub 2023 Nov 22. Ann Rehabil Med. 2023. PMID: 37990502 Free PMC article.
-
Causal associations between sarcopenia-related traits and intervertebral disc degeneration: a two-sample mendelian randomization analysis.Eur Spine J. 2024 Jun;33(6):2430-2438. doi: 10.1007/s00586-024-08291-w. Epub 2024 May 11. Eur Spine J. 2024. PMID: 38733399
-
Association between sarcopenia and the prevalence of gallstone in US adults: a cross-sectional analysis of NHANES.BMC Gastroenterol. 2025 Mar 29;25(1):207. doi: 10.1186/s12876-025-03808-z. BMC Gastroenterol. 2025. PMID: 40158173 Free PMC article.
References
-
- James SL, Abate D, Abate KH, et al. Global, regional, and national incidence, prevalence, and years lived with disability for 354 diseases and injuries for 195 countries and territories, 1990–2017: A systematic analysis for the Global Burden of Disease Study 2017. Lancet. 2018;392:1789–1858. doi: 10.1016/S0140-6736(18)32279-7. - DOI - PMC - PubMed
Publication types
MeSH terms
LinkOut - more resources
Full Text Sources
Other Literature Sources
Medical
