. 2021 Jul 1;162(7):bqab073.
doi: 10.1210/endocr/bqab073.

Pituitary Tumors and Immortalized Cell Lines Generated by Cre-Inducible Expression of SV40 T Antigen

Affiliations

Pituitary Tumors and Immortalized Cell Lines Generated by Cre-Inducible Expression of SV40 T Antigen

Alexandre Z Daly et al. Endocrinology. .

Abstract

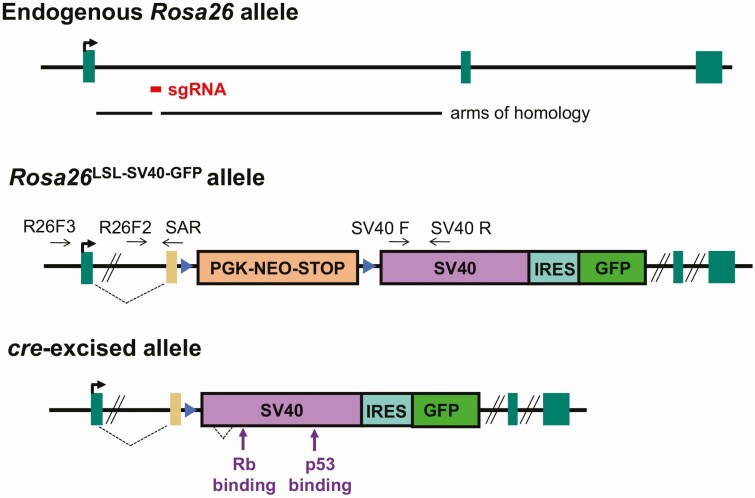
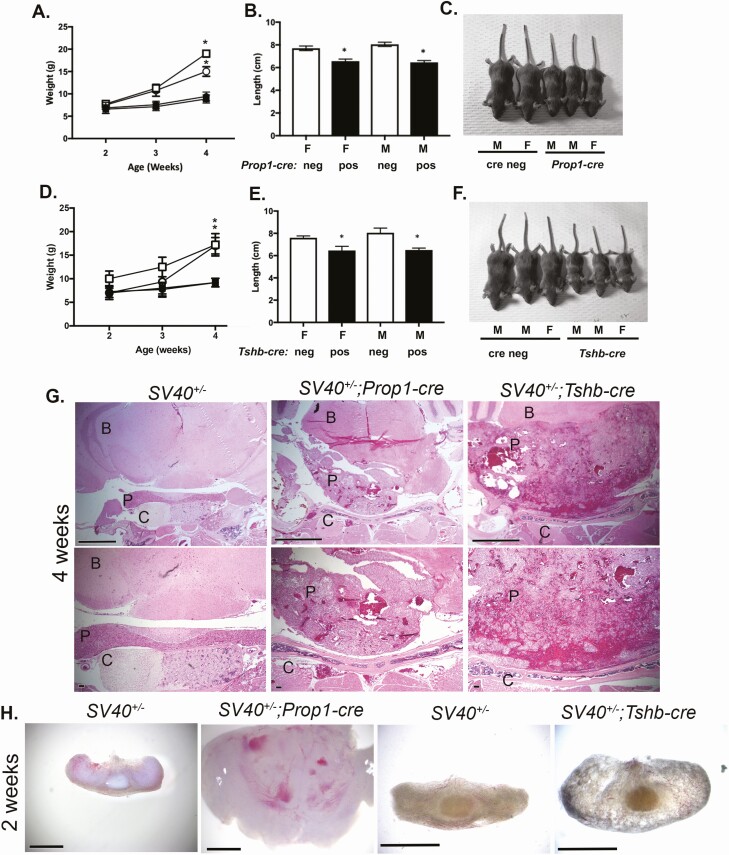
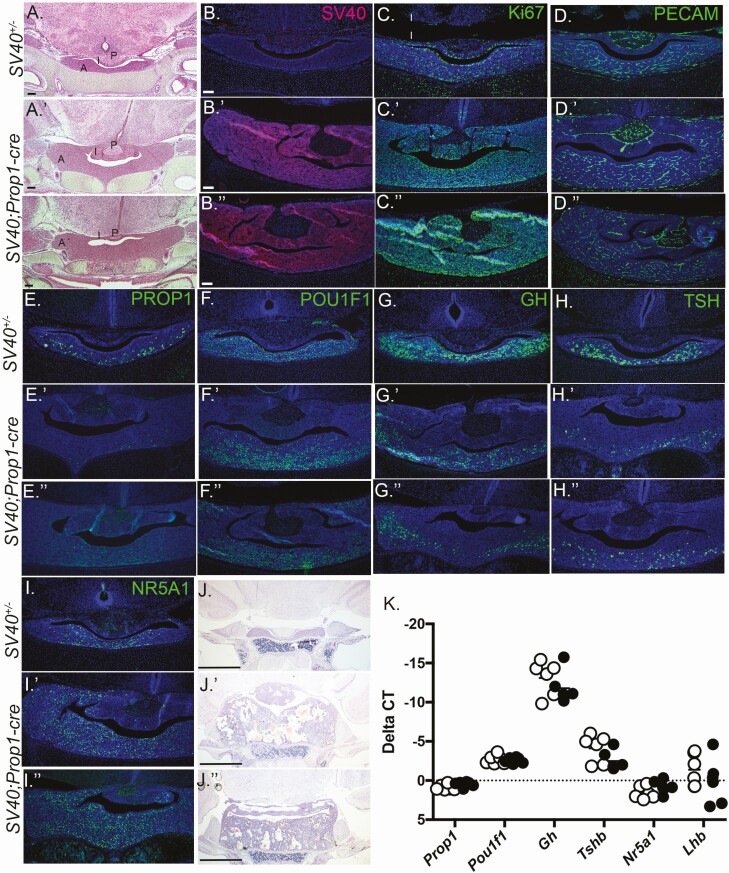
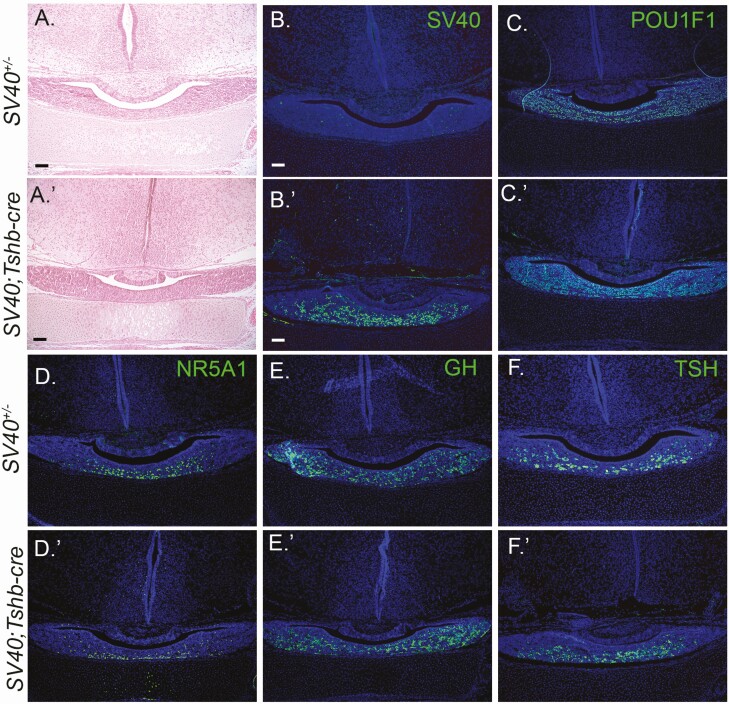
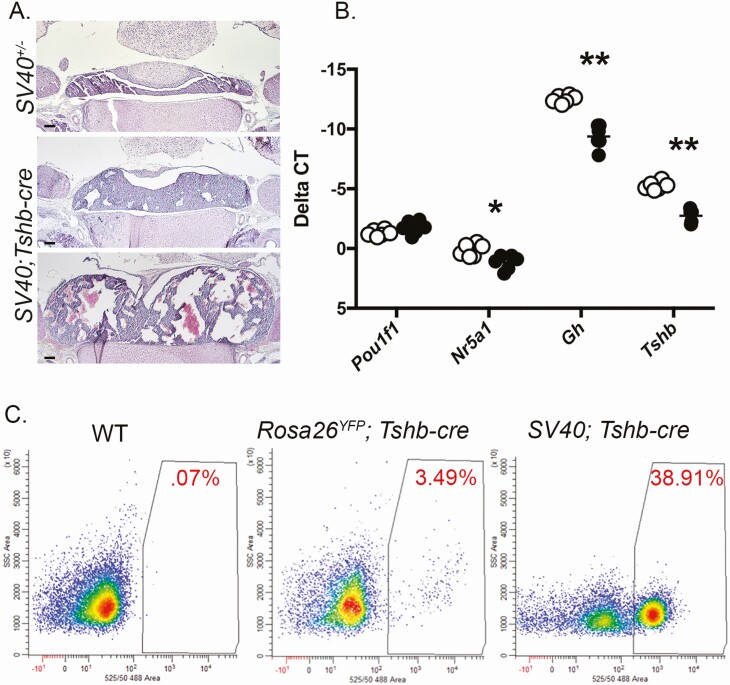
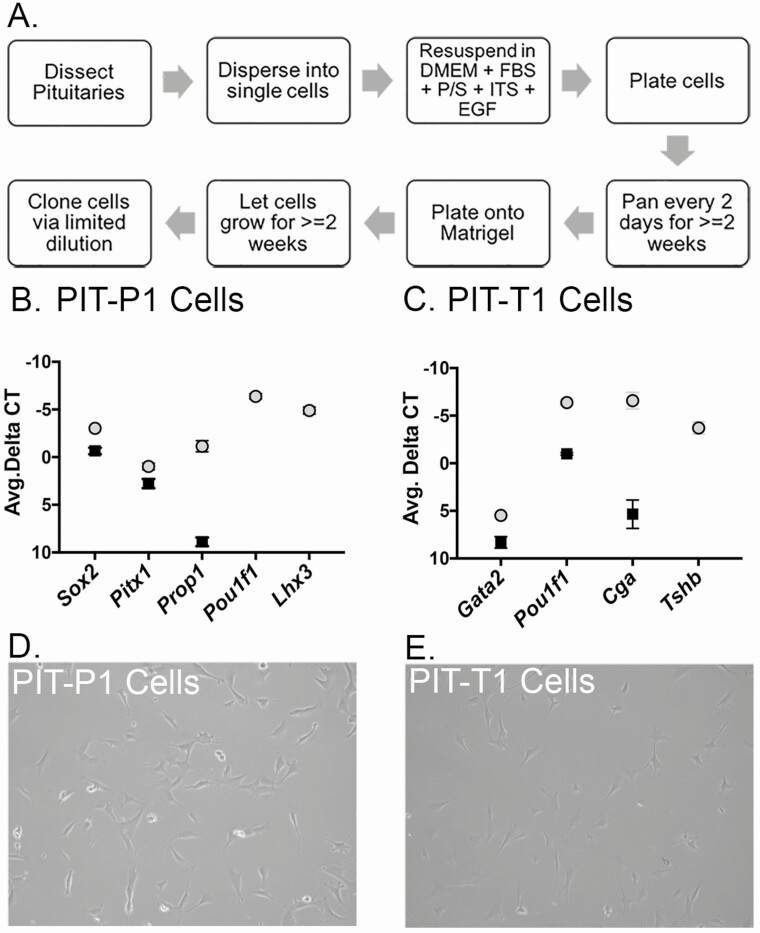
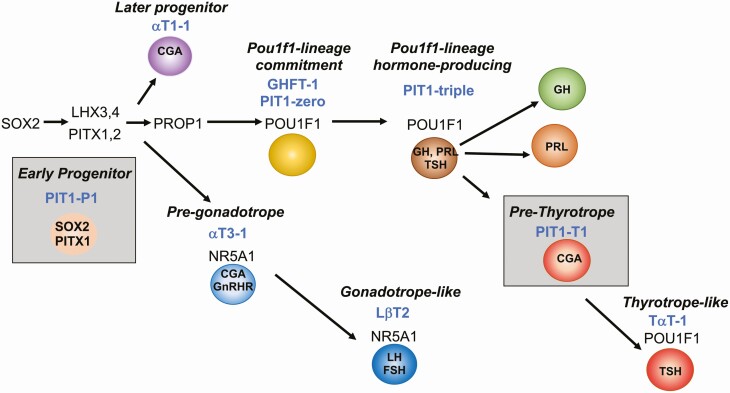
Targeted oncogenesis is the process of driving tumor formation by engineering transgenic mice that express an oncogene under the control of a cell-type specific promoter. Such tumors can be adapted to cell culture, providing immortalized cell lines. To make it feasible to follow the process of tumorigenesis and increase the opportunity for generating cell lines, we developed a mouse strain that expresses SV40 T antigens in response to Cre-recombinase. Using CRISPR/Cas9 we inserted a cassette with coding sequences for SV40 T antigens and an internal ribosome entry site with green fluorescent protein cassette (IRES-GFP) into the Rosa26 locus, downstream from a stop sequence flanked by loxP sites: Rosa26LSL-SV40-GFP. These mice were mated with previously established Prop1-cre and Tshb-cre transgenic lines. Both the Rosa26LSL-SV40-GFP/+; Prop1-cre and Rosa26LSL-SV40-GFP/+; Tshb-cre mice developed fully penetrant dwarfism and large tumors by 4 weeks. Tumors from both of these mouse lines were adapted to growth in cell culture. We have established a progenitor-like cell line (PIT-P1) that expresses Sox2 and Pitx1, and a thyrotrope-like cell line (PIT-T1) that expresses Pou1f1 and Cga. These studies demonstrate the utility of the novel, Rosa26LSL-SV40-GFP mouse line for reliable targeted oncogenesis and development of unique cell lines.

Keywords: PITX1; PROP1; SOX2; adenoma; progenitor; thyrotrope.


Figures

Figure 1.
Figure 1.
Development of Rosa26LSL-SV40-GFP mice. The endogenous Rosa26 allele is shown with the arms of homology in the targeting vector and the location targeted by the small guide RNA (sgRNA). Rosa26LSL-SV40-GFP knock-in allele contains the Pgk-neo stop sequence flanked by loxP sites and the downstream SV40 T antigen coding region, internal ribosome entry site (IRES), and green fluorescent protein (GFP) coding region. The new allele was characterized by PCR with a primer outside of the targeting vector (R26F3) and a primer complimentary to the gene trap splice acceptor sequence (SAR). Subsequent genotyping utilized the primer pairs R26F2 and SAR and SV40 forward and reverse (SV40F, SV40R). After cre-mediated excision of the stop sequence, SV40 and GFP will be expressed from the Rosa26 regulatory sequences.
Figure 2.
Figure 2.
Induction of SV40 TAg expression with Prop1-cre and Tshb-cre causes dwarfism and large pituitary tumors by 4 weeks. A, Weights of SV40; Prop1-cre (N = 7 female, N = 6 male, black symbols) and SV40 positive, cre negative littermates (N = 8 female, N = 4 male, white symbols) at 2, 3, and 4 weeks. Males and females are indicated with the square and circle symbols, respectively. B, Lengths of female (F) and male (M) mice (nose to base of tail) were measured at 4 weeks. White bars are SV40 positive, cre negative and black bars are SV40; Prop1-cre animals. C, Sample images of male (M) and female (F) SV40 positive, cre negative and SV40; Prop1-cre littermates at 4 weeks. D, Weights of SV40; Tshb-cre mice (N = 6 female, N = 6 male black symbols) and SV40 positive, cre negative littermates (N = 3 female, N = 4 male, white symbols) at 2, 3, and 4 weeks. Males and females are indicated with the square and circle symbols, respectively. E, Lengths of female (F) and male (M) mice (nose to base of tail) measured at 4 weeks. White bars are SV40 positive, cre negative and black bars are SV40; Tshb-cre animals. F, Sample images of male (M) and female (F) SV40 positive, cre negative and SV40; Tshb-cre littermates at 4 weeks. G, H&E staining revealed abnormal pituitary histology of 4-week-old SV40; Prop1-cre and SV40; Tshb-cre mice compared with SV40 positive, cre negative littermates (N = 3/genotype). The brain (B), pituitary (P), and cartilage (C) are labeled. Top panel magnification is 50× and scale bar is 1000 μm. Bottom panel magnification is 100× and scale bar is 100 μm. H, Brightfield images of whole pituitaries from 2-week-old SV40 positive, cre negative, SV40; Prop1-cre, and SV40; Tshb-cre mice (N = 3/genotype). SV40; Prop1-cre and control pituitary magnification is 32× with 1000 μm and SV40; Tshb-cre and control pituitary magnification is 50× with a 1000 μm scale bar.
Figure 3.
Figure 3.
SV40, Prop1-cre mice exhibit pituitary hyperplasia at birth. Coronal sections of P1 pituitaries from SV40 positive, cre negative littermates (A-I) and SV40; Prop1-cre mice (A′-I′′) were stained with H&E and various antibodies (N = 3/genotype). (A, A′, A′′) H&E staining at 50× magnification with a 100 μm scale bar. Immunostaining for SV40 (B, B′, B′′), Ki67 (C, C′, C′′), PROP1 (D, D′, D′′), POU1F1 (E, E′, E′′), GH (F, F′, F′′), TSH (G, G′, G′′), and NR5A1 (I, I′, I′′). DAPI staining (blue) of cell nuclei. B-I′′ magnification is 100× with 100 μm scale bar. Coronal sections of P10 pituitaries from SV40 positive, cre negative (J) and SV40; Prop1-cre (J′, J′′) stained with H&E, (N = 3 individuals/genotype), magnification is 50× with 100 μm scale bars (J-J′′). RNA prepared from P1 pituitary glands was used to synthesize cDNA and PCR amplified with probes specific for Prop1, Pou1f1, Gh, Tshb, Nr5a1, and Lhb. Open circles indicate SV40 positive, cre negative animals and black filled circles indicate SV40; Prop1-cre mice (N = 6 individuals/genotype).
Figure 4.
Figure 4.
SV40; Tshb-cre mice have normal pituitary morphology and cell specification at birth. Coronal sections of P1 pituitaries from SV40 positive, cre negative (A-F) and SV40; Tshb-cre mice (A′-F′) were stained with H&E and various antibodies (N = 3 individuals/genotype). The magnification is 100× with 100 μm scale bar. H&E staining (A, A′) and immunostaining for SV40 (B, B′), POU1F1 (C, C′), NR5A1 (D, D′), GH, (E, E′), and TSH (F, F′). DAPI staining (blue) of cell nuclei B-F′.
Figure 5.
Figure 5.
SV40; Tshb-cre pituitaries have altered gene expression postnatally. A, Coronal sections of P10 pituitaries from SV40 positive, cre negative and SV40; Tshb-cre littermates stained with H&E, (N = 3 individuals/genotype) magnification is 50× with 100 μm scale bars. B, Transcripts for Pou1f1, Nr5a1, Gh, and Tshb were measured by qRT-PCR in pituitaries from P7 SV40 positive, cre negative mice (open circles) and SV40; Tshb-cre littermates (black circles), N = 6 individuals/genotype. The statistical significance is indicated as * for P < 0.05 and ** for P < 0.01. C, Representative fluorescent-activated cell sorting of pituitary cell dispersions from P14 wild-type (WT), Gt(ROSA)26Sortm1(EYFPCos); Tshb-cre (RosaYFP; Tshb-cre), and SV40; Tshb-cre mice. The percentage of fluorescent cells is indicated in red.
Figure 6.
Figure 6.
Characterization of immortalized cell lines by gene expression profiling. A, Protocol for generating clonal cell lines from SV40-induced tumors. B, RNA from SV40 immortalized Pit-P1 cells (black squares) and P4 pituitary glands (light gray circles) was analyzed for expression of Prop1, Sox2, Pitx1, Pou1f1, Lhx3, and Hprt using qRT-PCR. Values were normalized to Hprt. Assays were performed in triplicate on 6 independent batches of RNA. Pou1f1 and Lhx3 were not detectable in the Pit-P1 cells. C, RNA from SV40 immortalized Pit-T1 cells (black squares) and P4 pituitary glands (light gray circles) was analyzed for expression of Gata2, Pou1f1, Cga, Tshb, and Hprt using qRT-PCR. Values were normalized to Hprt. Assays were performed in triplicate on 6 independent batches of RNA. Tshb was not detectable in the Pit-T1 cells. D, Brightfield image of the PIT-P1 cell line. E, Brightfield image of the PIT-T1 cell line.
Figure 7.
Figure 7.
PIT-P1 and PIT-T1 cells represent 2 new niches within the pituitary differentiation cascade. Representation of transcription factors regulating pituitary growth and differentiation and the stages represented by commonly used immortalized cell lines. The PIT-P1 cell line represents a Sox2- and Pitx1-expressing pituitary precursor, whereas PIT-T1 cells represents a pre-thyrotrope expressing Pou1f1 and Cga.

Similar articles

Cited by

References

    1. Zhu Z, Cui W, Zhu D, Gao N, Zhu Y. Common tools for pituitary adenomas research: cell lines and primary cells. Pituitary. 2020;23(2):182-188. - PubMed
    1. Ahuja D, Sáenz-Robles MT, Pipas JM. SV40 large T antigen targets multiple cellular pathways to elicit cellular transformation. Oncogene. 2005;24(52):7729-7745. - PubMed
    1. Manfredi JJ, Prives C. The transforming activity of simian virus 40 large tumor antigen. Biochim Biophys Acta. 1994;1198(1):65-83. - PubMed
    1. Alarid ET, Windle JJ, Whyte DB, Mellon PL. Immortalization of pituitary cells at discrete stages of development by directed oncogenesis in transgenic mice. Development. 1996;122(10):3319-3329. - PubMed
    1. Lew D, Brady H, Klausing K, et al. GHF-1-promoter-targeted immortalization of a somatotropic progenitor cell results in dwarfism in transgenic mice. Genes Dev. 1993;7(4):683-693. - PubMed

Publication types