. 2021 Jun;112(6):2260-2271.
doi: 10.1111/cas.14913. Epub 2021 May 7.

LINC01123 enhances osteosarcoma cell growth by activating the Hedgehog pathway via the miR-516b-5p/Gli1 axis

Affiliations

LINC01123 enhances osteosarcoma cell growth by activating the Hedgehog pathway via the miR-516b-5p/Gli1 axis

Xiaohui Pan et al. Cancer Sci. 2021 Jun.

Abstract

The lncRNA LINC01123 has been reported to act as an oncogene in many human cancers. Nevertheless, the function and underlying mechanism of LINC01123 in osteosarcoma (OS) remain unclear. This study aimed to explore the roles and mechanisms of LINC01123 in OS progression. In this study, the expression of LINC01123 was significantly upregulated in OS cell lines than in a human osteoblast cell line. Furthermore, in vitro and in vivo experiments confirmed that knockdown of LINC01123 suppressed cell progression. Mechanistically, LINC01123 acted as a competing endogenous RNA by sponging miR-516b-5p, thus, increasing Gli1 expression by directly targeting its 3'UTR. Taken together, LINC01123 enhances OS proliferation and metastasis via the miR-516b-5p/Gli1 axis. Therefore, LINC01123 may be a potential therapeutic target for OS treatment.

Keywords: Gli1; LINC01123; metastasis; osteosarcoma; proliferation.


Conflict of interest statement

The authors declare that they have no conflict of interest.

Figures

FIGURE 1
FIGURE 1
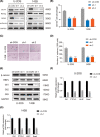
LINC01123 expression is significantly increased in OS cell lines and knockdown of LINC01123 inhibits OS cells growth. A, LINC01123 expression was detected in a normal osteoblast cell line (hFOB1.19) and OS cell lines (U‐2OS, 143B, MG63, and Saos‐2). Data were presented as the mean ±SD, **P <.01, ***P <.001. B, The knockdown efficiency of LINC01123 was detected in U2OS and 143B cells by qRT‐PCR. Data were presented as the mean ±SD, **P <.01. C and D, Knockdown of LINC01123 suppressed proliferation capability of U‐2OS and 143B cells using the CCK‐8 assay. Data were presented as the mean ±SD, **P <.01. E, Cell viability was measured in OS cells with LINC01123 knockdown or not using the colony formation assay. Data were presented as the mean ±SD, **P <.01. F and G, LINC01123 shRNA decreased the percentage of EdU‐positive OS cells, Scale bars =100 μm. Data were presented as the mean ±SD, **P <.01. H and I, Cell migration ability was detected in OS cells with LINC01123 knockdown or not. Scale bars =50 μm. Data were presented as the mean ±SD, **P <.01. J and K, Cell invasion ability was detected in OS cells with LINC01123 knockdown or not. Scale bars =50 μm. Data were presented as the mean ±SD, **P <.01
FIGURE 2
FIGURE 2
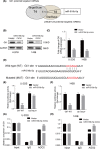
LINC01123 regulated cell stemness by activating the Hedgehog pathway. A, The protein level of CSC markers (OCT4, Nanog and SOX2) were examined in OS cells with LINC01123 knockdown or not. B, Fluorescence‐activated cell sorting (FACS) analysis of the CD133+ subpopulation of OS cells with LINC01123 knockdown or not. Data were presented as the mean ±SD, **P <.01. C and D, Self‐renewal ability was detected in OS cells with LINC01123 knockdown or not by sphere formation assays. Scale bars =50 μm. Data were presented as the mean ±SD, ***P <.001. E, LINC01123 activated the Hh signaling, but did not activate the Notch signaling pathway and the Wnt signaling pathway. F and G, The expression of target genes of Hh pathway were detected by qRT‐PCR. Data were presented as the mean ±SD, **P <.01, ***P <.001
FIGURE 3
FIGURE 3
LINC01123 enhanced cell proliferation by modulating Gli1 expression. A, Overexpression efficacy of Gli1 in sh‐ LINC01123 OS cells (U‐2OS and 143B) was detected by western blotting. B and C, Overexpression of Gli1 partly reversed the suppressed effects of LINC01123‐knockdown on the cell viability of U‐2OS and 143B cells using the CCK‐8 assay. Data were presented as the mean ±SD, *P <.05, **P <.01. D and E, Overexpression of Gli1 partly reversed the suppressed effects of LINC01123‐knockdown on the cell viability of U‐2OS and 143B cells using the colony formation assay. Data were presented as the mean ±SD, **P <.01, ***P <.001. F‐I, Overexpression of Gli1 partly reversed the suppressed effects of LINC01123‐knockdown on the Cell migration (F and G) and invasion (H and I) ability of U‐2OS and 143B cells. Scale bars =50 μm. Data were presented as the mean ±SD, **P <.01, ***P <.001. J and K, Overexpression of Gli1 partly reversed the inhibitory effects of LINC01123‐knockdown on the self‐renewal ability of U‐2OS and 143B cells. Scale bars =50 μm. Data were presented as the mean ±SD, ***P <.001
FIGURE 4
FIGURE 4
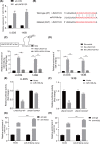
Gli1 was a direct target of miR‐561b‐5p. A, Venn diagram showing the predicted target genes of Gli1 and LINC01123 from databases (TargetScan and StarBase). B and C, Gli1 expression was detected in the U‐2OS and 143B cells transfected with miR‐561b‐5p mimics by qRT‐PCR and western blotting. D, The wild‐type and the mutated sequences of the Gli1 mRNA 3’‐UTR (mutation site: red). E and F, The relative luciferase activity of luciferase reporters containing Gli1 wild‐type (WT) or mutated (MUT) co‐transfected with miR‐561b‐5p or its negative control in U‐2OS and 143B cells was assessed. Data were presented as the mean ±SD, **P <.01, ***P <.001. G and H, RIP assays using antibodies against AGO2 or IgG were performed in cellular lysates from U‐2OS and 143B cells. The relative enrichment of Gli1 was measured in cells transfected with miR‐561b‐5p or NC mimics by qRT‐PCR, Data were presented as the mean ±SD, **P <.01, ***P <.001
FIGURE 5
FIGURE 5
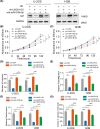
LINC01123 bound to miR‐561b‐5p and decreased its expression in the OS cells. A, miR‐561b‐5p expression was detected in OS cells with LINC01123 knockdown or not. B, The wild‐type and the mutated sequences of the LINC01123 mRNA 3’‐UTR (mutation site: red). C, Top panel shows a schematic image of a construction containing LINC01123 wild type combined with MS2 binding sequence. MS2‐RIP followed by miR‐561b‐5p qRT‐PCR to measure miR‐561b‐5p endogenously associated with LINC01123. Data were presented as the mean ±SD, **P <.01. D, U‐2OS and 143B cells lysate were incubated with biotin‐labeled LINC01123, qRT‐PCR measured miR‐561b‐5p expression in the products of pulldown by biotin, Data were presented as the mean ±SD, **P <.01. E and F, The relative luciferase activity of luciferase reporters containing LINC01123 wild‐type (WT) or mutated (MUT) co‐transfected with miR‐561b‐5p or its negative control in U‐2OS and 143B cells was assessed. Data were presented as the mean ±SD, **P <.01. G and H, AGO2‐RIP followed by qRT‐PCR to evaluate LINC01123 level after miR‐561b‐5p overexpression. **P <.01, ***P <.001
FIGURE 6
FIGURE 6
MiR‐561b‐5p inhibition partly rescued the LINC01123 knockdown effect in OS cells. A, Western blot showed the Gli1 expression in U‐2OS and 143B cells transfected with miR‐561b‐5p inhibitor, sh‐LINC01123, or negative control. B and C, miR‐561b‐5p‐knockdown partly reversed the inhibitory effects of LINC01123‐knockdown on the cell viability of U‐2OS and 143B cells using the CCK‐8 assay and silenced miR‐561b‐5p in wide type OS cells (U‐2OS and 143B) also promoted their proliferation. Data were presented as the mean ±SD, *P <.05, **P <.01. D, miR‐561b‐5p‐knockdown partly reversed the inhibitory effects of LINC01123‐knockdown on the colony formation properties of U‐2OS and 143B cells and silenced miR‐561b‐5p in wide type OS cells (U‐2OS and 143B) also promoted their proliferation. Data were presented as the mean ±SD, *P <.05, **P <.01, ***P <.001. E, miR‐561b‐5p‐knockdown partly reversed the suppressed effects of LINC01123‐knockdown on the cell migration ability of U‐2OS and 143B cells. Silenced miR‐561b‐5p in wide type OS cells (U‐2OS and 143B) also promoted their cell migration ability. Data were presented as the mean ±SD, *P <.05, **P <.01. F, miR‐561b‐5p‐knockdown partly reversed the suppressed effects of LINC01123‐knockdown on the cell invasion ability of U‐2OS and 143B cells. Silenced miR‐561b‐5p in wide type OS cells (U‐2OS and 143B) also promoted their cell invasion ability. Data were presented as the mean ±SD, *P <.05, **P <.01, ***P <.001. G, miR‐561b‐5p‐knockdown partly reversed the suppressed effects of LINC01123‐knockdown on the cell stemness ability of U‐2OS and 143B cells. Silenced miR‐561b‐5p in wide type OS cells (U‐2OS and 143B) also promoted their cell stemness ability. Data were presented as the mean ±SD, *P <.05, **P <.01, ***P <.001
FIGURE 7
FIGURE 7
LINC01123 promoted cell growth by sponging miR‐561b‐5p in vivo. A, Morphologic characteristics of xenograft tumors from U‐2OS/sh‐Control group, U‐2OS/sh‐LINC01123 group and U‐2OS/sh‐LINC01123 + anti‐miR‐561b‐5p group (n = 4). Scale bars =1 cm. B, The tumor volumes were measured with calipers every 5 days. Data were presented as the mean ±SD, *P <.05. C, Tumor weights at 20 days were measured in each group. The median, upper, and lower quartiles were plotted, and the whiskers that extend from each box indicate the range of values that were outside of the intra‐quartile range. n = 4, *P <.05. D, Tumor volumes at 20 days were measured in each group. The median, upper, and lower quartiles were plotted, and the whiskers that extend from each box indicate the range values that were outside of the intra‐quartile range. n = 4, *P <.05. E, Representative images of Ki67 and TUNEL staining in the xenograft tumors from the sh‐Control, sh‐ LINC01123 and sh‐LINC01123 + anti‐miR‐561b‐5p mice. A TUNEL positive cell is indicated (arrow). Scale bars =50μm. F‐H, The expression of LINC01123, miR‐561b‐5p and Gli1 in xenografts was examined by RT‐qPCR. Data were presented as the mean ±SD, **P <.01, ***P <.001

Similar articles

Cited by

References

    1. Ritter J, Bielack Ss. Osteosarcoma. Ann Oncol. 2010;7:vii320–vii325. - PubMed
    1. Isakoff MS, Bielack SS, Meltzer P, Gorlick R. Osteosarcoma: current treatment and a collaborative pathway to success. J Clin Oncol. 2015;33:3029‐3035. - PMC - PubMed
    1. Meazza C, Scanagatta P. Metastatic osteosarcoma: a challenging multidisciplinary treatment. Expert Rev Anticancer Ther. 2016;16:543‐556. - PubMed
    1. Quinn JJ, Chang HY. Unique features of long non‐coding RNA biogenesis and function. Nat Rev Genet. 2016;17:47‐62. - PubMed
    1. Kartha RV, Subramanian S. Competing endogenous RNAs (ceRNAs): new entrants to the intricacies of gene regulation. Front Genet. 2014;5:8. - PMC - PubMed

MeSH terms