

Prediction of COVID-19 cases using the weather integrated deep learning approach for India
- PMID: 33837675
- PMCID: PMC8250893
- DOI: 10.1111/tbed.14102
Prediction of COVID-19 cases using the weather integrated deep learning approach for India
Abstract
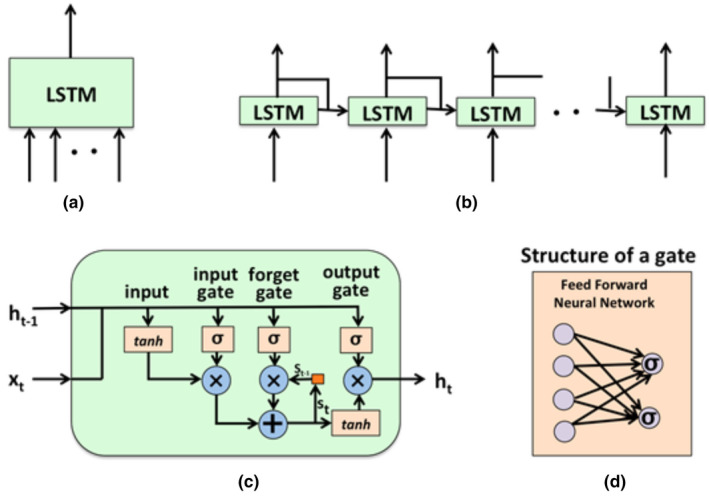
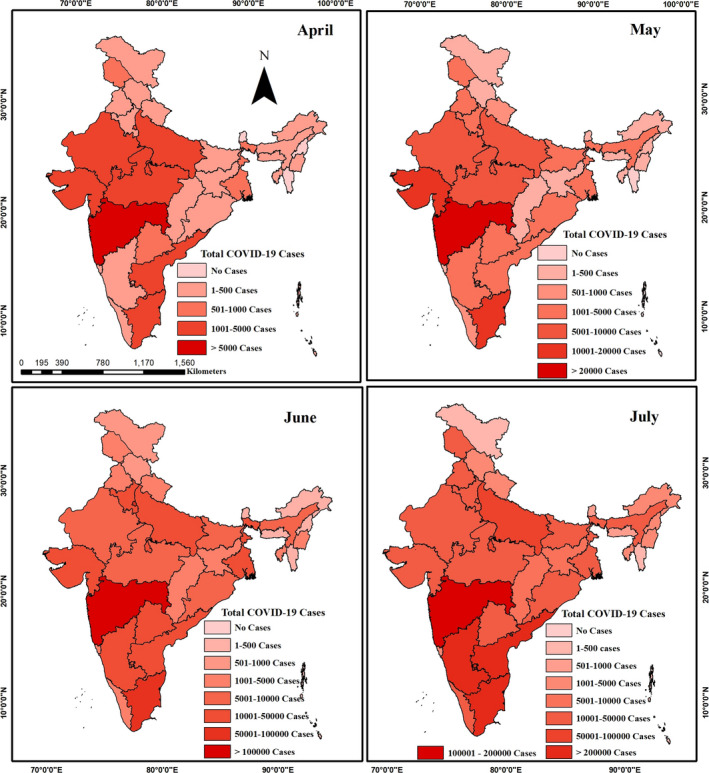
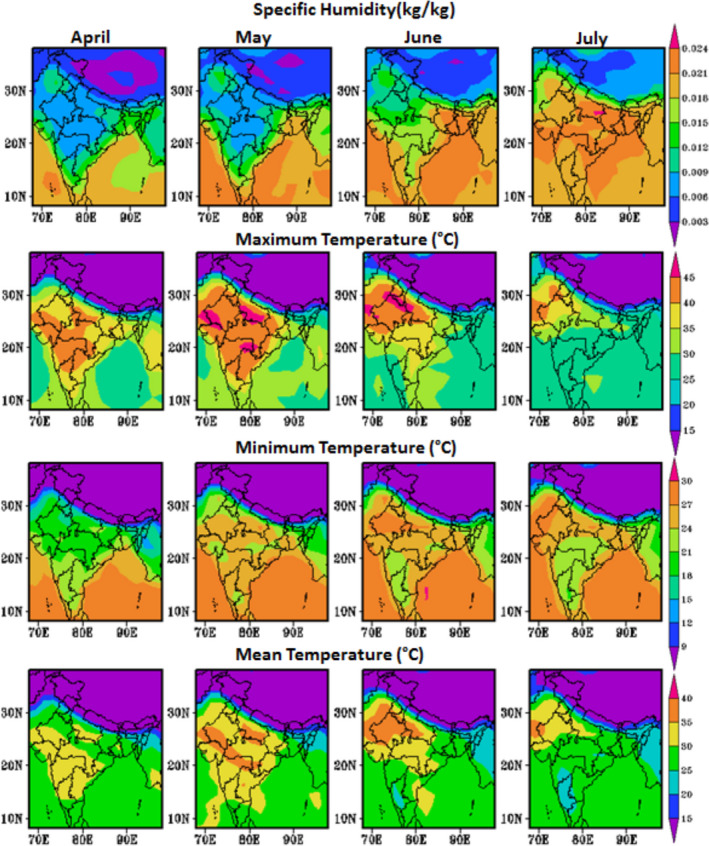
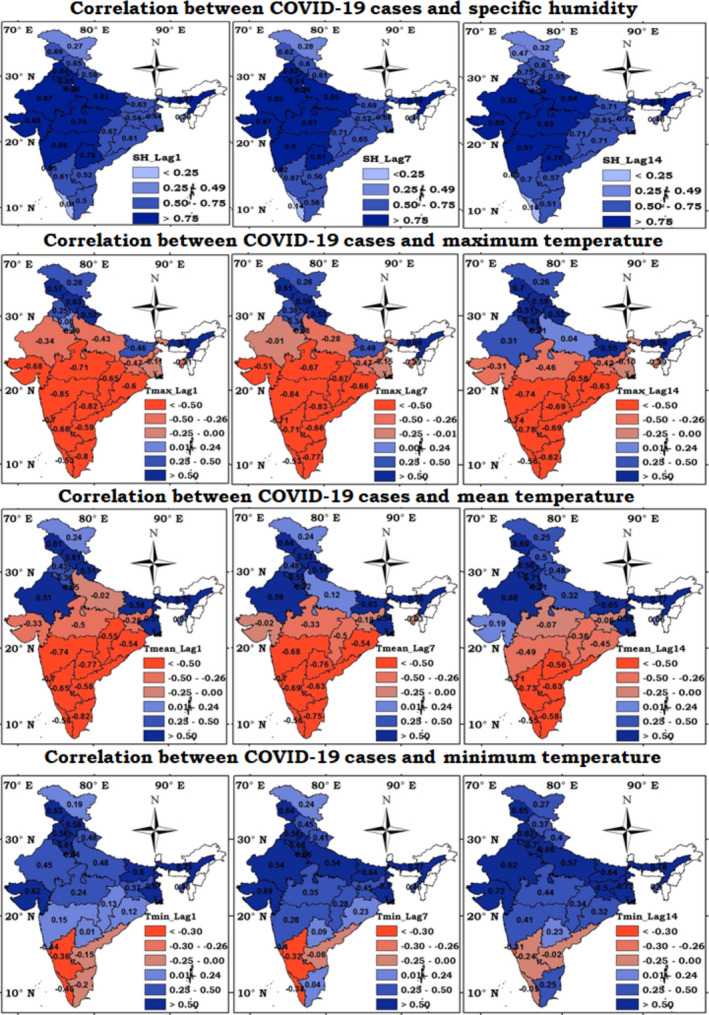
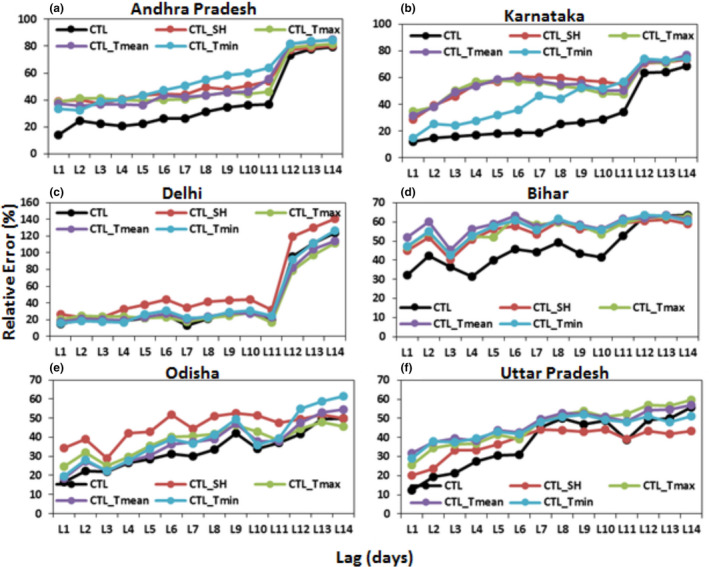
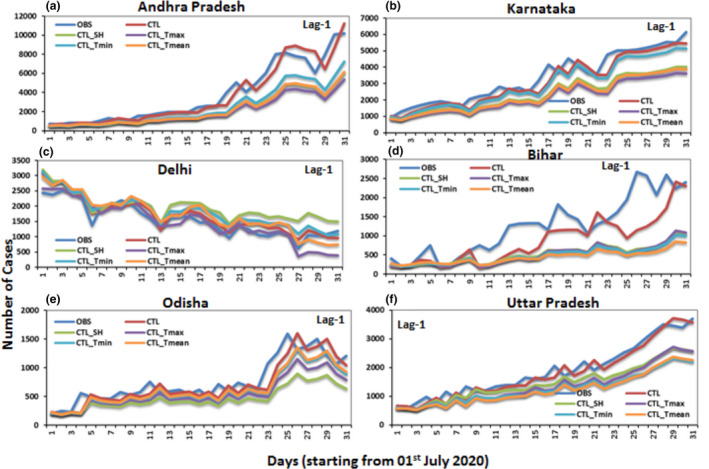
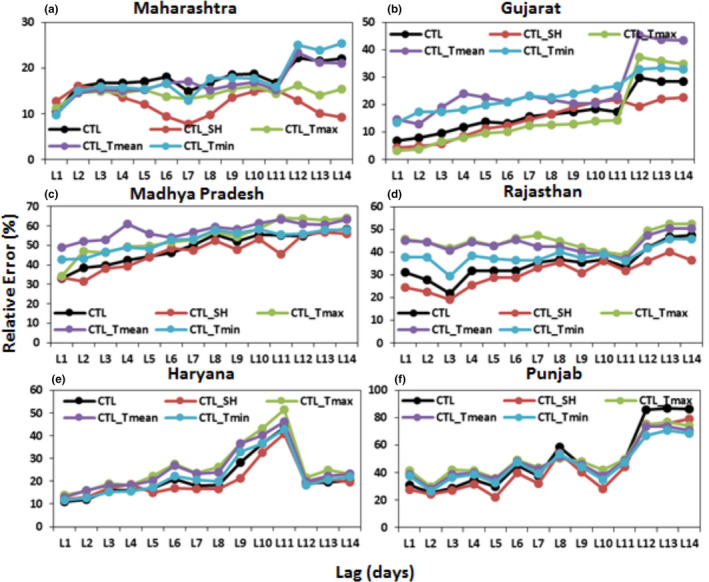
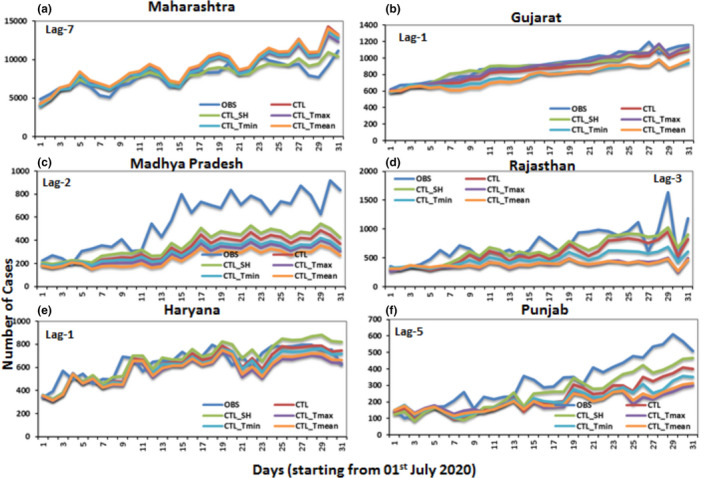
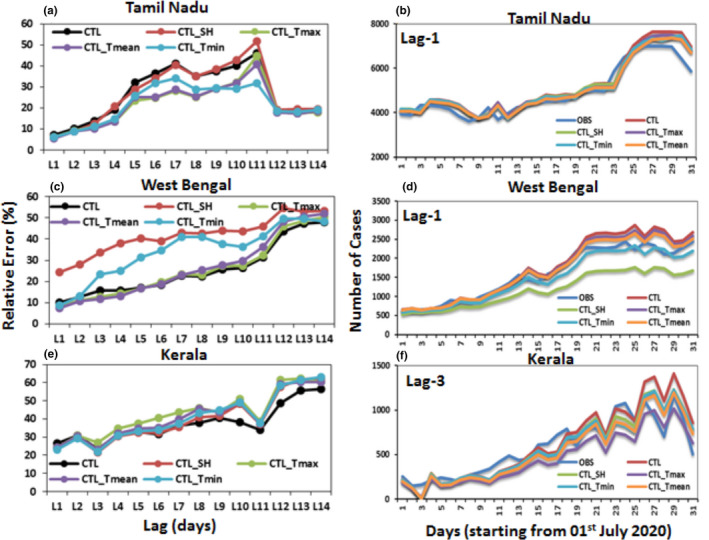
Advanced and accurate forecasting of COVID-19 cases plays a crucial role in planning and supplying resources effectively. Artificial Intelligence (AI) techniques have proved their capability in time series forecasting non-linear problems. In the present study, the relationship between weather factor and COVID-19 cases was assessed, and also developed a forecasting model using long short-term memory (LSTM), a deep learning model. The study found that the specific humidity has a strong positive correlation, whereas there is a negative correlation with maximum temperature, and a positive correlation with minimum temperature was observed in various geographic locations of India. The weather data and COVID-19 confirmed case data (1 April to 30 June 2020) were used to optimize univariate and multivariate LSTM time series forecast models. The optimized models were utilized to forecast the daily COVID-19 cases for the period 1 July 2020 to 31 July 2020 with 1 to 14 days of lead time. The results showed that the univariate LSTM model was reasonably good for the short-term (1 day lead) forecast of COVID-19 cases (relative error <20%). Moreover, the multivariate LSTM model improved the medium-range forecast skill (1-7 days lead) after including the weather factors. The study observed that the specific humidity played a crucial role in improving the forecast skill majorly in the West and northwest region of India. Similarly, the temperature played a significant role in model enhancement in the Southern and Eastern regions of India.
Keywords: COVID-19; India; LSTM; SARS-CoV-2; prediction; specific humidity; temperature.
© 2021 Wiley-VCH GmbH.
Conflict of interest statement
The authors declare no competing financial interests exist.
Figures
Similar articles
-
A COVID-19 Pandemic Artificial Intelligence-Based System With Deep Learning Forecasting and Automatic Statistical Data Acquisition: Development and Implementation Study.J Med Internet Res. 2021 May 20;23(5):e27806. doi: 10.2196/27806. J Med Internet Res. 2021. PMID: 33900932 Free PMC article.
-
Comparative study of machine learning methods for COVID-19 transmission forecasting.J Biomed Inform. 2021 Jun;118:103791. doi: 10.1016/j.jbi.2021.103791. Epub 2021 Apr 26. J Biomed Inform. 2021. PMID: 33915272 Free PMC article.
-
Transfer Learning for COVID-19 cases and deaths forecast using LSTM network.ISA Trans. 2022 May;124:41-56. doi: 10.1016/j.isatra.2020.12.057. Epub 2021 Jan 4. ISA Trans. 2022. PMID: 33422330 Free PMC article.
-
Weather Conditions and COVID-19 Cases: Insights from the GCC Countries.Intell Syst Appl. 2022 Sep;15:200093. doi: 10.1016/j.iswa.2022.200093. Epub 2022 Jun 18. Intell Syst Appl. 2022. PMID: 40478008 Free PMC article.
-
Weather factors in the short-term forecasting of daily ambulance calls.Int J Biometeorol. 2014 Jul;58(5):669-78. doi: 10.1007/s00484-013-0647-x. Epub 2013 Mar 3. Int J Biometeorol. 2014. PMID: 23456448 Free PMC article.
Cited by
-
Deep learning framework for epidemiological forecasting: A study on COVID-19 cases and deaths in the Amazon state of Pará, Brazil.PLoS One. 2023 Nov 17;18(11):e0291138. doi: 10.1371/journal.pone.0291138. eCollection 2023. PLoS One. 2023. PMID: 37976312 Free PMC article.
-
LSTM-Powered COVID-19 prediction in central Thailand incorporating meteorological and particulate matter data with a multi-feature selection approach.Heliyon. 2024 Apr 26;10(9):e30319. doi: 10.1016/j.heliyon.2024.e30319. eCollection 2024 May 15. Heliyon. 2024. PMID: 38711630 Free PMC article.
-
Spatio-temporal variation of Covid-19 health outcomes in India using deep learning based models.Technol Forecast Soc Change. 2022 Oct;183:121911. doi: 10.1016/j.techfore.2022.121911. Epub 2022 Aug 2. Technol Forecast Soc Change. 2022. PMID: 35938066 Free PMC article.
-
A Comprehensive Review of Artificial Intelligence in Prevention and Treatment of COVID-19 Pandemic.Front Genet. 2022 Apr 26;13:845305. doi: 10.3389/fgene.2022.845305. eCollection 2022. Front Genet. 2022. PMID: 35559010 Free PMC article.
-
Role of different types of RNA molecules in the severity prediction of SARS-CoV-2 patients.Pathol Res Pract. 2023 Feb;242:154311. doi: 10.1016/j.prp.2023.154311. Epub 2023 Jan 15. Pathol Res Pract. 2023. PMID: 36657221 Free PMC article.
References
-
- Bloom‐Feshbach, K. , Alonso, W. J. , Charu, V. , Tamerius, J. , Simonsen, L. , Miller, M. A. , & Viboud, C. (2013). Latitudinal variations in seasonal activity of influenza and respiratory syncytial virus (RSV): A global comparative review. PLoS One, 8(2), e54445. 10.1371/journal.pone.0054445 - DOI - PMC - PubMed
MeSH terms
Grants and funding
LinkOut - more resources
Full Text Sources
Other Literature Sources
Medical
Miscellaneous
