

Quantitative Backscattered Electron Imaging of Bone Using a Thermionic or a Field Emission Electron Source
- PMID: 33837801
- PMCID: PMC8273060
- DOI: 10.1007/s00223-021-00832-5
Quantitative Backscattered Electron Imaging of Bone Using a Thermionic or a Field Emission Electron Source
Abstract
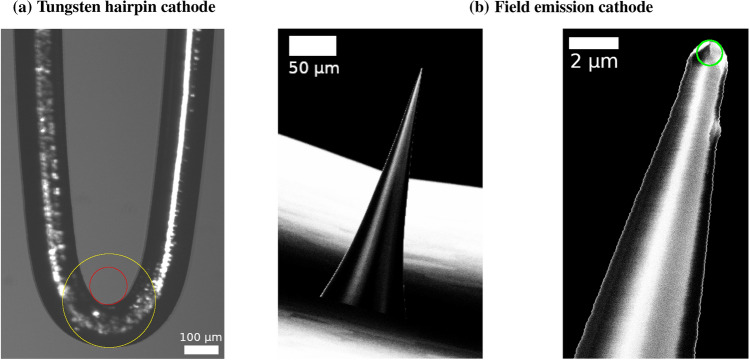
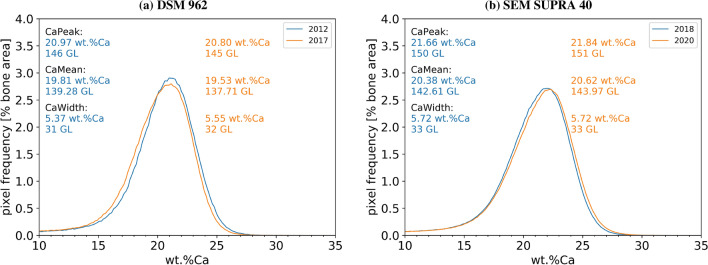
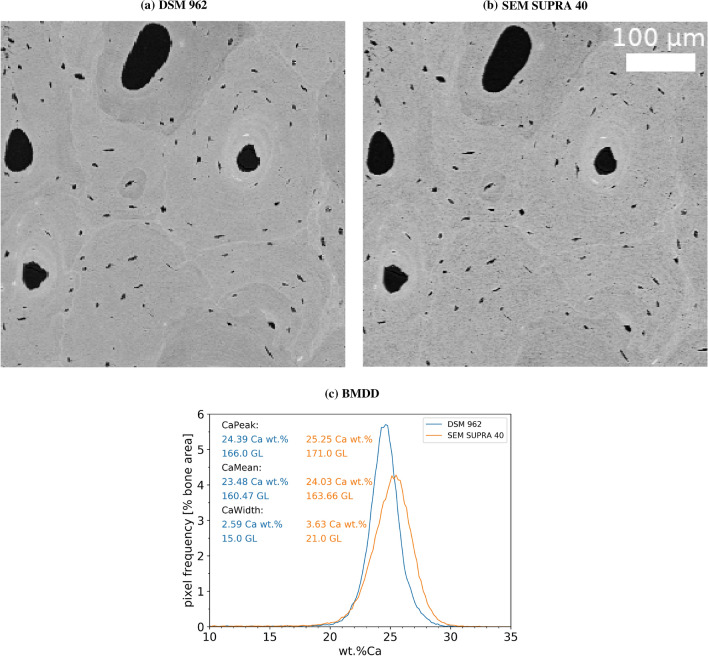
Quantitative backscattered electron imaging is an established method to map mineral content distributions in bone and to determine the bone mineralization density distribution (BMDD). The method we applied was initially validated for a scanning electron microscope (SEM) equipped with a tungsten hairpin cathode (thermionic electron emission) under strongly defined settings of SEM parameters. For several reasons, it would be interesting to migrate the technique to a SEM with a field emission electron source (FE-SEM), which, however, would require to work with different SEM parameter settings as have been validated for DSM 962. The FE-SEM has a much better spatial resolution based on an electron source size in the order of several 100 nanometers, corresponding to an about [Formula: see text] to [Formula: see text] times smaller source area compared to thermionic sources. In the present work, we compare BMDD between these two types of instruments in order to further validate the methodology. We show that a transition to higher pixel resolution (1.76, 0.88, and 0.57 μm) results in shifts of the BMDD peak and BMDD width to higher values. Further the inter-device reproducibility of the mean calcium content shows a difference of up to 1 wt% Ca, while the technical variance of each device can be reduced to [Formula: see text] wt% Ca. Bearing in mind that shifts in calcium levels due to diseases, e.g., high turnover osteoporosis, are often in the range of 1 wt% Ca, both the bone samples of the patients as well as the control samples have to be measured on the same SEM device. Therefore, we also constructed new reference BMDD curves for adults to be used for FE-SEM data comparison.
Keywords: Adult human bone; Bone mineralization density distribution; Quantitative backscattered electron imaging.
© 2021. The Author(s).
Conflict of interest statement
Markus A. Hartmann, Stéphane Blouin, Barbara M. Misof, Nadja Fratzl-Zelman, Paul Roschger, Andrea Berzlanovich, Gerlinde M. Gruber, Peter C. Brugger, Jochen Zwerina and Peter Fratzl declare that they have no conflict of interest.
Figures


Similar articles
-
Relationship of bone mineralization density distribution (BMDD) in cortical and cancellous bone within the iliac crest of healthy premenopausal women.Calcif Tissue Int. 2014 Oct;95(4):332-9. doi: 10.1007/s00223-014-9901-4. Epub 2014 Aug 19. Calcif Tissue Int. 2014. PMID: 25134800 Free PMC article.
-
Mineralization density distribution of postmenopausal osteoporotic bone is restored to normal after long-term alendronate treatment: qBEI and sSAXS data from the fracture intervention trial long-term extension (FLEX).J Bone Miner Res. 2010 Jan;25(1):48-55. doi: 10.1359/jbmr.090702. J Bone Miner Res. 2010. PMID: 19580465 Clinical Trial.
-
The bone mineralization density distribution as a fingerprint of the mineralization process.Bone. 2007 May;40(5):1308-19. doi: 10.1016/j.bone.2007.01.012. Epub 2007 Jan 25. Bone. 2007. PMID: 17337263
-
Bone mineralization density distribution in health and disease.Bone. 2008 Mar;42(3):456-66. doi: 10.1016/j.bone.2007.10.021. Epub 2007 Nov 12. Bone. 2008. PMID: 18096457 Review.
-
[Osteoporosis and metabolic bone diseases; clinical relationship].Wien Med Wochenschr. 1999;149(16-17):463-71. Wien Med Wochenschr. 1999. PMID: 10627983 Review. German.
Cited by
-
Bone Tissue Evaluation Indicates Abnormal Mineralization in Patients with Autoimmune Polyendocrine Syndrome Type I: Report on Three Cases.Calcif Tissue Int. 2023 Jun;112(6):675-682. doi: 10.1007/s00223-023-01077-0. Epub 2023 Mar 22. Calcif Tissue Int. 2023. PMID: 36944707 Free PMC article.
-
Normal Bone Matrix Mineralization but Altered Growth Plate Morphology in the LmnaG609G/G609G Mouse Model of Progeria.Aging Dis. 2024 Nov 4;16(5):3204-3218. doi: 10.14336/AD.2024.1094. Aging Dis. 2024. PMID: 39571160 Free PMC article.
-
The Lacunocanalicular Network is Denser in C57BL/6 Compared to BALB/c Mice.Calcif Tissue Int. 2024 Nov;115(5):744-758. doi: 10.1007/s00223-024-01289-y. Epub 2024 Oct 16. Calcif Tissue Int. 2024. PMID: 39414712 Free PMC article.
-
Bone quality in pycnodysostosis: micropetrosis, locally distorted osteocyte lacuno-canalicular network, and heterogenous mineralization pattern in an adult female patient with multiple fractures.JBMR Plus. 2025 Jan 23;9(4):ziaf015. doi: 10.1093/jbmrpl/ziaf015. eCollection 2025 Apr. JBMR Plus. 2025. PMID: 40144453 Free PMC article.
-
Increased Osteocyte Lacunae Density in the Hypermineralized Bone Matrix of Children with Osteogenesis Imperfecta Type I.Int J Mol Sci. 2021 Apr 26;22(9):4508. doi: 10.3390/ijms22094508. Int J Mol Sci. 2021. PMID: 33925942 Free PMC article.
References
-
- Fratzl P, Weinkamer R. Nature’s hierarchical materials. Prog Mater Sci. 2007;52:1263. doi: 10.1016/j.pmatsci.2007.06.001. - DOI
-
- Misof BM, Roschger P, Cosman F, Kurland ES, Tesch W, Messmer P, Dempster DW, Nieves J, Shane E, Fratzl P, Klaushofer K, Bilezikian J, Lindsay R. Effects of intermittent parathyroid hormone administration on bone mineralization density in iliac crest biopsies from patients with osteoporosis: A paired study before and after treatment. J Clin Endocrinol Metab. 2003;88(3):1150–1156. doi: 10.1210/jc.2002-021988. - DOI - PubMed
Publication types
MeSH terms
LinkOut - more resources
Full Text Sources
Other Literature Sources
