. 2021 May 11;54(5):931-946.e11.
doi: 10.1016/j.immuni.2021.03.020. Epub 2021 Apr 9.

A distal Foxp3 enhancer enables interleukin-2 dependent thymic Treg cell lineage commitment for robust immune tolerance

Affiliations

A distal Foxp3 enhancer enables interleukin-2 dependent thymic Treg cell lineage commitment for robust immune tolerance

Stanislav Dikiy et al. Immunity. .

Abstract

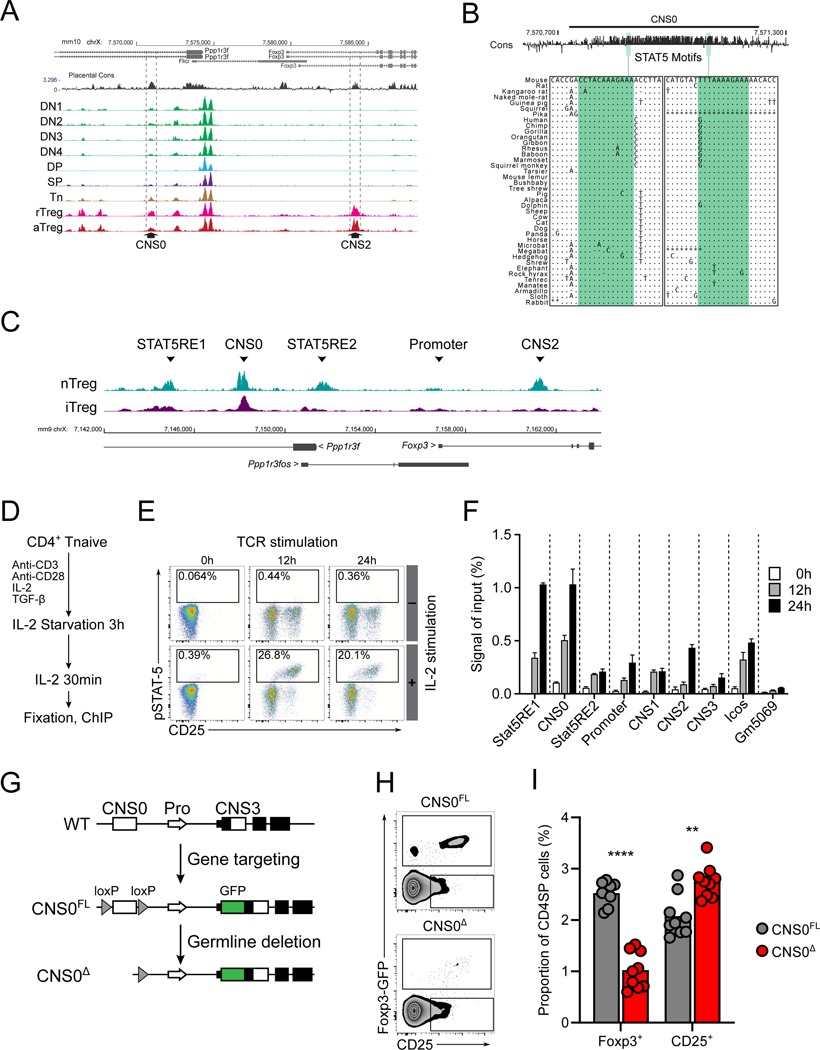
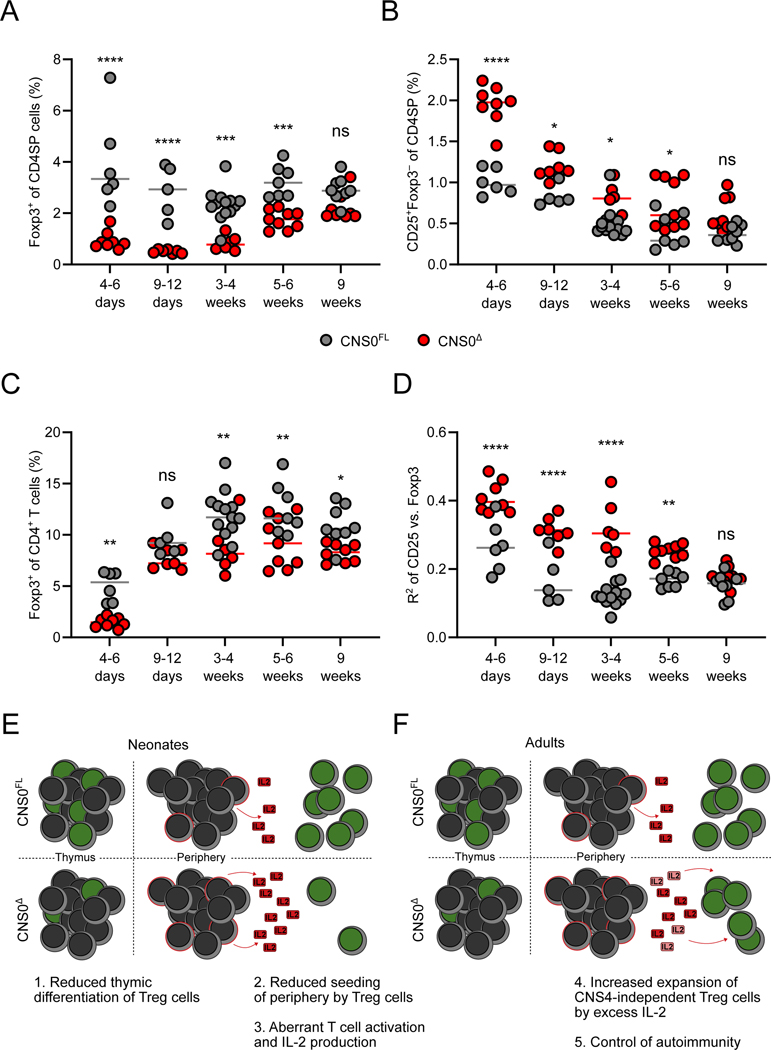
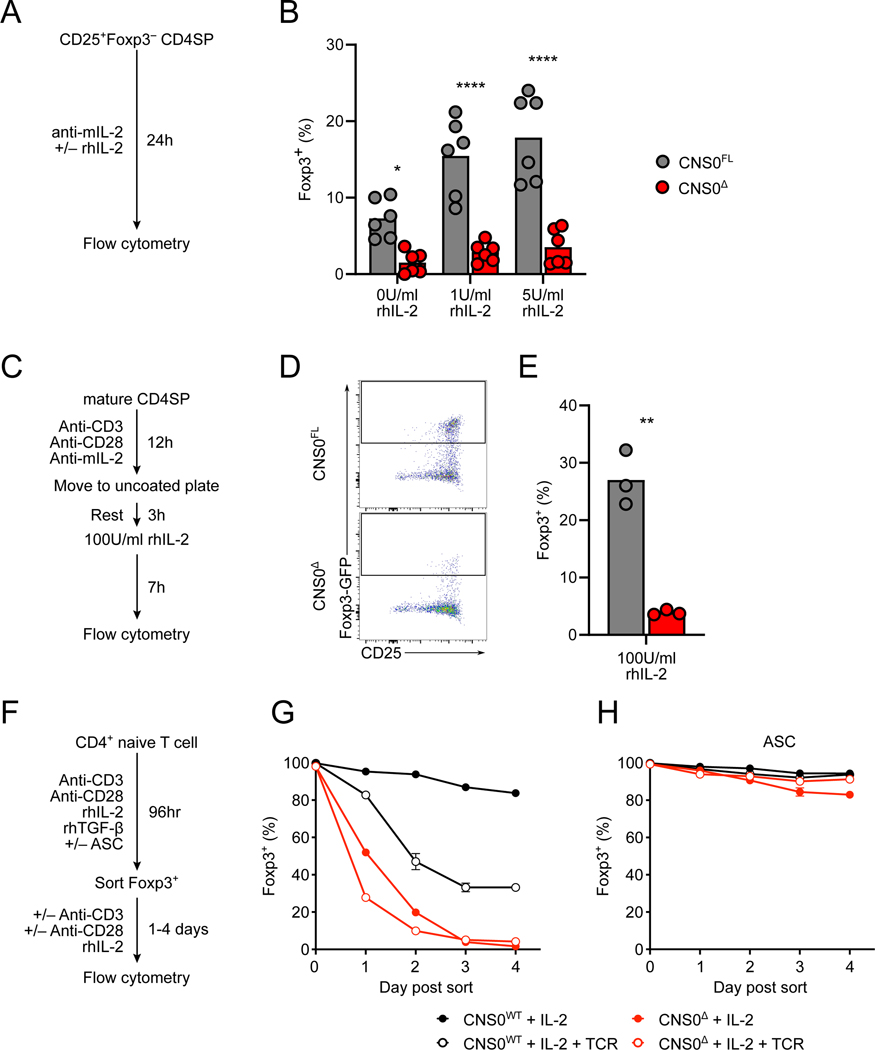
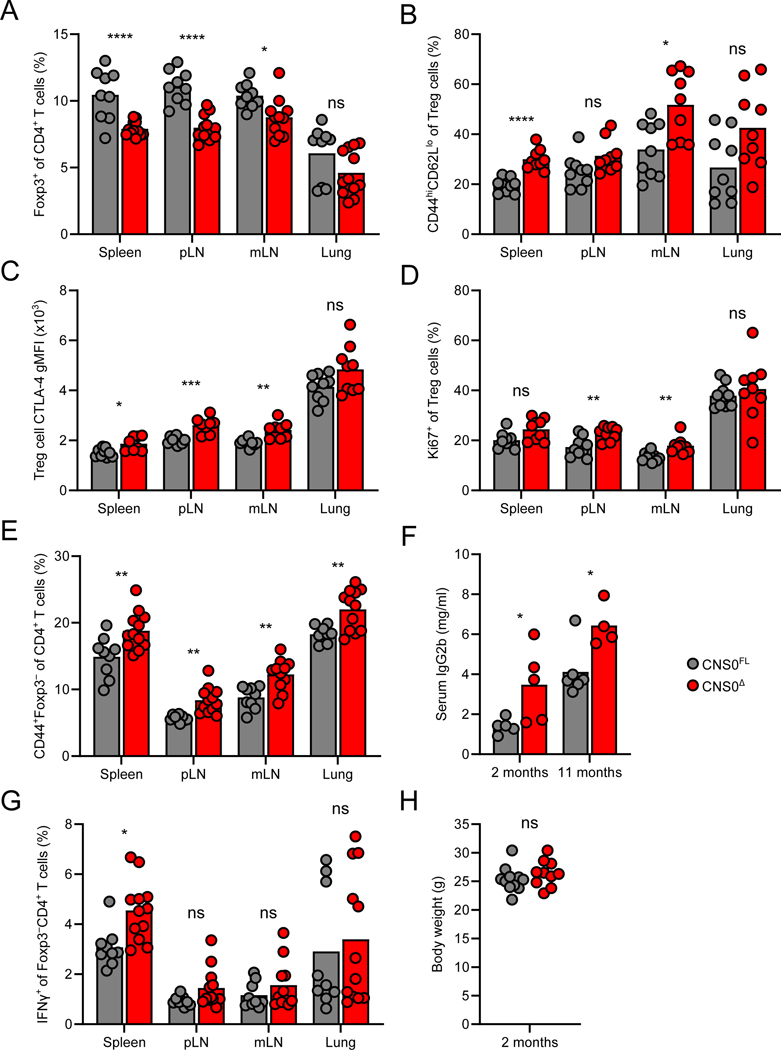
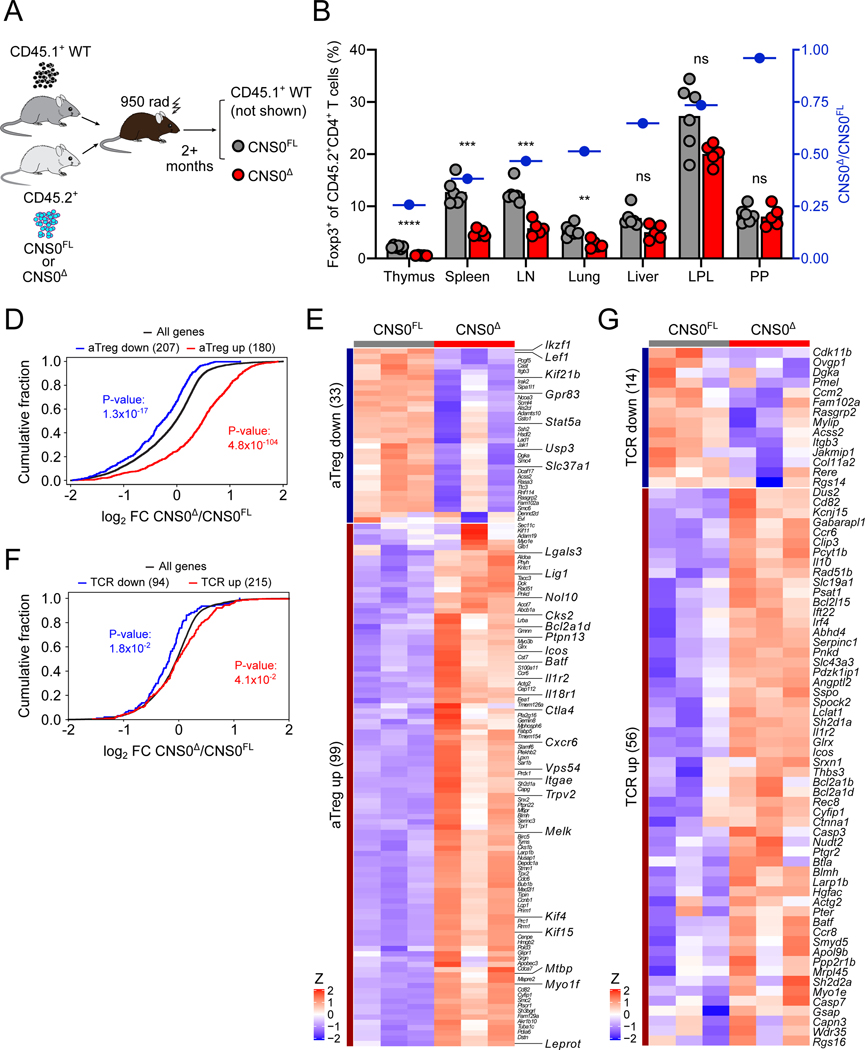
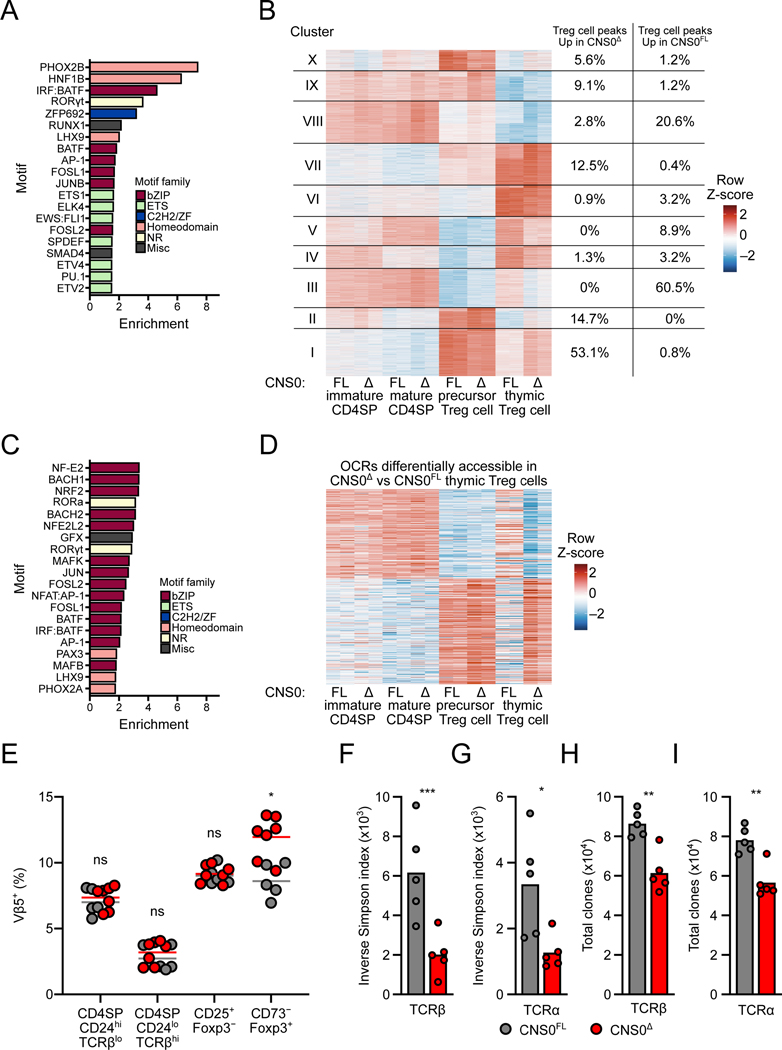
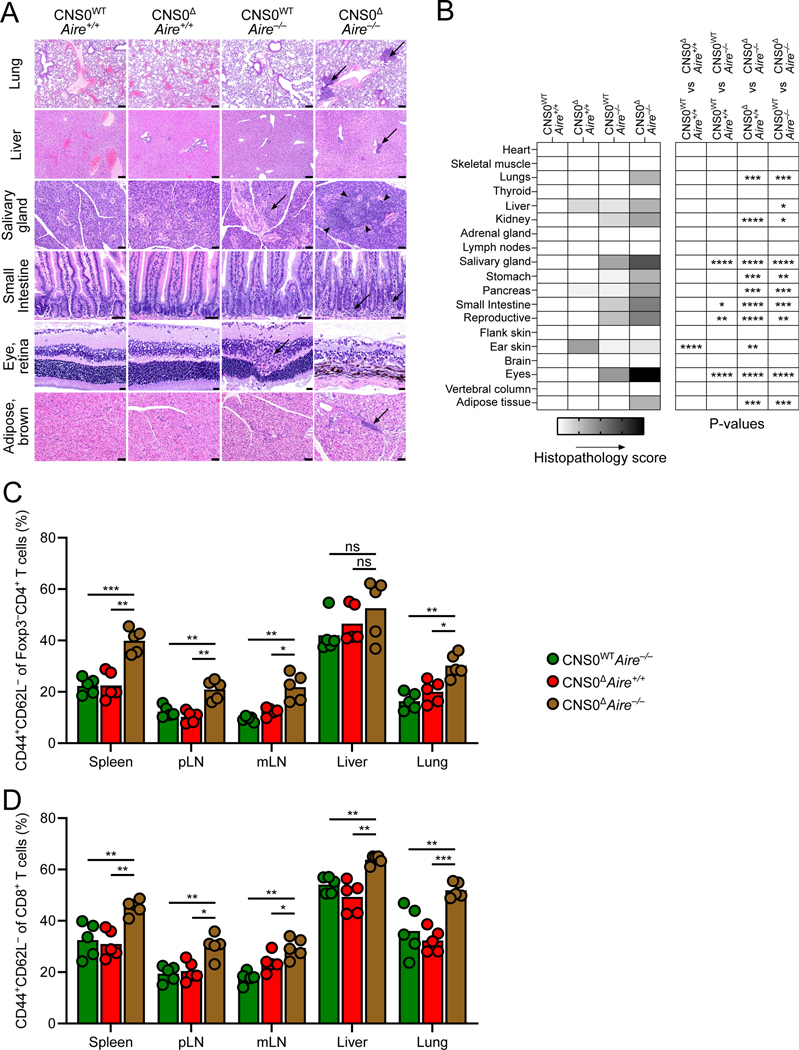
Activation of the STAT5 transcription factor downstream of the Interleukin-2 receptor (IL-2R) induces expression of Foxp3, a critical step in the differentiation of regulatory T (Treg) cells. Due to the pleiotropic effects of IL-2R signaling, it is unclear how STAT5 acts directly on the Foxp3 locus to promote its expression. Here, we report that IL-2 - STAT5 signaling converged on an enhancer (CNS0) during Foxp3 induction. CNS0 facilitated the IL-2 dependent CD25+Foxp3- precursor to Treg cell transition in the thymus. Its deficiency resulted in impaired Treg cell generation in neonates, which was partially mitigated with age. While the thymic Treg cell paucity caused by CNS0 deficiency did not result in autoimmunity on its own, it exacerbated autoimmune manifestations caused by disruption of the Aire gene. Thus, CNS0 enhancer activity ensures robust Treg cell differentiation early in postnatal life and cooperatively with other tolerance mechanisms minimizes autoimmunity.

Keywords: Foxp3; Regulatory T cells; enhancer; immune tolerance.


Conflict of interest statement

Declaration of interests A.Y.R. is an SAB member and a co-founder of Sonoma Biotherapeutics. All other authors declare no competing interests.

Figures

Figure 1.
Figure 1.. Identification and deletion of CNS0.
A. Placental sequence conservation and ATAC-seq tracks of indicated populations from Foxp3GFP mice. Double negative thymocytes (DN): CD4CD8; Double positive thymocytes (DP): CD4+CD8+; CD4 Single Positive thymocytes (SP): CD4+CD8TCRβ+Foxp3-GFP from thymus; and naïve CD4 T cells (Tn): CD4+TCRβ+CD62L+CD44Foxp3-GFP; resting Treg cells (rTreg): CD4+TCRβ+CD62L+CD44loFoxp3-GFP+; activated Treg cells (aTreg): CD4+TCRβ+CD62LCD44hiFoxp3-GFP+ from SLO. CNS2 and CNS0 are indicated by dashed lines. B. Conservation and positions of STAT5 motifs within CNS0. Multiple sequence alignment of the motifs with other placental mammals are shown. “.” indicates conserved base, “-” indicates deletion, and “*” indicates missing data. C. Tracks for STAT5 ChIP-seq showing the region surrounding the Foxp3 locus for ex vivo Treg cells (nTreg) and in vitro induced Treg cells (iTreg) stimulated with IL-2. Indicated peaks: CNS2, CNS0, the Foxp3 promoter, the Ppp1r3f promoter (STAT5RE2), and a non-conserved region (STAT5RE1). RE, response element. Data represent 3 biological replicates. D-F. Schematic of ChIP-qPCR experiment (D) and representative plots showing phosphorylation of STAT5 upon IL-2 stimulation of CD4+ Tn cells after 0, 12, and 24 hours of activation (E). Normalized ChIP-qPCR signals by input DNA for indicated regions after IL-2 stimulation at different time points after activation (F). Icos and Gm5069 refer to gene promoter regions. See STAR Methods for details. Plot shows means and SD, n = 3 per group. Data represent 2 independent experiments. G. Strategy for generating CNS0FL and CNS0Δ animals. CNS0 was defined as chr X: 7,570,674 – 7,571,274 (mm10). See STAR Methods for details. H-I. Representative plots (H) and summarized data (I) of the frequencies of Foxp3-GFP+ (Foxp3+) and CD25+Foxp3-GFP (CD25+) among CD4+CD8TCRβ+ cells from thymuses of 5- to 18-week-old CNS0FL or CNS0KO male littermates. Each point indicates 1 mouse and data are pooled from 3 independent experiments. Unpaired t-tests with correction for multiple comparisons using the Holm-Sidak method. p <0.01 **, <0.0001 ****. </P/>See also Figure S1.
Figure 2.
Figure 2.. CNS0 deficiency impairs Treg cell differentiation.
A-D. Frequencies of Foxp3-GFP+ (A) and CD25+Foxp3-GFP cells (B) among CD4+CD8 TCRβ+ cells from thymuses, and Foxp3-GFP+ among CD4+TCRβ+ cell from spleens (C) of CNS0Δ and CNS0FL male littermates of indicated ages. R2 for linear regression of log-transformed fluorescence intensities of CD25 and Foxp3-GFP among CD25+Foxp3-GFP+ CD4SP thymocytes (D). Each point indicates 1 mouse and data are pooled from 5 independent experiments, including a single experiment where mice of both genotypes from all ages were analyzed. E, F. Model of the effect of CNS0 deficiency on Treg cell induction and expansion in neonatal (E) and adult (F) mice. Cells with green nucleuses represent Treg cells and those with red membranes represent antigen experienced Tconv cells. Faded IL-2 indicates its consumption by Treg cells. Two-way ANOVA with Sidak test to correct for multiple comparisons. p >0.05 ns, <0.05 *, <0.01 **, <0.001 ***, <0.0001 ****. See also Figure S2.
Figure 3.
Figure 3.. IL-2 dependent role of CNS0 in initiating and sustaining Foxp3 expression.
A. Schematic of experiments shown in (B). See STAR Methods for details. B. Frequencies of Foxp3-GFP+ cells among Treg cell precursors (CD4+CD8Foxp3-GFP CD25+TCRβ+) sorted from the thymuses of 8-week-old CNS0FL or CNS0Δ male littermates incubated ex vivo with indicated amounts of IL-2 for 24 hours. Each point indicates 1 mouse and data are pooled from 2 independent experiments. C. Schematic of experiments shown in (D-E). See STAR Methods for details. D, E. Representative plots (D) and summarized data (E) of the frequencies of Foxp3-GFP+ cells among ex vivo stimulated mature CD4SP (CD4+CD8CD73Foxp3-GFPCD25 TCRβhiCD24lo) cells sorted from the thymuses of 5- to 6-week-old CNS0FL or CNS0Δ male littermates. Each point indicates 1 mouse and data are representative of 3 independent experiments. F. Schematic of experiments shown in (G, H). See STAR Methods for details. G, H. Summarized data of the frequencies of Foxp3 expression by in vitro induced Treg cells after additional 4 days of culture. Treg cells were generated from Tn cells (CD4+Foxp3-GFP CD62L+CD44TCRβ+) in the absence (G) or presence (H) of sodium ascorbate (ASC). Plots show means and SD, n = 3 per group. Data represent >3 independent experiments.

Unpaired t-tests with correction for multiple comparisons using the Holm-Sidak method. p <0.05 *, <0.01 **, <0.0001 ****. See also Figure S3.
Figure 4.
Figure 4.. Immune perturbation but no overt pathology in adult CNS0-deficient mice.
A, E, G. Frequencies of Foxp3-GFP+ cells (A) and CD44hiFoxp3-GFP (E) among CD4+TCRβ+ cells, and IFNγ+ cells among Foxp3-GFPCD4+TCRβ+ cells (G) in indicated tissues (pLN: pooled brachial, axillary, and inguinal lymph nodes; mLN: pooled mesenteric lymph nodes) from 8- to 10-week-old CNS0Δ and CNS0FL male littermates. Each point indicates 1 mouse and data are pooled from 2 independent experiments. B-D. Frequencies of CD44hiCD62L cells (B), CTLA-4 gMFI, (C) and frequencies of Ki67+ cells (D) among Treg cells in indicated tissues from 8- to 10-week-old CNS0Δ and CNS0FL male littermates. n=9 per group. F. Serum IgG2b quantification by ELISA of CNS0Δ and CNS0FL male littermates of indicated ages. Each point indicates 1 mouse. Data represent 2 independent experiments. H. Body weight of 8- to 10-week-old CNS0Δ and CNS0FL male littermates. Unpaired t-tests with correction for multiple comparisons using the Holm-Sidak method. p >0.05 ns, <0.05 *, <0.01 **, <0.001 ***, <0.0001 ****. See also Figure S4.
Figure 5.
Figure 5.. Increased cell-intrinsic activation partially compensates for CNS0-deficiency.
A. Schematic of the generation of bone marrow chimeric (BMC) mice analyzed in (B, S5A-C). See STAR Methods for details. B. Frequencies of Foxp3-GFP+ Treg cells among CD45.2+CD4+ T cells in indicated tissues (LN: pooled brachial, axillary, and inguinal lymph nodes; LPL: small intestine lamina propria; PP: Peyer’s patches) of CNS0FL or CNS0Δ BMC mice. Blue symbols indicate ratios of CNS0Δ to CNS0FL Treg cell frequencies. Each point indicates 1 mouse, and data are representative of 2 independent experiments. D, E. RNA-seq of CNS0Δ versus CNS0FL Treg cells sorted from the thymuses of 8-week-old CNS0Δ/WT and CNS0FL/WT female littermates. Cumulative distribution function plot of gene expression (log2 fold change, FC). All genes (black) and genes with increased (red) or decreased (blue) expresison in activated vs. resting Treg cells. p, one-tailed Kolmogorov-Smirnov test. E. Heatmap showing row Z-score normalized gene expression. Genes are restricted to those contained in the indicated gene sets (activated vs resting Treg) and significantly differentially expressed (adjusted p-value <0.05) between genotypes. F, G. RNA-seq of Treg cells sorted from the thymuses of 8-week-old CNS0FL and CNS0Δ male littermates. F. Cumulative distribution function plot of differentially expressed genes (log2 FC). All genes (black) and genes with increased (red) or decreased (blue) expresison in TCR-bearing vs. TCR-deleted Treg cells. p, one-tailed Kolmogorov-Smirnov test. G. Heatmap showing row Z-score normalized gene expression. Genes are restricted to those contained in the indicated gene sets (TCR-dependent genes) and significantly differentially expressed (adjusted p-value <0.05) between genotypes. (B) Unpaired t-tests with correction for multiple comparisons using the Holm-Sidak method. p >0.05 ns, <0.01 **, <0.001 ***, <0.0001 ****. (D, F) p, by one-tailed Kolmogorov-Smirnov test. See also Figure S5.
Figure 6.
Figure 6.. Increased TCR signaling drives thymic Treg cell differentiation in the absence of CNS0.
A-D. ATAC-seq of indicated populations sorted from the thymuses of 16-week-old CNS0FL and CNS0Δ male littermates. See STAR Methods for details. A. Enrichment (presence in target versus in background) of known TF motifs, determined by HOMER, in summit-centered peaks of OCRs significantly more accessible in CNS0Δ Treg cells. Top 20 are shown, all with q <0.05 and ranked by enrichment. B. K-means clustering of OCRs with significant differential accessibility in any pairwise comparison. Columns show individual samples and data are normalized by Z-scores per row. Right-hand columns indicate proportion of OCRs significantly more accessible in CNS0Δ Treg cells (left) or CNS0FL Treg cells (right) within each cluster. C. Enrichment (presence in target versus in background) of known TF motifs, determined by HOMER, in summit-centered peaks of OCRs in k-means cluster I. Top 20 are shown, all with q <0.05 and ranked by enrichment. Coloring indicates families of DNA-binding domains. D. K-means clustering of OCRs with significant differential accessibility between CNS0Δ and CNS0FL Treg cells. Columns show individual samples and data are normalized by Z-scores per row. E. Frequencies of Vβ5+ cells among indicated populations from the thymuses of 6- to 10-week-old CNS0FL and CNS0Δ male littermates. Each point indicates 1 mouse. Data are pooled from 2 experiments. F-H. Inverse Simpson index indicating the diversity intensity (F, G) and total unique TCR clones (H, I) of TCRβ (F, H) or TCRα (G, I) chain sequences from splenic Treg cells isolated from 6-week-old CNS0FL and CNS0Δ male mice. Each point indicates 1 mouse and data are from a single experiment. Unpaired t-tests with correction for multiple comparisons using the Holm-Sidak method. p >0.05 ns, <0.05 *, <0.01 **, <0.001 ***. See also Figures S6 and S7.
Figure 7.
Figure 7.. Genetic perturbation of Aire exacerbates autoimmunity in CNS0-deficient animals.
A. Representative images of hematoxylin and eosin stained slides. Arrows indicate aggregates of inflammatory cells and arrowheads circumscribe the inflammatory regions. Scale bars indicate 100 μm (lung, liver), 50 μm (salivary gland, small intestine, and adipose tissue), or 20 μm (eye). B. Histopathological scoring. Shading indicates mean score for each group (0–4) and p values denote two-way ANOVA with Sidak test to correct for multiple comparisons. C, D. Frequencies of CD44+CD62L cells among CD4+Foxp3-GFP T cells (C) and CD44+CD62L cells among CD8+ T cells (D). Unpaired t-tests with correction for multiple comparisons using the Holm-Sidak method. p >0.05 ns or blank (B), <0.05 *, <0.01 **, <0.001 ***, <0.0001 ****.

Similar articles

Cited by

References

    1. Anderson MS, Venanzi ES, Klein L, Chen Z, Berzins SP, Turley SJ, von Boehmer H, Bronson R, Dierich A, Benoist C, et al. (2002). Projection of an immunological self shadow within the thymus by the aire protein. Science 298, 1395–1401. - PubMed
    1. Aschenbrenner K, D’Cruz LM, Vollmann EH, Hinterberger M, Emmerich J, Swee LK, Rolink A, and Klein L (2007). Selection of Foxp3+ regulatory T cells specific for self antigen expressed and presented by Aire+ medullary thymic epithelial cells. Nat. Immunol. 8, 351–358. - PubMed
    1. Bagadia P, Huang X, Liu T-T, Durai V, Grajales-Reyes GE, Nitschké M, Modrusan Z, Granja JM, Satpathy AT, Briseño CG, et al. (2019). An Nfil3-Zeb2-Id2 pathway imposes Irf8 enhancer switching during cDC1 development. Nat. Immunol. 20, 1174–1185. - PMC - PubMed
    1. Bending D, Prieto Martín P, Paduraru A, Ducker C, Marzaganov E, Laviron M, Kitano S, Miyachi H, Crompton T, and Ono M (2018). A timer for analyzing temporally dynamic changes in transcription during differentiation in vivo. J. Cell Biol. 217, 2931–2950. - PMC - PubMed
    1. Björses P, Aaltonen J, Horelli-Kuitunen N, Yaspo ML, and Peltonen L (1998). Gene defect behind APECED: a new clue to autoimmunity. Hum. Mol. Genet. 7, 1547–1553. - PubMed

Publication types

MeSH terms

Substances