. 2021 Jun 3;81(11):2361-2373.e9.
doi: 10.1016/j.molcel.2021.03.027. Epub 2021 Apr 9.

Shutoff of host transcription triggers a toxin-antitoxin system to cleave phage RNA and abort infection

Affiliations

Shutoff of host transcription triggers a toxin-antitoxin system to cleave phage RNA and abort infection

Chantal K Guegler et al. Mol Cell. .

Abstract

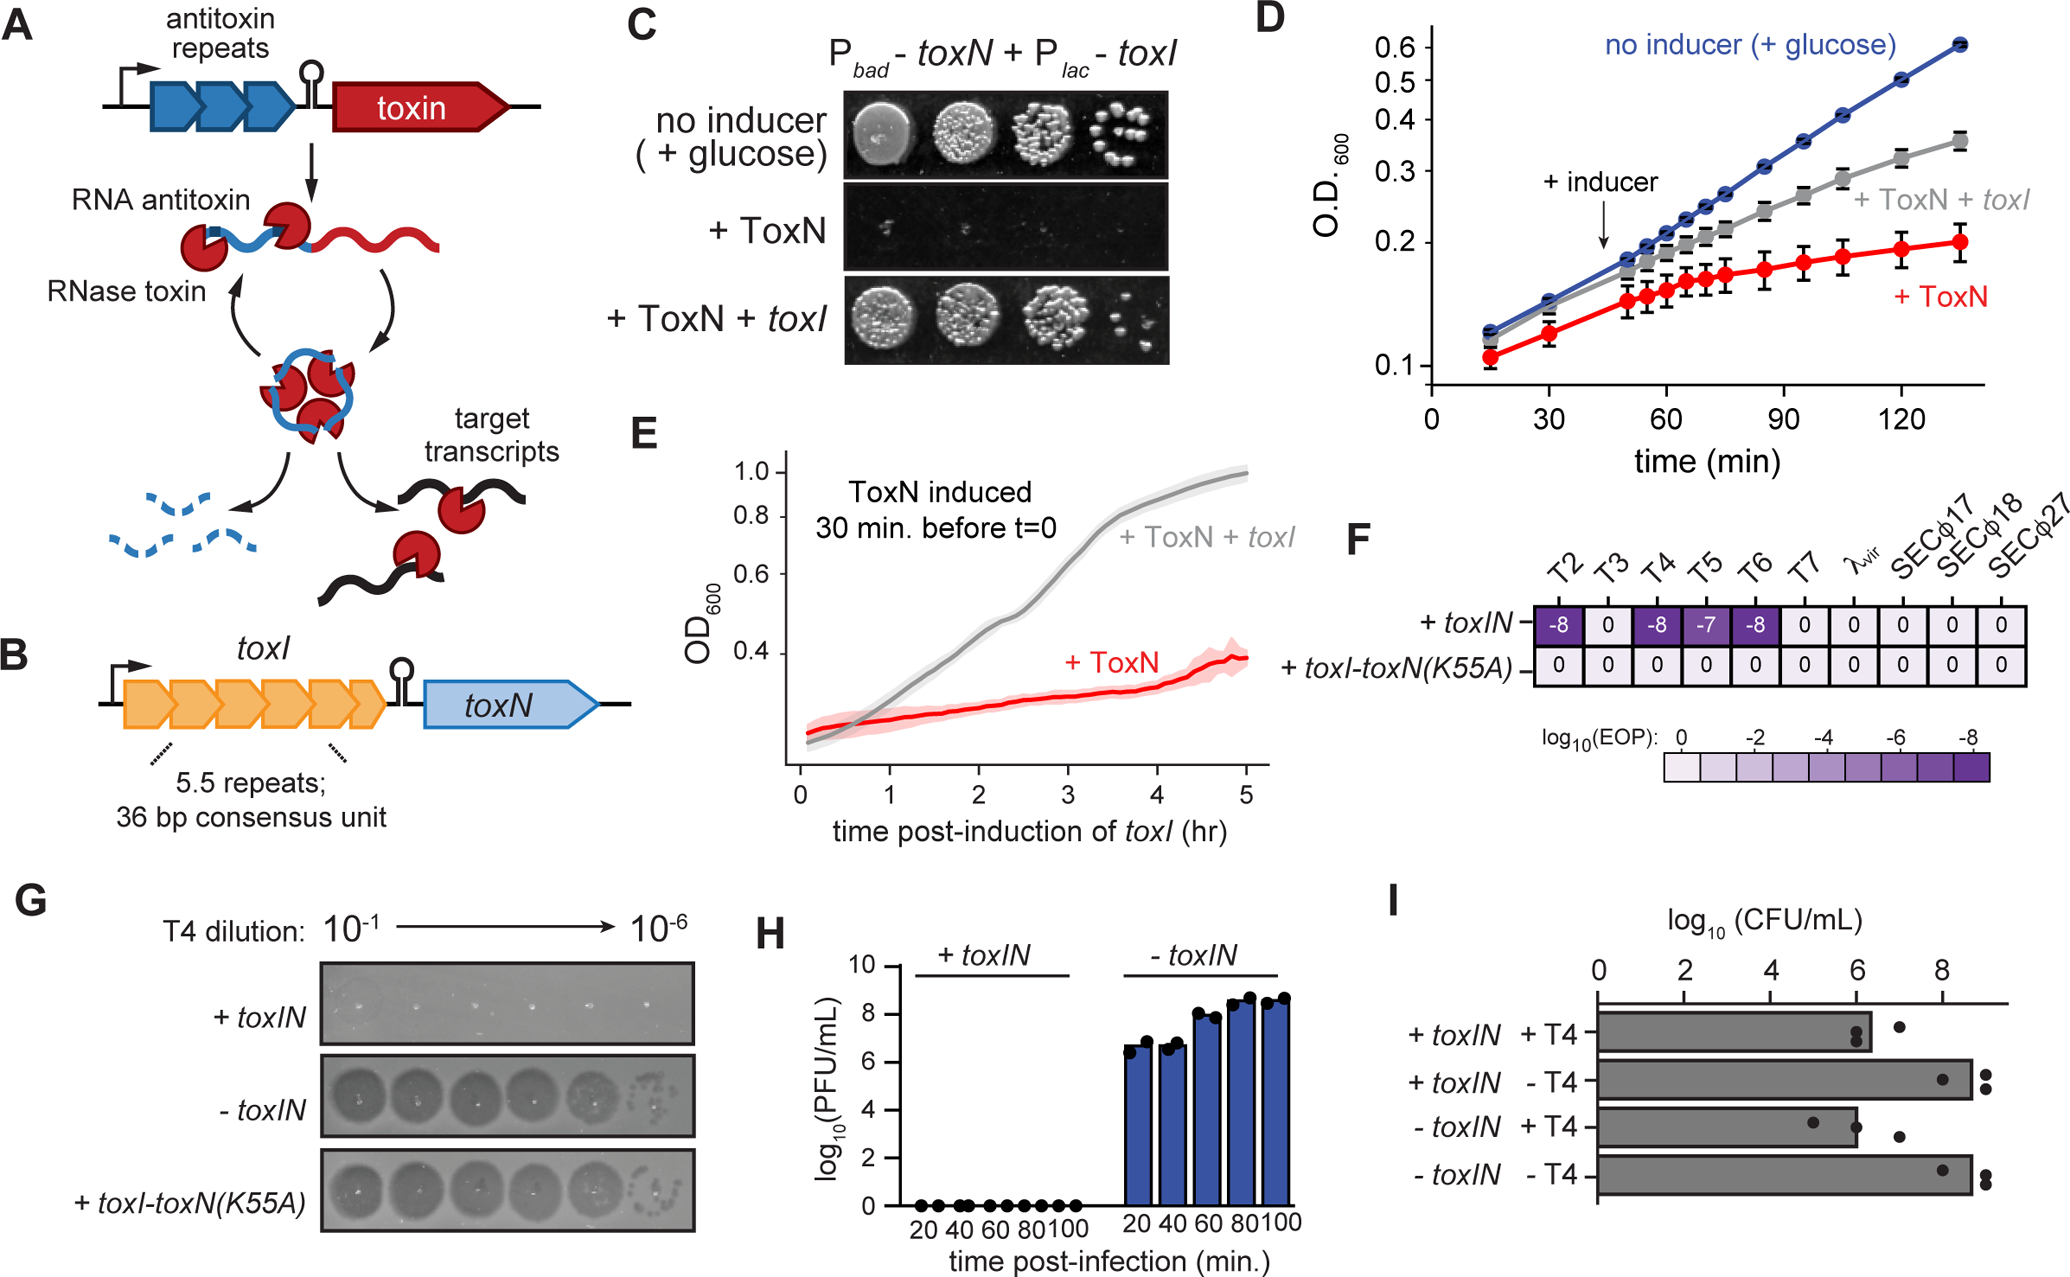
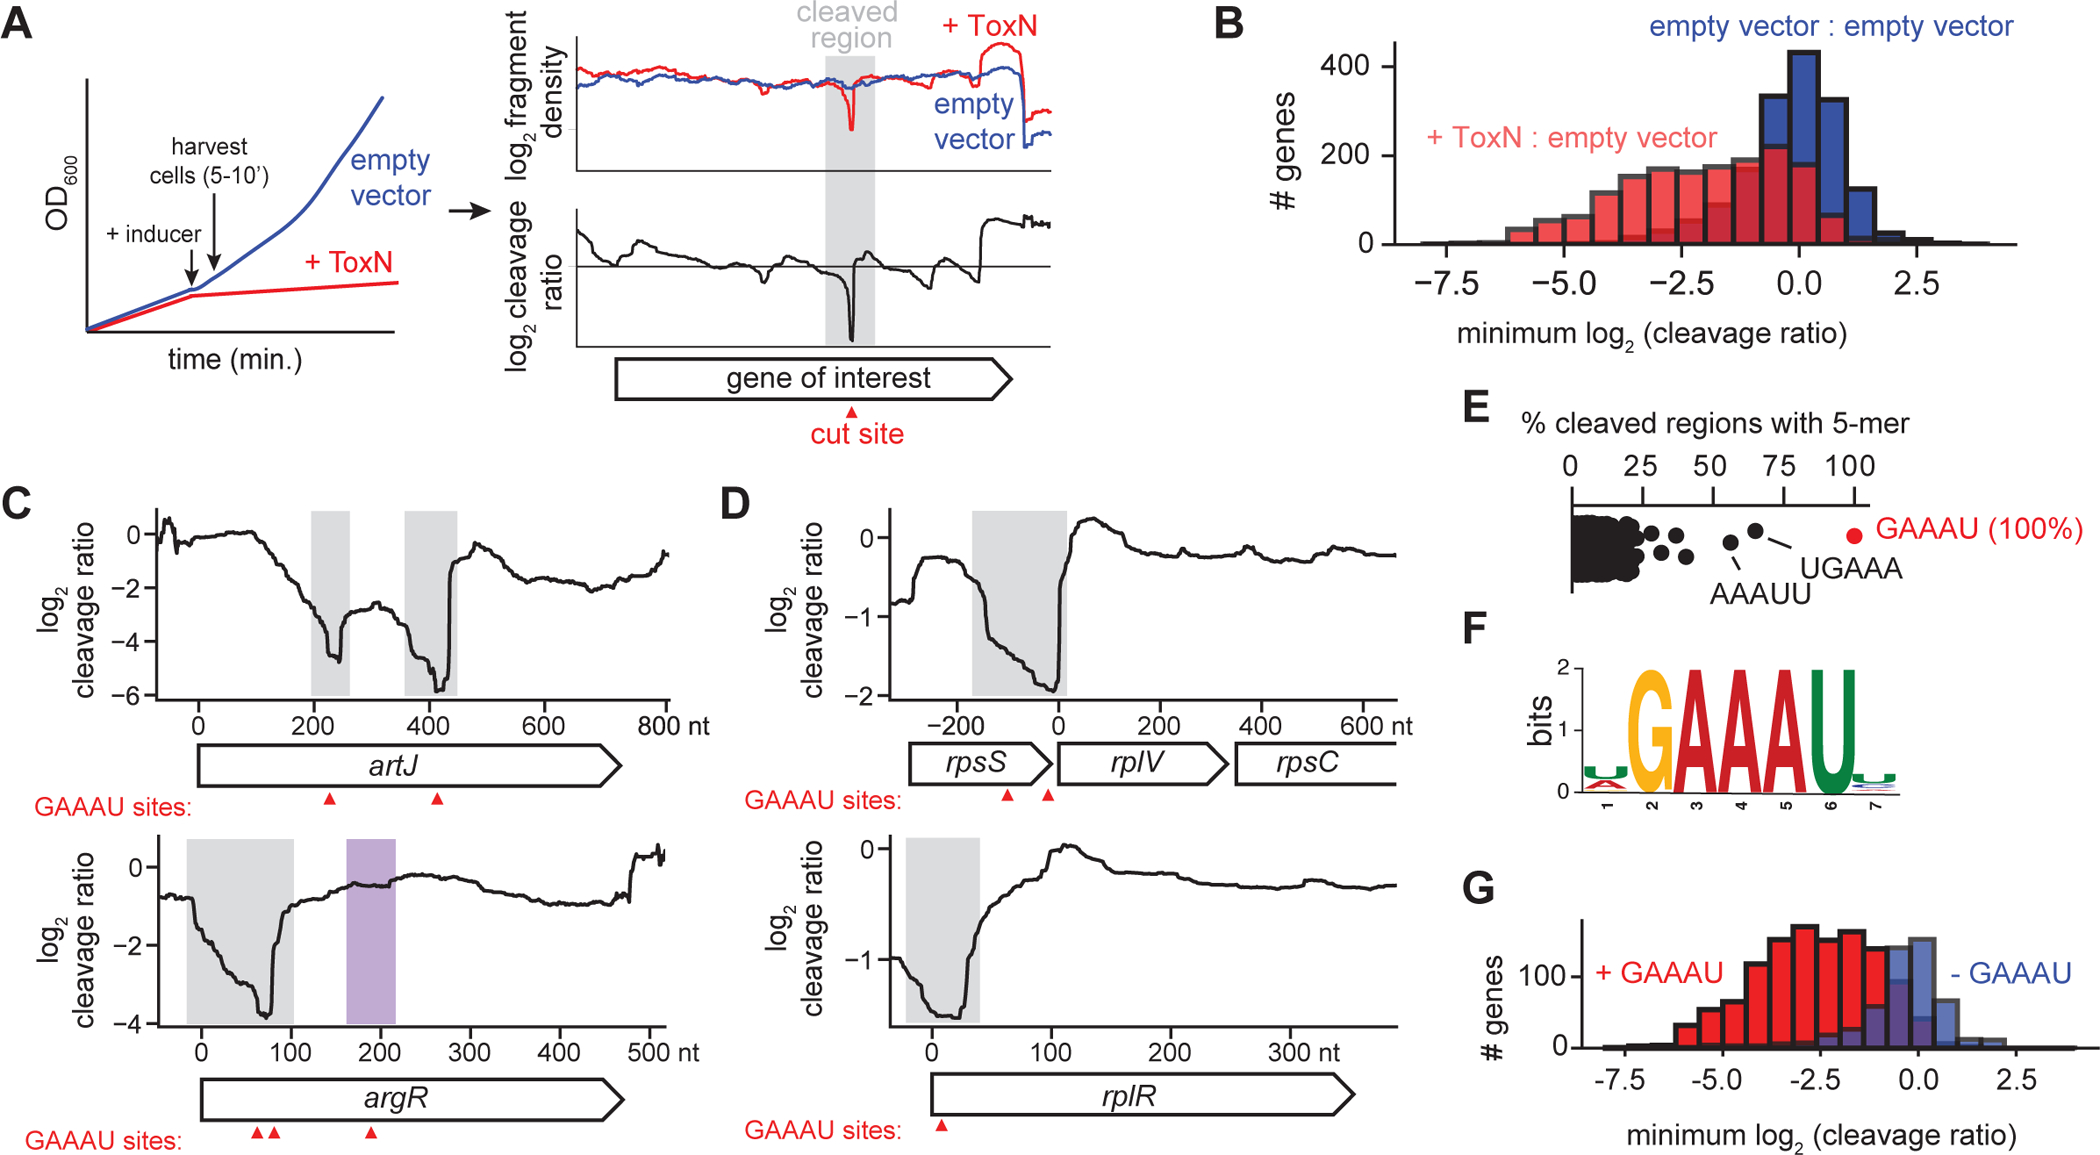
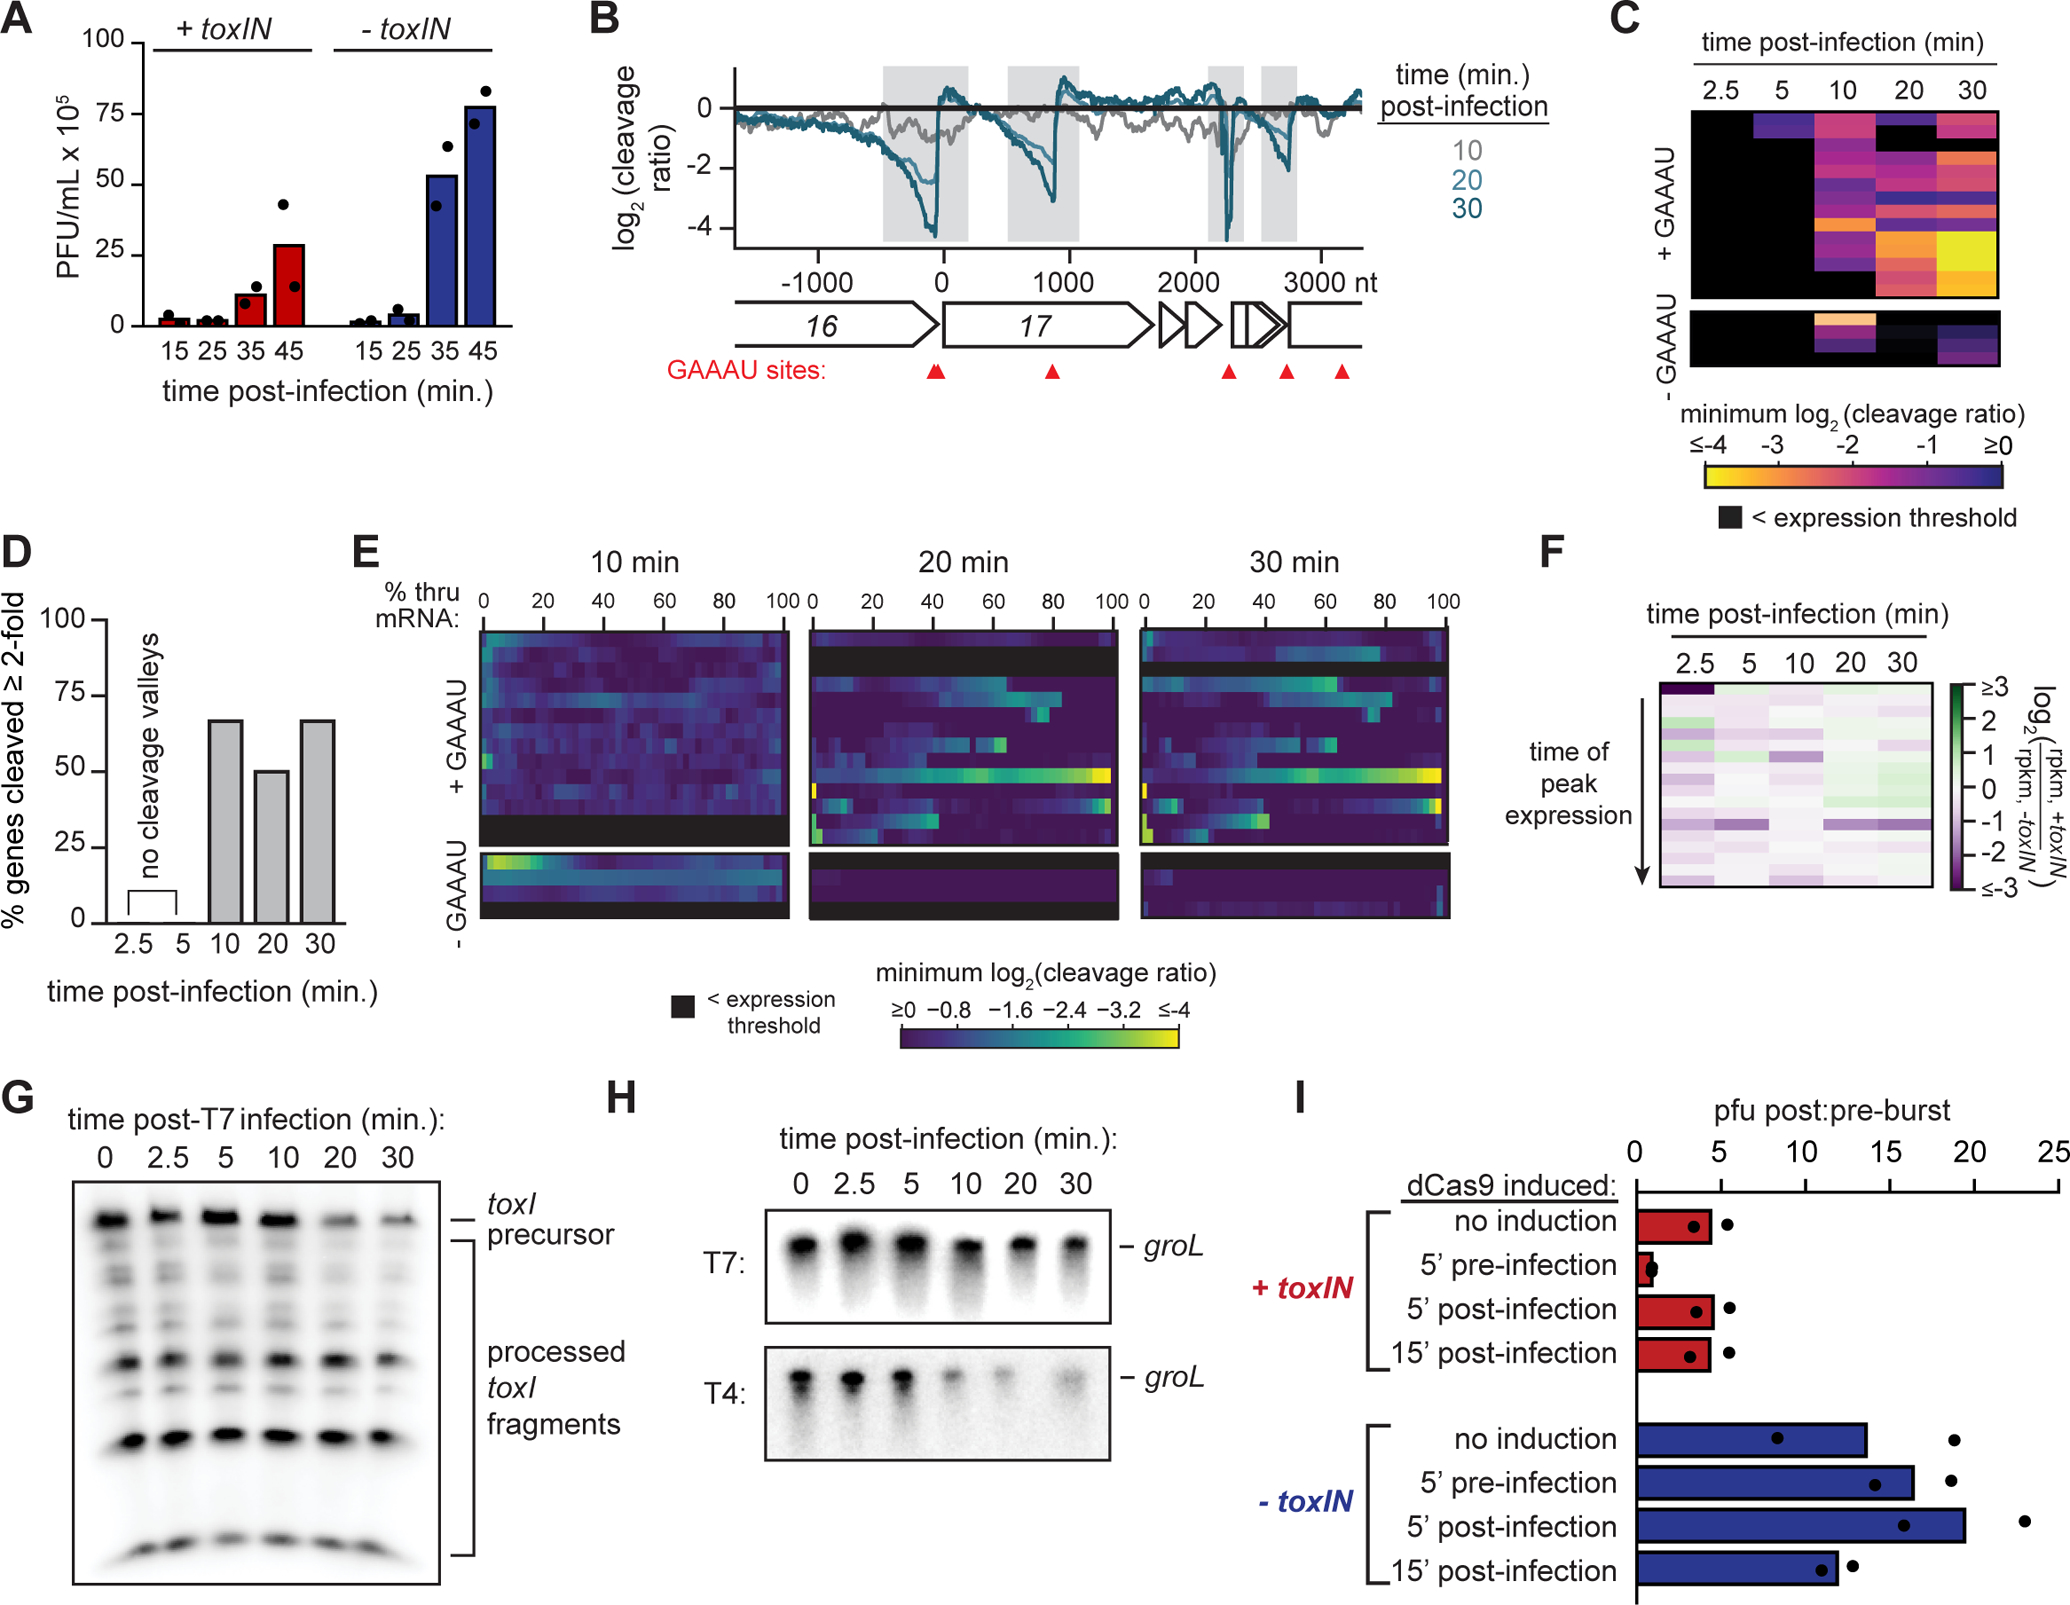
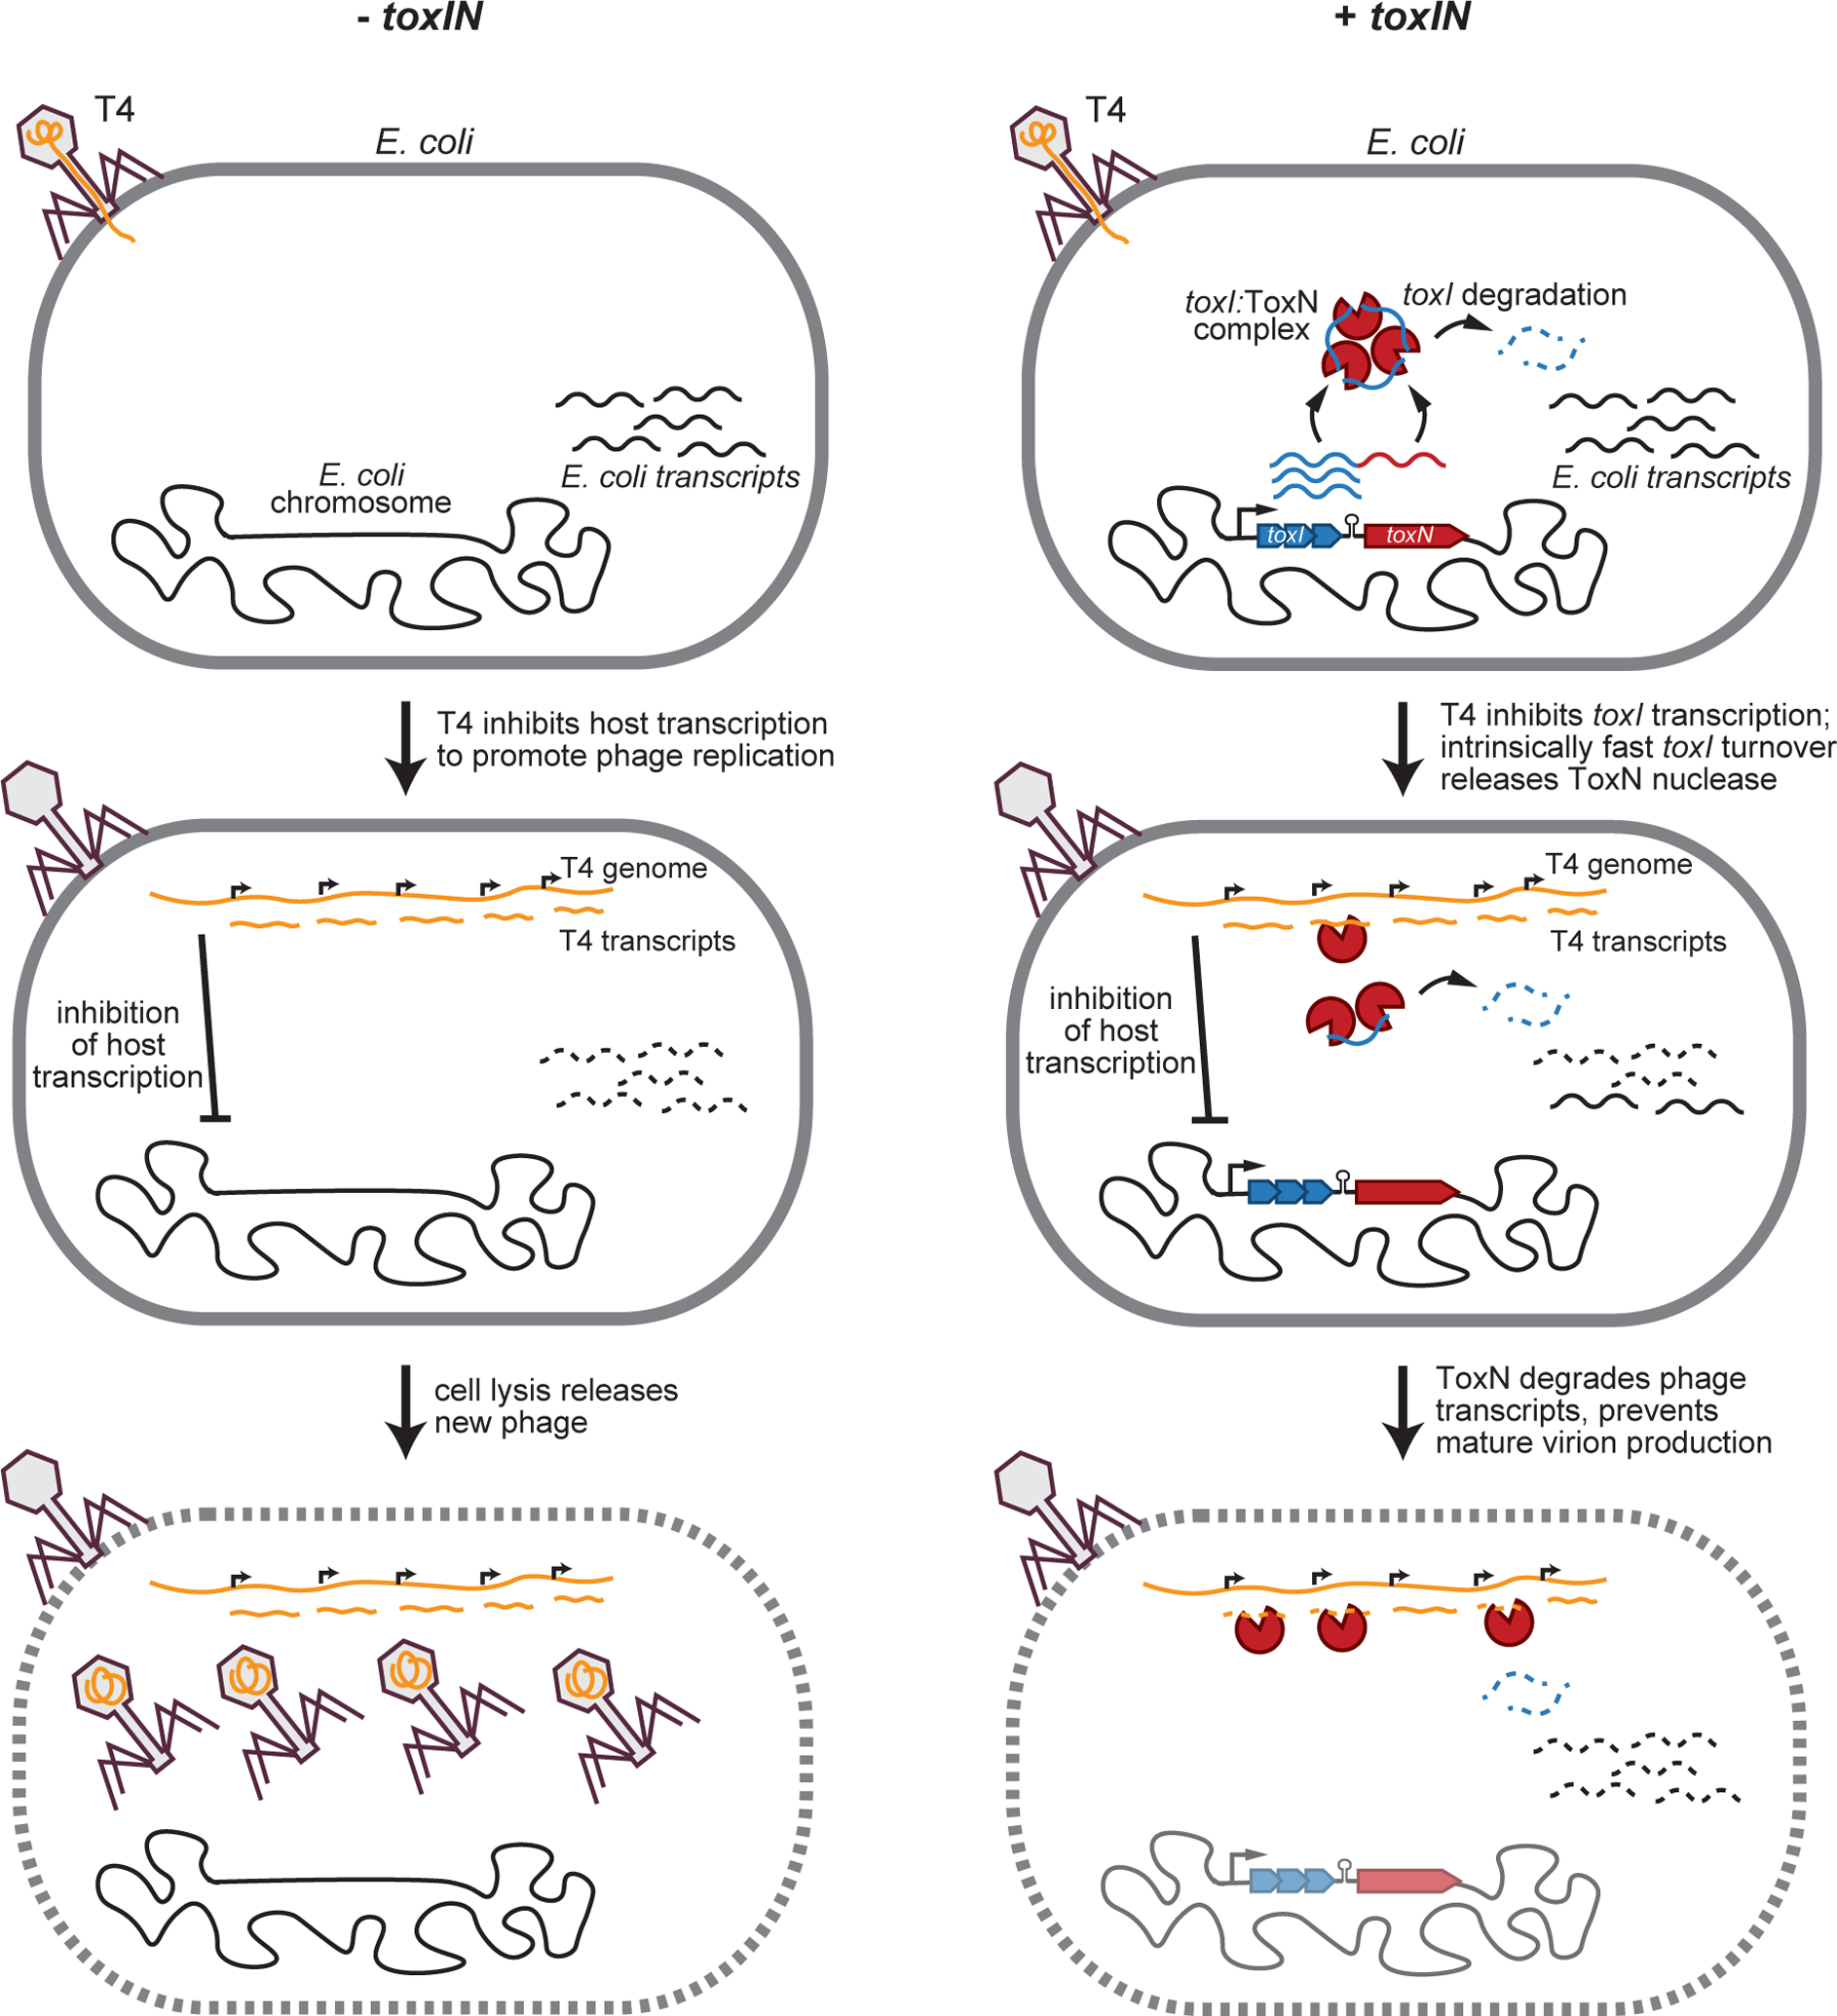
Toxin-antitoxin (TA) systems are widespread in bacteria, but their activation mechanisms and bona fide targets remain largely unknown. Here, we characterize a type III TA system, toxIN, that protects E. coli against multiple bacteriophages, including T4. Using RNA sequencing, we find that the endoribonuclease ToxN is activated following T4 infection and blocks phage development primarily by cleaving viral mRNAs and inhibiting their translation. ToxN activation arises from T4-induced shutoff of host transcription, specifically of toxIN, leading to loss of the intrinsically unstable toxI antitoxin. Transcriptional shutoff is necessary and sufficient for ToxN activation. Notably, toxIN does not strongly protect against another phage, T7, which incompletely blocks host transcription. Thus, our results reveal a critical trade-off in blocking host transcription: it helps phage commandeer host resources but can activate potent defense systems. More generally, our results now reveal the native targets of an RNase toxin and activation mechanism of a phage-defensive TA system.

Keywords: E. coli; T4 phage; bacterial transcription; endoribonuclease; phage defense; toxin-antitoxin.


Conflict of interest statement

Declaration of interests The authors declare no competing interests.

Figures

Fig. 1.
Fig. 1.. E. coli toxIN is a type III toxin-antitoxin system
(A-B) Schematic summarizing key properties of type III TA systems (A) and E. coli toxIN (B). (C) Representative plating assay showing toxI rescue of ToxN toxicity. Plasmids harboring toxN and toxI under arabinose- and IPTG-inducible promoters, respectively, were transformed into E. coli MG1655. ToxN, ToxN and toxI, or neither were induced as indicated; glucose represses transcription from both promoters. (D) Growth curve showing toxI rescue of ToxN toxicity following simultaneous induction of both. (E) Growth curve showing toxI rescue of ToxN toxicity following ToxN induction for 30 min (red curve in Fig. 1D). Data are the average of two technical replicates each of three biological replicates, with shaded areas indicating S.D. (F) Efficiency of plaquing for +toxIN and +toxI toxN(K55A) cells infected with a panel of coliphages. Data are the mean of three biological replicates rounded to the nearest order of magnitude. (G) Serial dilution plaque assays for T4 spotted on +toxIN, −toxIN, and +toxI toxN(K55A) cells. (H) Plaque-forming units (PFU)/mL of T4 in +toxIN and −toxIN cells (MOI = 0.01) at 20, 40, 60, 80 and 100 min post-infection. Data are the mean of two biological replicates, with individual datapoints indicated. (I) Colony-forming units (CFU)/mL of +toxIN and −toxIN cells infected with T4 (MOI = 5) compared to uninfected cells treated identically. Data are the mean of three biological replicates rounded to the nearest order of magnitude, with individual data points indicated. Also see Fig. S1.
Fig. 2.
Fig. 2.. ToxN is a sequence-specific endoribonuclease
(A) Schematic overview of RNA-seq approach for determining ToxN cleavage sites. (B) Histograms showing the distribution of the minimum cleavage ratios within well-expressed coding regions (n = 1,717) in E. coli when comparing cells overexpressing ToxN to those harboring an empty vector (red) or comparing two independent replicates harboring an empty vector (blue). (C-D) Cleavage profiles for four well-cleaved E. coli transcripts. Sites of GAAAU motifs are indicated with red triangles. Well-cleaved instances of GAAAU are highlighted in gray, and a poorly cleaved region containing the motif is highlighted in purple. (E) Percent of well-cleaved regions containing each possible 5-mer. (F) Sequence logo for well-cleaved regions. (G) Histograms showing the distribution of the minimum cleavage ratios within well-expressed coding regions in E. coli with (red, n = 1,195) and without (blue, n = 522) the ToxN motif. Also see Fig. S2.
Fig. 3.
Fig. 3.. ToxN aborts T4 infection via widespread cleavage of phage mRNAs
(A) Plot showing the fraction of total RNA-seq signal coming from host (E. coli) and phage (T4) mRNAs in +toxIN and −toxIN cells at the indicated times post-infection. Data are the mean of two biological replicates. (B) Heatmap showing the ratio of log2(rpkm) for each T4 transcript at each timepoint post-infection in +toxIN cells to that in −toxIN cells. Each row corresponds to an individual gene, and genes are ordered based on their time of peak expression in the −toxIN dataset (see Fig. S3C). (C) Top: Cleavage profile for the T4 gene dda at 5, 10, 20, and 30 min post-infection. GAAAU motifs are indicated with red triangles and cleaved regions with gray bars. Bottom: Heat map showing the minimum log2 (cleavage ratio) for 50 equally-sized regions in dda at 5, 10, 20, and 30 min post-infection. (D) Heat map showing the minimum log2 (cleavage ratio) in every T4 transcript at 2.5, 5, 10, 20, and 30 min post-infection. Each row corresponds to an individual gene, and genes are ordered based on their time of peak expression during infection of −toxIN cells. Transcripts not well-expressed at a given timepoint are indicated in black. (E) Bar graph quantifying the percent of well-expressed T4 transcripts cleaved ≥ 2-fold in both RNA-seq replicates at 2.5, 5, 10, 20 and 30 min post-infection. Note that at 2.5 and 5 min post-infection, no T4 genes were cleaved. (F) Heat map, ordered as in (B), but showing the minimum log2 (cleavage ratio) for 50 equally-sized regions in every T4 transcript at 2.5, 5, 10, 20, and 30 min post-infection. (G) Percent of well-cleaved regions in T4 transcripts 20 and 30 min post-infection that contain each possible 5-mer. (H-I) Cleavage profiles for ompC (H) and ompF (I) following ToxN overexpression (green) and post-T4 infection (purple). (J) Pulse-labeling of T4 proteins produced during the indicated times post-infection. Also see Fig. S3.
Fig. 4.
Fig. 4.. ToxN is activated by transcription shutoff of toxIN
(A) Schematic overview of three models for ToxN activation during T4 infection. (B) Northern blot of toxI RNA using a probe complementary to a single toxI repeat (top) and Western blot of ToxN-His6 using an anti-His6 antibody (bottom) during T4 infection (MOI = 5, left) and rif treatment (300 μg/mL, right). (C) Schematic overview of the rif growth recovery experiment in (D). (D) Growth curves for +toxIN and −toxIN cells following rif treatment for 30 min. Data are the mean of two technical replicates each of three biological replicates, and shaded areas indicate the S.D. Estimated lag times are reported in parentheses. (E) Cleavage profiles for two E. coli transcripts at the times indicated following addition of rif (300 μg/mL). GAAAU motifs are indicated with red triangles. (F) Growth curves before and after CRISPRi-mediated shutoff of the toxIN promoter. (G) Schematic overview of toxIN rescue experiments shown in (H). (H) Serial dilution plaque assays for T4 on +toxIN cells co-transformed with plasmids encoding toxI under the control of the indicated T4 promoter. Also see Fig. S4.
Fig. 5.
Fig. 5.. Complete transcription shutoff of toxIN is necessary for ToxN-mediated defense.
(A) Plaque-forming units (PFU)/mL of T7 in +toxIN and −toxIN cells (MOI = 0.01) at 15, 25, 35, and 45 min post-infection. Data are the mean of two biological replicates, with individual datapoints indicated. (B) Cleavage profile for the region surrounding the T7 gene 17 at 10, 20 and 30 min post-infection. (C) Heat map showing the minimum log2 (cleavage ratio) for every T7 mRNA at 2.5, 5, 10, 20, and 30 min post-infection. Each row corresponds to an individual mRNA, and mRNAs are ordered based on their time of peak expression during infection of −toxIN cells (see Fig. S5G). (D) Bar graph quantifying the percent of well-expressed T4 mRNAs cleaved ≥ 2-fold in both RNA-seq replicates at 2.5, 5, 10, 20 and 30 min post-infection. (E) Heat maps, ordered as in (C), showing the minimum log2 (cleavage ratio) for 50 equally-sized regions in every T7 mRNA at 2.5, 5, 10, 20, and 30 min post-infection. (F) Heatmap showing the ratio of log2(rpkm) for each T7 mRNA at each timepoint post-infection in +toxIN cells to that in −toxIN cells. Each row corresponds to an individual mRNA, and mRNAs are ordered based on their time of peak expression in the −toxIN dataset (Fig. S5G). (G) Northern blot of toxI RNA using a probe complementary to a single toxI repeat during T7 infection (MOI = 5). (H) Northern blots of groL during T7 infection (top) and T4 infection (bottom) in −toxIN cells. (I) Ratio of plaque-forming units (PFU)/mL of T7 in +toxIN and −toxIN cells (MOI = 0.01) 45 and 15 min post-infection, following induction of dCas9 targeting the toxIN promoter at the timepoints indicated. Data are the mean of two biological replicates, with individual datapoints indicated. Also see Fig. S5.
Fig. 6.
Fig. 6.. Model for type III TA-mediated phage defense.
Model for T4 infection in −toxIN and +toxIN cells. (Left) Following infection of −toxIN cells, T4 inhibits host transcription to promote phage replication and the production of new phage particles that are released by eventual cell lysis. (Right) Following infection of +toxIN cells, T4 inhibits host transcription, including of toxIN. Because toxI is more labile than ToxN and toxI:ToxN complexes dissociate rapidly, free ToxN ribonuclease accumulates by ~10 min post-infection. ToxN then degrades phage transcripts, preventing the production of new T4 virions. Because T4 infection disrupts the host cell membrane and chromosome, the host cell does not survive but uninfected neighbors do. Also see Fig. S6.

Similar articles

Cited by

References

    1. Blower TR, Pei XY, Short FL, Fineran PC, Humphreys DP, Luisi BF, and Salmond GPC (2011). A processed noncoding RNA regulates an altruistic bacterial antiviral system. Nat Struct Mol Biol 18, 185–190. - PMC - PubMed
    1. Blower TR, Short FL, Rao F, Mizuguchi K, Pei XY, Fineran PC, Luisi BF, and Salmond GPC (2012). Identification and classification of bacterial Type III toxin–antitoxin systems encoded in chromosomal and plasmid genomes. Nucleic Acids Res 40, 6158–6173. - PMC - PubMed
    1. Blower TR, Chai R, Przybilski R, Chindhy S, Fang X, Kidman SE, Tan H, Luisi BF, Fineran PC, and Salmond GPC (2017). Evolution of Pectobacterium Bacteriophage ΦM1 To Escape Two Bifunctional Type III Toxin-Antitoxin and Abortive Infection Systems through Mutations in a Single Viral Gene. Appl Environ Microb 83, e03229–16. - PMC - PubMed
    1. Brunovskis I, and Summers WC (1971). The process of infection with coliphage T7 V. Shutoff of host RNA synthesis by an early phage function. Virology 45, 224–231. - PubMed
    1. Chen Z, and Schneider TD (2005). Information theory based T7-like promoter models: classification of bacteriophages and differential evolution of promoters and their polymerases. Nucleic Acids Res 33, 6172–6187. - PMC - PubMed

Publication types

MeSH terms

Substances