. 2021 Aug 5;28(8):1362-1379.e7.
doi: 10.1016/j.stem.2021.03.004. Epub 2021 Apr 9.

Organoid modeling of Zika and herpes simplex virus 1 infections reveals virus-specific responses leading to microcephaly

Affiliations

Organoid modeling of Zika and herpes simplex virus 1 infections reveals virus-specific responses leading to microcephaly

Veronica Krenn et al. Cell Stem Cell. .

Abstract

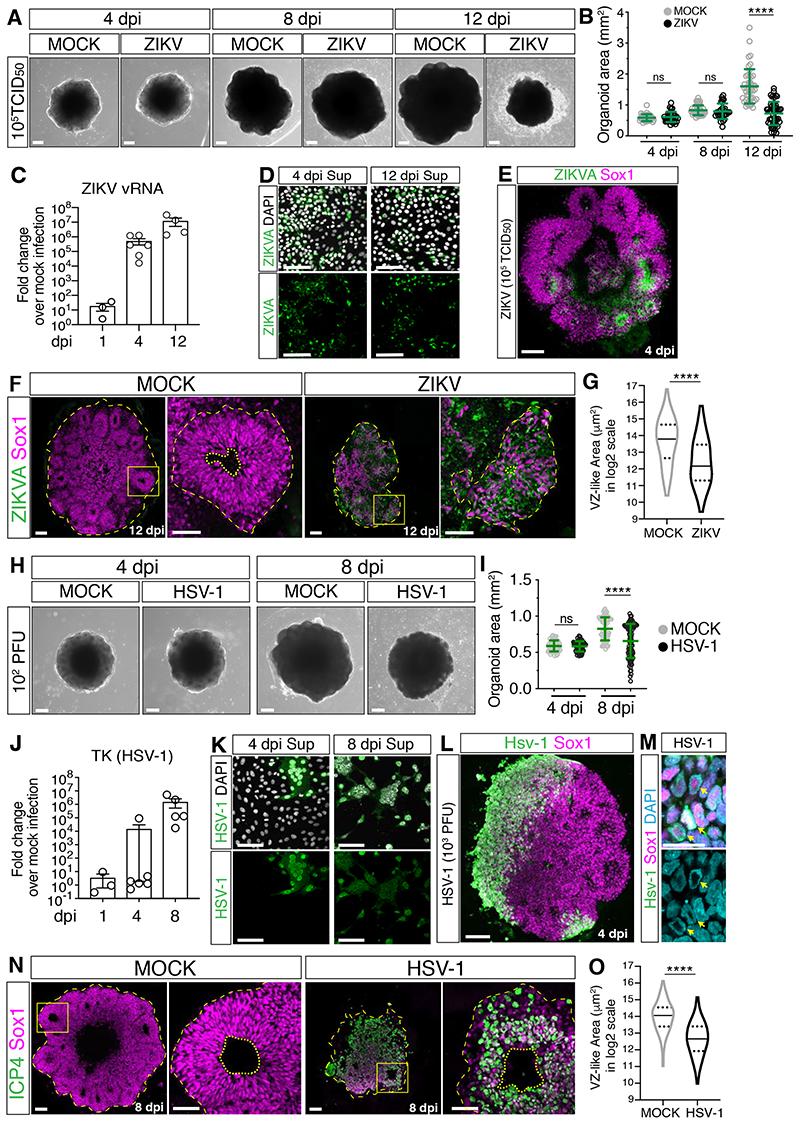
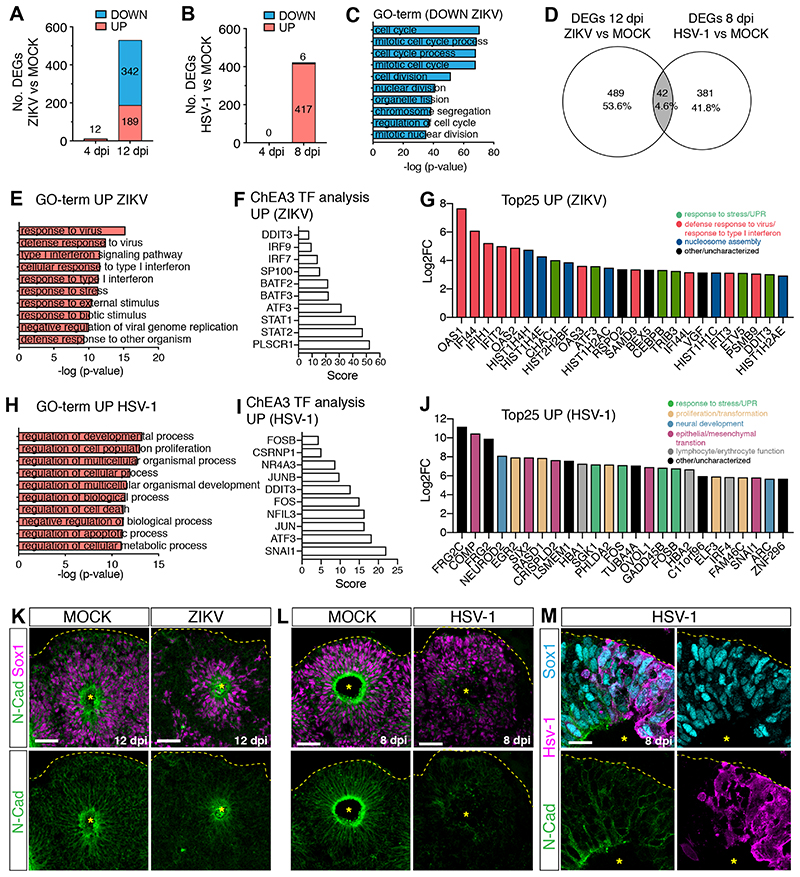
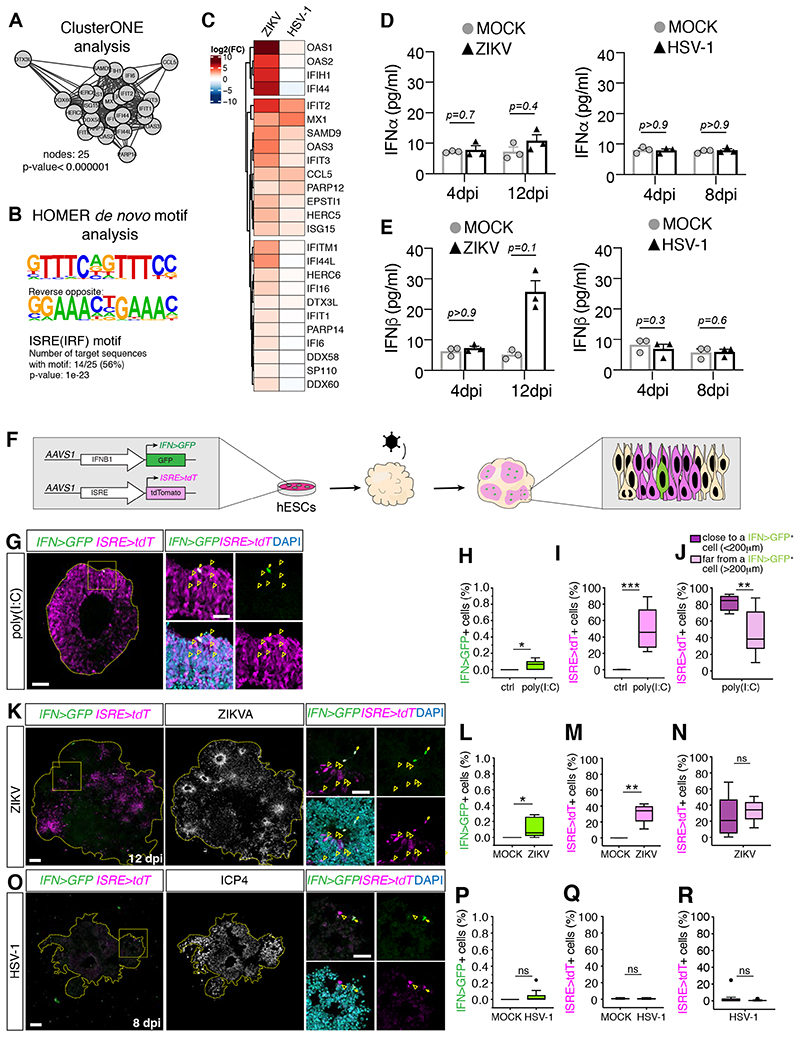
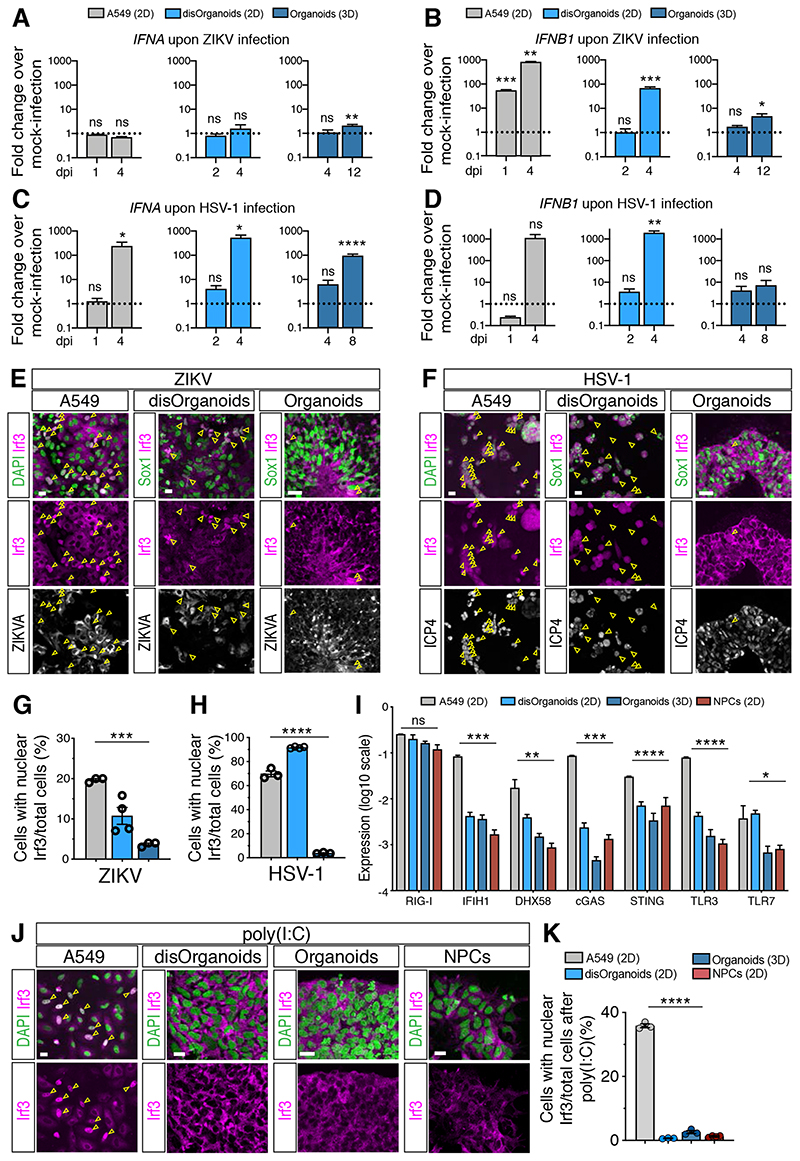
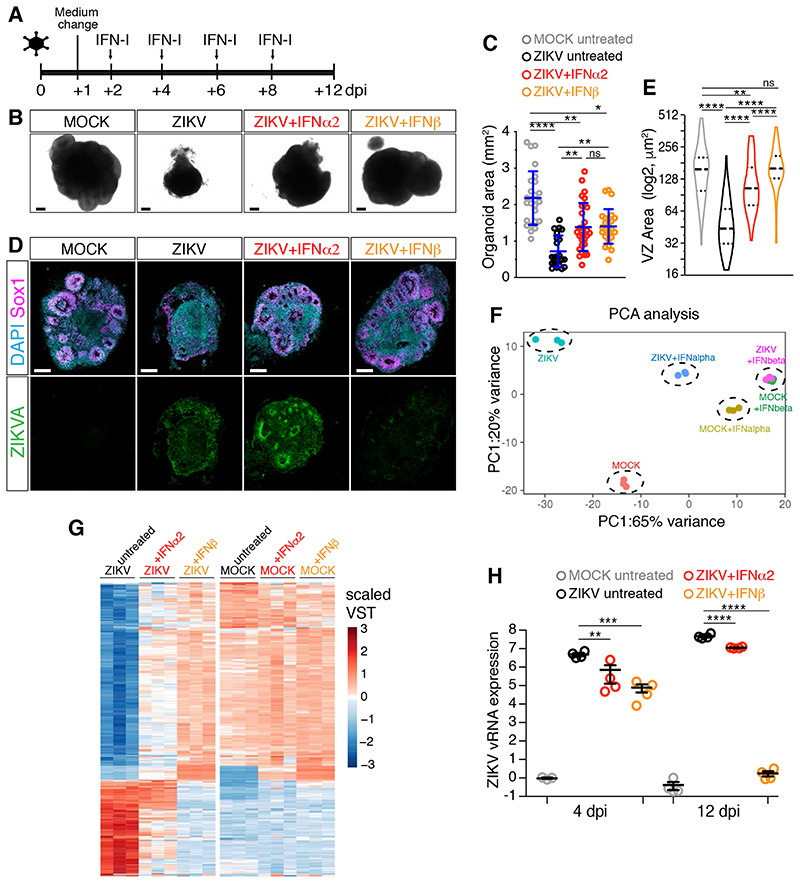
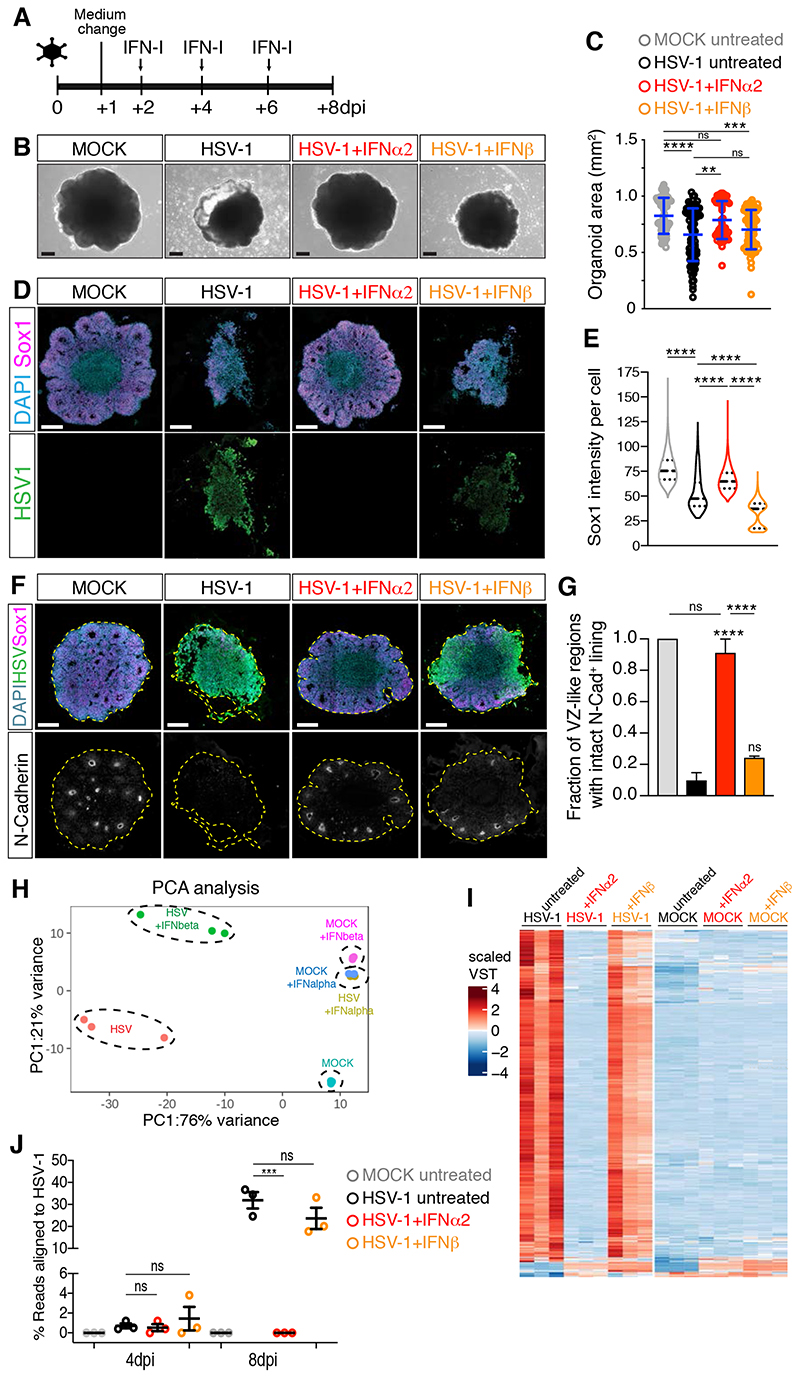
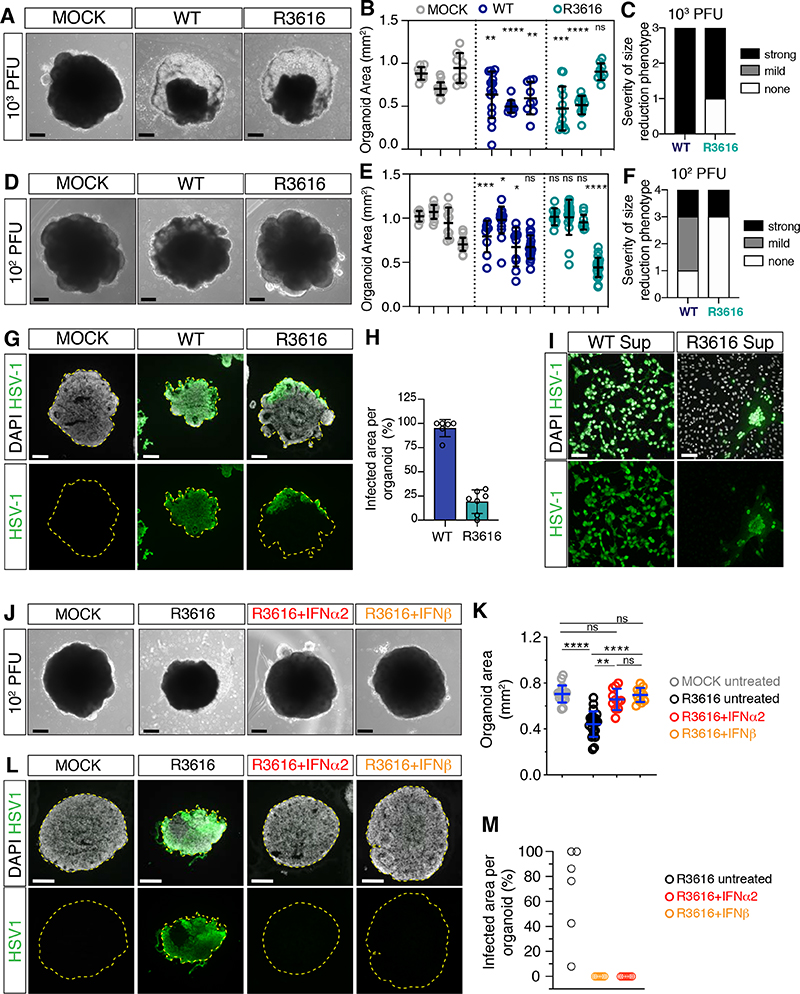
Viral infection in early pregnancy is a major cause of microcephaly. However, how distinct viruses impair human brain development remains poorly understood. Here we use human brain organoids to study the mechanisms underlying microcephaly caused by Zika virus (ZIKV) and herpes simplex virus (HSV-1). We find that both viruses efficiently replicate in brain organoids and attenuate their growth by causing cell death. However, transcriptional profiling reveals that ZIKV and HSV-1 elicit distinct cellular responses and that HSV-1 uniquely impairs neuroepithelial identity. Furthermore, we demonstrate that, although both viruses fail to potently induce the type I interferon system, the organoid defects caused by their infection can be rescued by distinct type I interferons. These phenotypes are not seen in 2D cultures, highlighting the superiority of brain organoids in modeling viral infections. These results uncover virus-specific mechanisms and complex cellular immune defenses associated with virus-induced microcephaly.

Keywords: Zika virus; brain organoids; herpes simplex virus; innate immune response; interferons; microcephaly; neural progenitors; neuroepithelial polarity.


Conflict of interest statement

Declaration of interests J.A.K. is inventor on a patent describing cerebral organoid technology and co-founder and scientific advisory board member of a:head bio AG.

Figures

Figure 1
Figure 1. ZIKV and HSV-1 infections impair organoid growth
A-B) Images (scale bars 200 μm) and area measurements of organoids exposed to ZIKV or MOCK-treated. Values are mean ± SD and represent individual organoids (p=0.7886 4 dpi; p=0.3190 8 dpi; **** is p<0.0001; Mann-Whitney test). TCID50, mean tissue culture infectious dose. C) RT-qPCR analysis of ZIKV viral RNA (vRNA) in organoids exposed to ZIKV. Values are mean ± SEM (p=0.1 1 dpi; p=0.0022 4 dpi; p=0.0286 12 dpi; Mann-Whitney test over age-matched MOCK-treated). D) Immunostaining of Vero cells (scale bars 100 μm) incubated with supernatants (sup) of ZIKV- infected organoids. ZIKVA, ZIKA Virus Antigen. E-G) Immunostaining (scale bars are 100 μm) of organoids exposed to ZIKV or MOCK-treated. Dashed lines indicate organoid contour based on DAPI signal (not shown). Insets in F (scale bars 50 μm) show a magnified view of the ventricular zone (VZ)-like structures (dashed lines) and their lumens (dotted lines). Violin plots indicate median and quartiles (n=129 regions from 11 MOCK, n=109 from 13 ZIKV organoids from 3 experiments; **** is p<0.0001; Mann-Whitney test). H-I) Images (scale bars 200 μm) and area measurements of organoids exposed to HSV-1 (102 PFU) or MOCK-treated. Values are mean ± SD and represent individual organoids (p=0.6625 4 dpi; **** is p<0.0001; Mann-Whitney test). J) RT-qPCR analysis of HSV-1 gene Thymidine Kinase (TK) in organoids exposed to HSV-1 (102 PFU). Values are mean ± SEM (p>0.9999 1 dpi; p=0.4004 4 dpi; p=0.0079 8 dpi; Mann-Whitney test over age-matched MOCK-treated). K) Immunostaining of Vero cells (scale bars 100 μm) incubated with supernatants (sup) from HSV- 1-infected organoids (102 PFU). L-M) Immunostaining (scale bars 100 μm in L, 20 μm in M) of organoids exposed to HSV-1 (103 PFU) and analyzed at 4 dpi. Arrows indicate chromatin localization (marked by DAPI) at the nuclear periphery. N-O) Immunostaining (scale bars 100 μm) of organoids exposed to HSV-1 (102 PFU) or MOCK- treated. Dashed lines indicate organoid contour based on DAPI signal (not shown). Insets (scale bars 50 μm) show a magnified view of ventricular zone (VZ)-like structures (dashed lines) around lumens (dotted lines). Inset from HSV-1 samples underwent a 180° rotation. Violin plots indicate median and quartiles (n=146 regions from 15 MOCK, n=69 from 16 HSV organoids from 3 experiments; **** is p<0.0001, Mann-Whitney test). ICP4, infected cell polypeptide 4 protein of HSV-1. ns, non-significant; dpi, days post-infection. See also Figure S1, Table S1 and S2.
Figure 2
Figure 2. ZIKV and HSV-1 infections elicit distinct transcriptional responses
A-B) Graphs showing the number of differentially expressed genes (DEGs) in virus-infected organoids. C) Top 10 Gene Ontology (GO)-terms of downregulated genes (log2FoldChange <1) in ZIKV vs. MOCK-exposed organoids (12 dpi). D) Venn diagram showing limited overlap between the two datasets. E and H) Top 10 GO-terms of upregulated genes (log2FoldChange >2) in virus-infected organoids (12 dpi in E, 8 dpi in H). F and I) Top 10 results of ChEA3 transcription factor (TF) analysis performed on upregulated genes. G and J) Expression of the top 25 upregulated genes in ZIKV-infected organoids (12 dpi, in G) or in HSV-1-infected organoids (8 dpi, in J). FC, fold change. K-M) Immunostaining (scale bars 50 μm in K-L, 20 μm in M) of infected and MOCK-treated organoids. Dashed lines and asterisks indicate organoid surface based on DAPI signal (not shown) and lumen respectively. dpi, days post-infection. See also Figure S2 and Table S3.
Figure 3
Figure 3. ZIKV and HSV-1 infections differentially engage the IFN-I system
A-B) Cluster of densely connected genes among genes upregulated in ZIKV-infected organoids at 12 dpi (in A) and their HOMER de novo motif analysis (in B). C) Expression analysis of genes from A in infected organoids compared to their MOCK controls. D-E) Quantification of IFNα and IFNβ levels measured by ELISA assay. Values represent mean ± SEM (Mann-Whitney tests). F) Schematic diagram of IFNB1>GFP (IFN>GFP) and ISRE>tdTomato (ISRE>tdT) reporters. G-R) Immunostaining (scale bars 100 μm) of organoids generated from reporter cells and analyzed one day after stimulation with poly(I:C) in G, or after ZIKV or HSV-1 exposure (in K and O). Dashed lines indicate organoid contour based on DAPI (not shown). Insets (scale bars 50 μm) represent a magnified view of the area close to one single IFN>GFP+ cell (arrows). Arrowheads indicate ISRE>tdT+ cells. Graphs are Tukey plots (n≥3; p=0.0211 in H, p=0.0007 in I, p=0.0068 in J, p=0.0273 in L, p=0.0091 in M, p=0.3175 in N, p=0.0857 in P, p=0.6820 in Q, p=0.5994 in R, Mann-Whitney tests). Ctrl, control transfection. ns, non-significant. dpi, days post-infection; See also Figure S3.
Figure 4
Figure 4. The IFN-I response in brain organoids is more attenuated than in 2D cultures
A-D) Quantification of IFNA and IFNB1 expression by RT-qPCR in cultures exposed to ZIKV (in A-B) or HSV-1 (in C-D). Dotted lines indicate the value of 1. Values are mean ± SEM (n=3 for A549, n=4 for disOrg, n=7 for ZIKV organoids, n=3 for HSV-1 organoids; ZIKV IFNA: p=0.8985 A549 1 dpi; p=0.0823 A549 4 dpi; p=0.6069 disOrg 2 dpi; p=0.9784 disOrg 4 dpi; p=0.7633 Org 4 dpi; p=0.0057 Org 12 dpi; ZIKV IFNB1: p=0.0005 A549 1 dpi; p=0.0015 A549 4 dpi; p=0.7036 disOrg 2 dpi; p=0.0008 disOrg 4 dpi; p=0.2135 Org 4 dpi; p=0.0333 Org 12 dpi; HSV-1 IFNA: p=0.5876 A549 1 dpi; p=0.0105 A549 4 dpi; p=0.1457 disOrg 2 dpi; p=0.0183 disOrg 4 dpi; p=0.2903 Org 4 dpi; p<0.0001 Org 8 dpi; HSV-1 IFNB1: p=0.0794 A549 1 dpi; p=0.1054 A549 4 dpi; p=0.3126 disOrg 2 dpi; p=0.0056 disOrg 4 dpi; p=0.4055 Org 4 dpi; p=0.2250 Org 8 dpi; Mann-Whitney test comparisons of infected samples vs age-matched MOCK samples). E-H) Immunostaining (scale bars 100 μm) and quantification of Irf3 nuclear localization. A549 and disOrganoids were analyzed at 4 dpi, organoids at 12 dpi (in E) or 8 dpi (in F). ZIKVA, Zika virus Antigen; ICP4, infected cell polypeptide 4 protein of HSV-1. Color code as in A. Values are mean ± SEM (p=0.0007 in G; p<0.0001 in H; one-way ANOVA). I) Expression of nucleic acid sensors measured by RT-qPCR. Values are mean ± SEM (n=3, p=0.3387 RIG-I; p=0.0063 DHX58; p=0.0432 TLR7; **** is p<0.0001; one-way ANOVA). J-K) Immunostaining (scale bars 20 μm) and quantification of Irf3 nuclear accumulation after poly(I:C) treatment. Values are mean ± SEM (n=3; p<0.0001, one-way ANOVA). ns, non-significant; dpi, days post-infection. See also Figure S4.
Figure 5
Figure 5. IFNβ treatment prevents ZIKV-induced organoid defects
A) Timeline of interferons (IFN-I) treatment. Organoids were analyzed at 12 dpi. B-C) Images (scale bars 200 μm) of organoids treated as in A and area quantification. Values are mean ± SD and represent individual organoids (**** is p<0.0001, p=0.0063 ZIKV+IFNα2 vs ZIKV, p=0.0021 ZIKV+IFNβ vs ZIKV, p>0.9999 ZIKV+IFNα2 vs ZIKV+IFNβ, p=0.0015 ZIKV+IFNα2 vs MOCK, p=0.0117 ZIKV+IFNβ vs MOCK, Kruskal-Wallis test). D-E) Immunostaining (scale bars 200 μm) of organoids and area quantification of ventricular zone (VZ)-like regions. Violin plots show median and quartiles (n=114 regions from 6 MOCK organoids, n=55 from 7 ZIKV organoids, n=73 from 7 ZIKV+IFNα2 organoids, n=106 from 7 ZIKV+IFNβ organoids; p=0.0026 ZIKV+IFNα2 vs MOCK; p>0.9999 ZIKV+IFNβ vs MOCK; **** is p<0.0001; Kruskal-Wallis test). F-G) Principal Component Analysis (PCA) and expression (in scaled variance stabilizing transformation or VST) of differentially expressed genes. H) Quantification of ZIKV viral RNA (vRNA) expression measured by RT-qPCR in organoids treated as in A. Values are mean ± SEM (4dpi: p=0.0017 ZIKV+IFNα2 vs ZIKV, p=0.0005 ZIKV+IFNβ vs ZIKV; **** is p<0.0001; one-way ANOVA Tukey’s multiple comparisons test). dpi, days post-infection; ns, non-significant. See also Figure S5 and Table S2.
Figure 6
Figure 6. IFNβ treatment fails to prevent HSV-1-induced organoid defects
A) Timeline of IFN-I administration. Organoids were analyzed at 8 dpi. B-C) Images (scale bars 200 μm) and area quantification of organoids treated as in A. Values are mean ± SD (**** is p<0.0001; p=0.0043 HSV+IFNα2 vs HSV; p>0.9999 HSV+IFNβ vs HSV; p=0.0587 HSV+IFNα2 vs HSV+IFNβ; p>0.9999 HSV+IFNα2 vs MOCK; p=0.0007 HSV+IFNβ vs MOCK; Kruskal-Wallis test). D and F) Immunostaining (scale bars 200 μm) of organoids. Dashed lines indicate organoid contour. E) Quantification of Sox1 mean intensity per cell. Violin plots show median and quartiles (n>3000 cells from at least 3 organoids per condition, **** is p<0.0001, Kruskal-Wallis test). G) Quantification of the ventricular zone (VZ)-like regions marked by N-Cadherin (N-Cad) apical accumulation. Data are mean ± SEM (n=3 experiments; **** is p<0.0001, ns is p>0.9999; Kruskal- Wallis test). H-I) Principal Component Analysis (PCA) and expression (in scaled variance stabilizing transformation or VST) of genes differentially expressed in HSV-1-infected organoids. J) Percentage of RNA-sequencing reads aligned to the HSV-1 genomic sequence. Values are mean ± SEM (for 4 dpi: p=0.8613 MOCK vs HSV, p=0.9975 HSV+IFNα2 vs HSV, p=0.8447 HSV+IFNβ vs HSV; for 8 dpi: p=0.003 MOCK vs HSV, p=0.0003 HSV+IFNα2 vs HSV, p=0.2943 HSV+IFNβ vs HSV, one-way ANOVA Tukey’s multiple comparisons test). dpi, days post-infection; ns, non-significant. See also Figure S6 and Table S2.
Figure 7
Figure 7. HSV-1 selectively counteracts IFNβ activity
A-F) Images (scale bars 200 μm) and area quantifications of organoids exposed to HSV-1 wild type (WT), R3616 mutant or MOCK-treated and analyzed at 8 dpi. Values are mean ± SD and represent individual organoids (in B: for wt, p=0.0066 and p=0.0021; for R3616 p=0.0008 and p=0.7802; in E: for wt p=0.0002, p=0.02, p=0.0232 and p=0.1606; for R3616, p=0.8148, p=0.5701, p=0.7394; **** is p<0.0001; Mann-Whitney test comparisons to MOCK counterparts). Outcomes of infection experiments shown in C and F are based on statistical significance (strong if p<0.005, mild if 0.0050.05). G-H) Immunostaining (scale bars 200 μm) and quantification of infected organoid area at 8 dpi. Dashed lines indicate organoid contour. Data are mean ± SD (n=6 organoids for WT, n=7 for R3616). I) Immunostaining (scale bars 100 μm) of Vero cells incubated with supernatants (Sup) from HSV- 1 WT- or R3616-infected organoids at 8 dpi. J-M) Images, immunostaining (scale bars 200 μm) and quantification of organoid infected area at 8 dpi. Refer to Figure 6 for comparison to wt HSV-1. Values in K are mean ± SD (n=6 untreated organoids, n=7 organoids for IFNα2 and IFNβ; **** is p<0.0001; ns is p p>0.9999; p=0.0020 R3616+IFNα2 vs R3616; Kruskal-Wallis test). dpi, days post-infection; ns, non-significant. See also Figure S7, Table S1 and S2.

Similar articles

Cited by

References

    1. Aho V, Myllys M, Ruokolainen V, Hakanen S, Mäntylä E, Virtanen J, Hukkanen V, Kühn T, Timonen J, Mattila K, Larabell CA, et al. Chromatin organization regulates viral egress dynamics. Sci Rep. 2017;7:3692. - PMC - PubMed
    1. Amin ND, Paşca SP. Building Models of Brain Disorders with Three-Dimensional Organoids. Neuron. 2018;100:389–405. - PubMed
    1. Anders S, Pyl PT, Huber W. HTSeq--a Python framework to work with high-throughput sequencing data. Bioinformatics. 2015;31:166–169. - PMC - PubMed
    1. Arao Y, Ando Y, Narita M, Kurata T. Unexpected correlation in the sensitivity of 19 herpes simplex virus strains to types I and II interferons. Journal of Interferon & Cytokine Research. 1997;17:537–541. - PubMed
    1. Bagley JA, Reumann D, Bian S, Lévi-Strauss J, Knoblich JA. Fused cerebral organoids model interactions between brain regions. Nat Meth. 2017;14:743–751. - PMC - PubMed

Publication types