. 2021 Apr 29;184(9):2503-2519.e17.
doi: 10.1016/j.cell.2021.03.025. Epub 2021 Apr 9.

Genome-wide programmable transcriptional memory by CRISPR-based epigenome editing

Affiliations

Genome-wide programmable transcriptional memory by CRISPR-based epigenome editing

James K Nuñez et al. Cell. .

Abstract

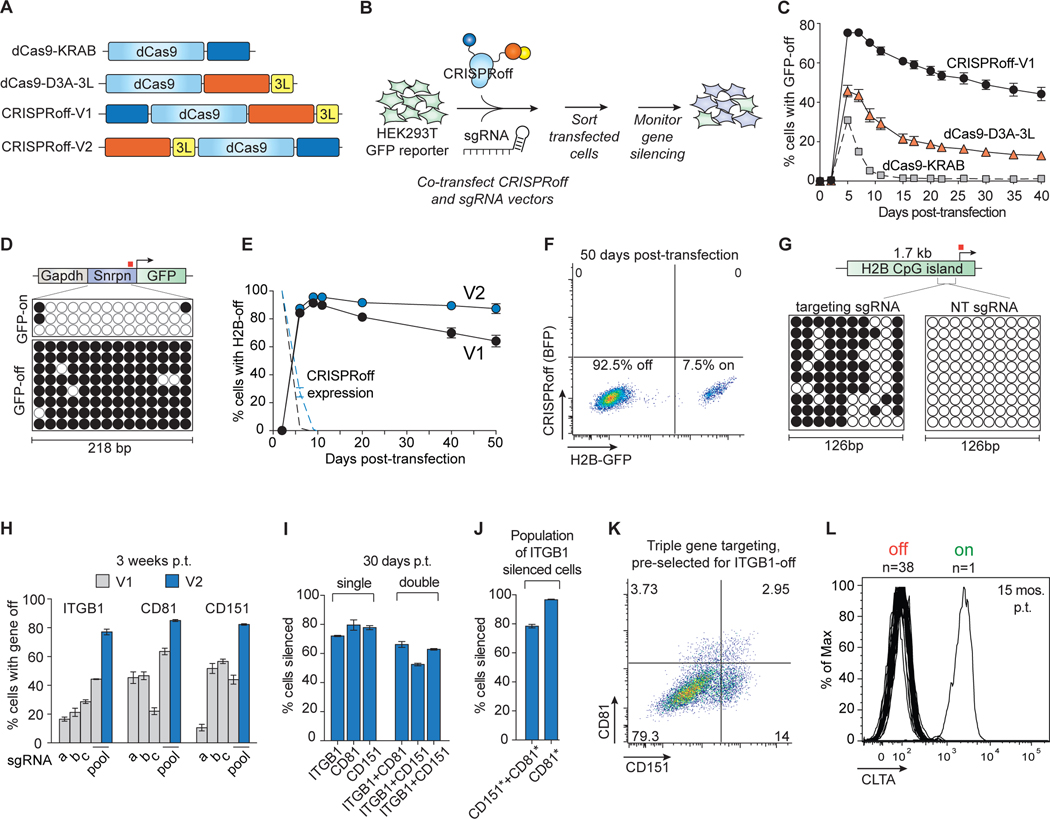
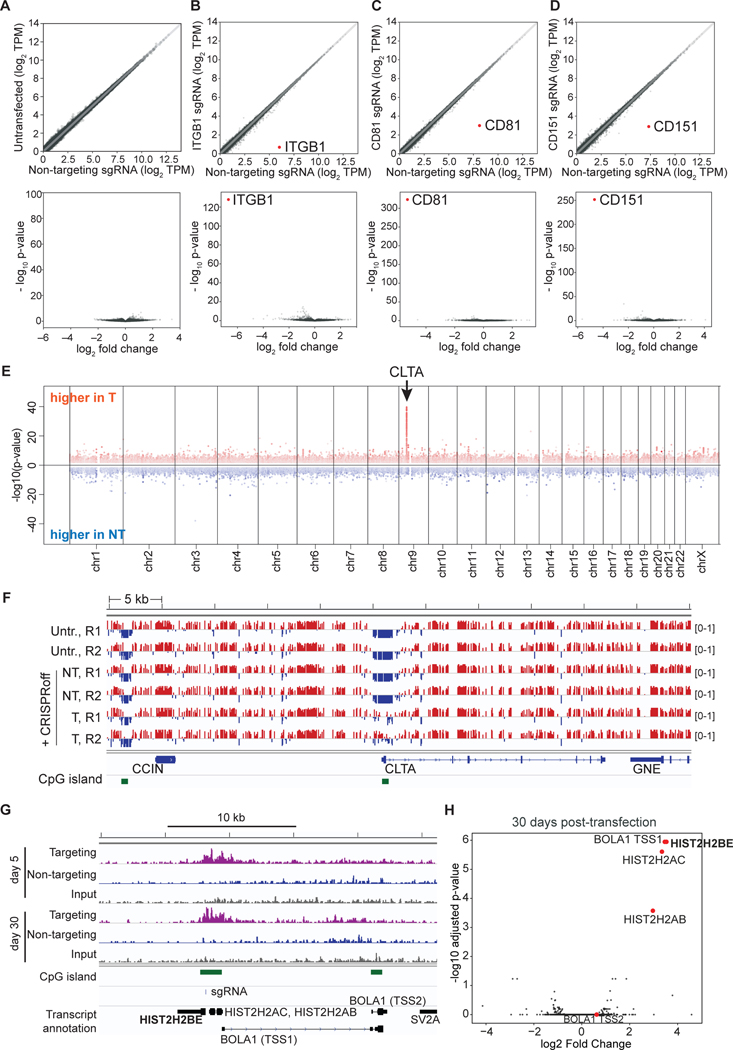
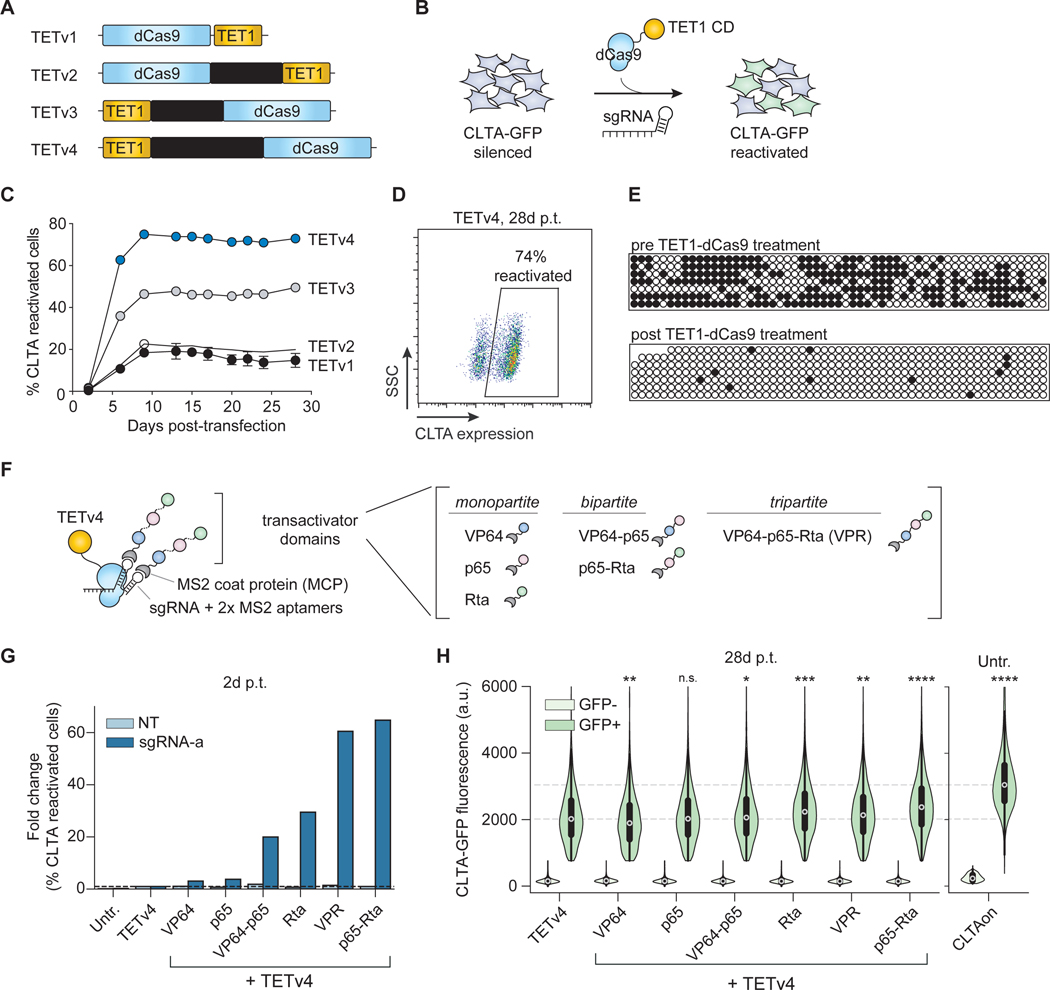
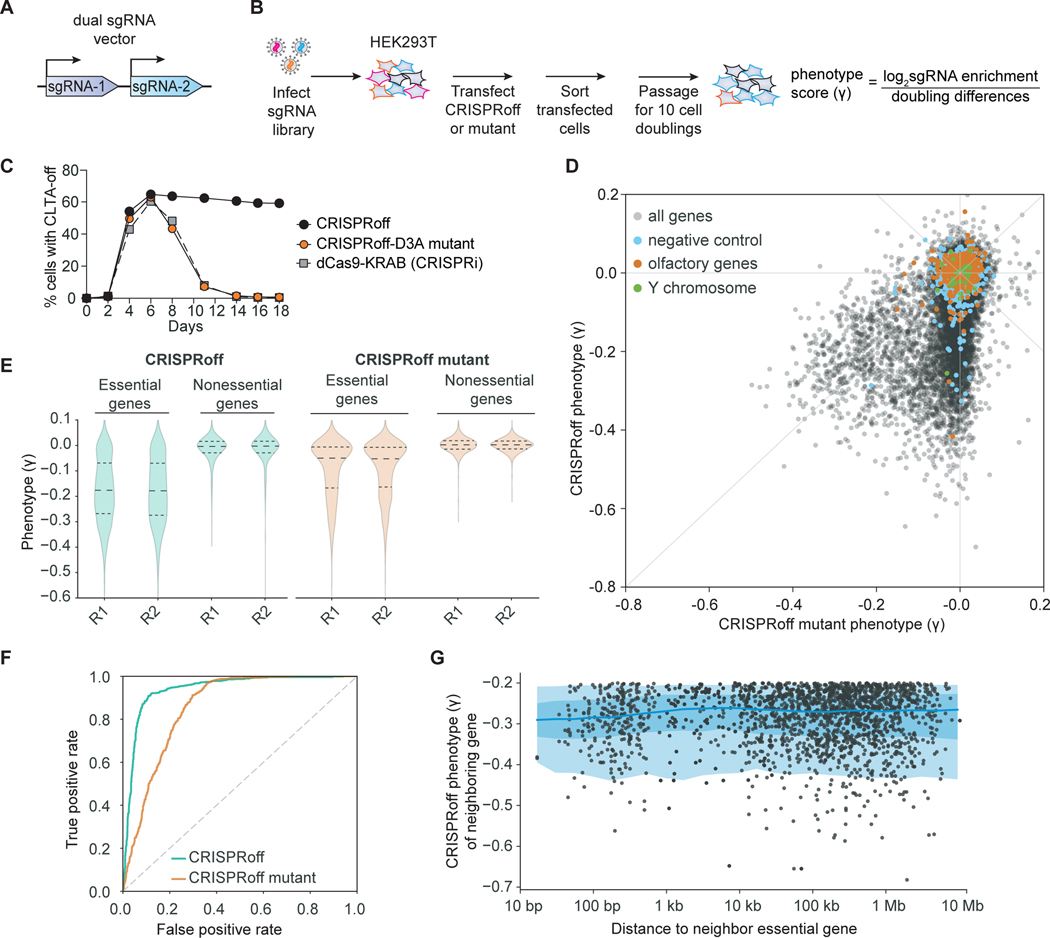
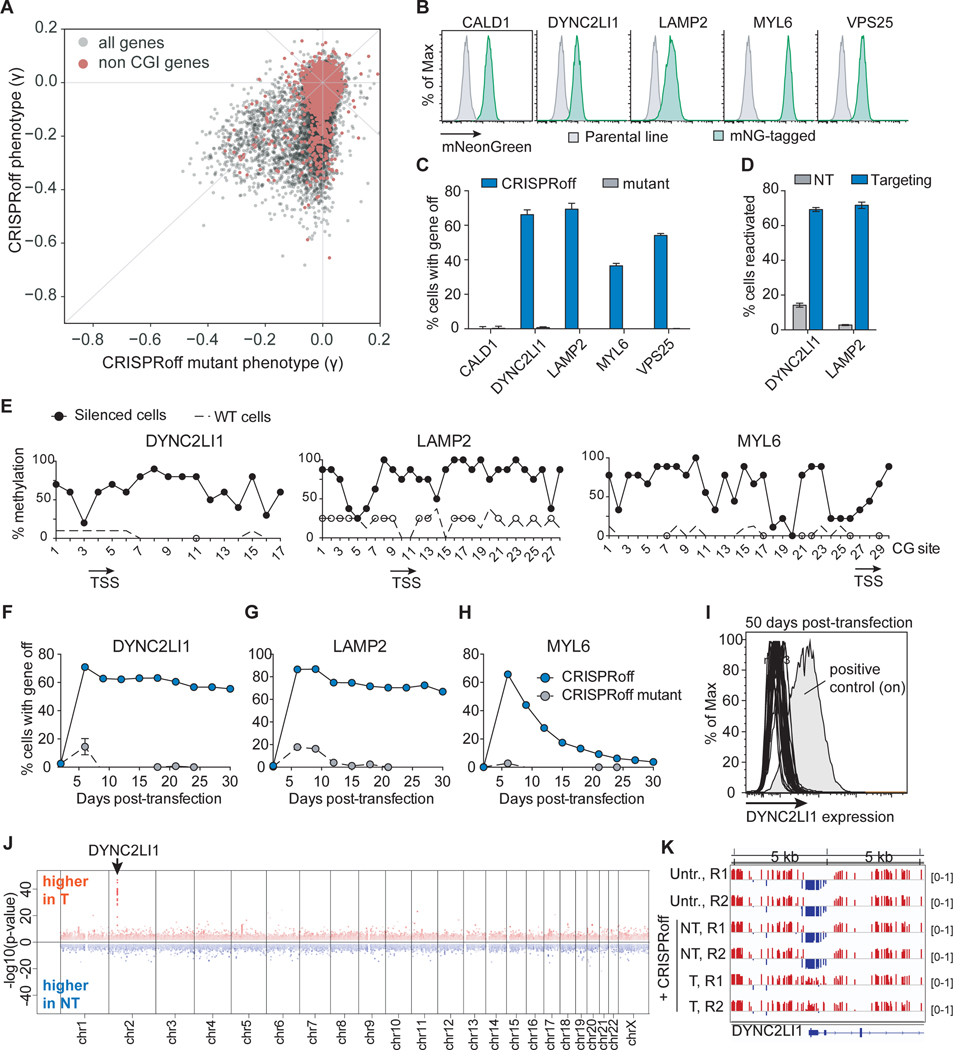
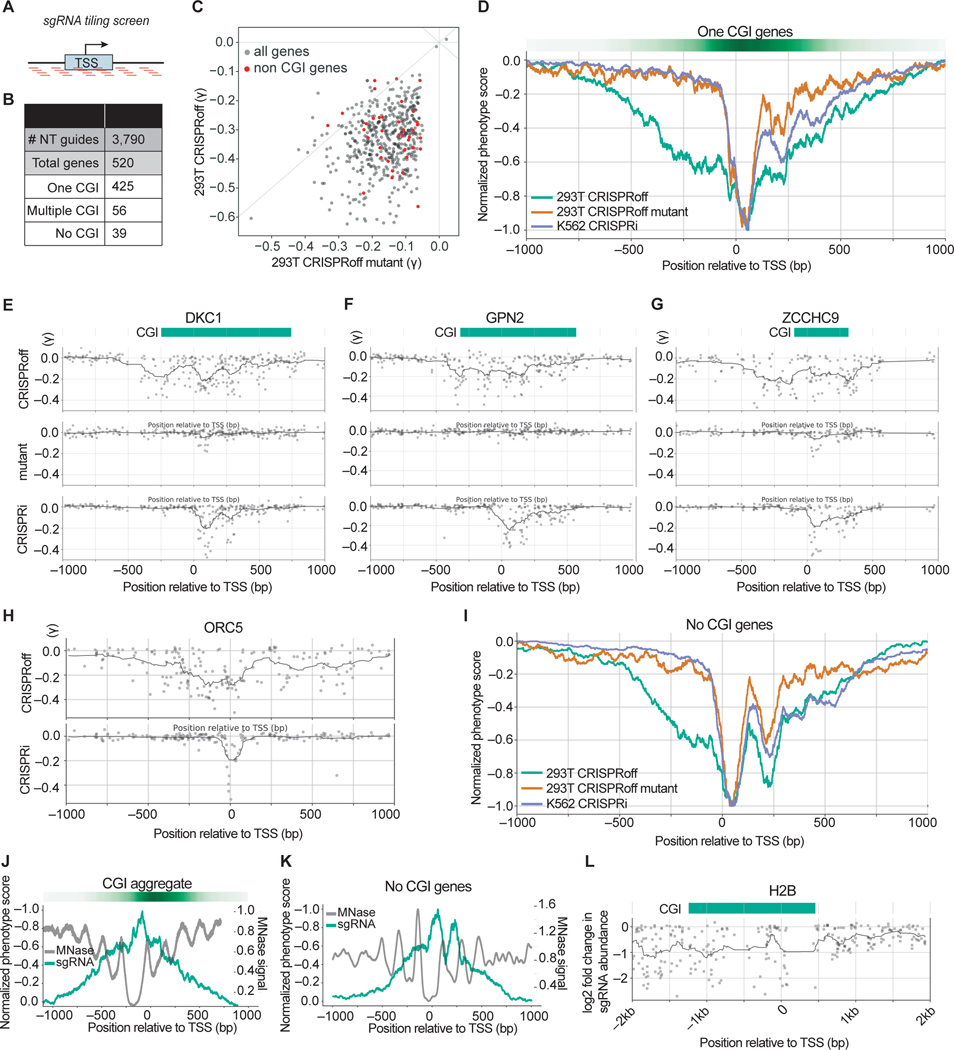
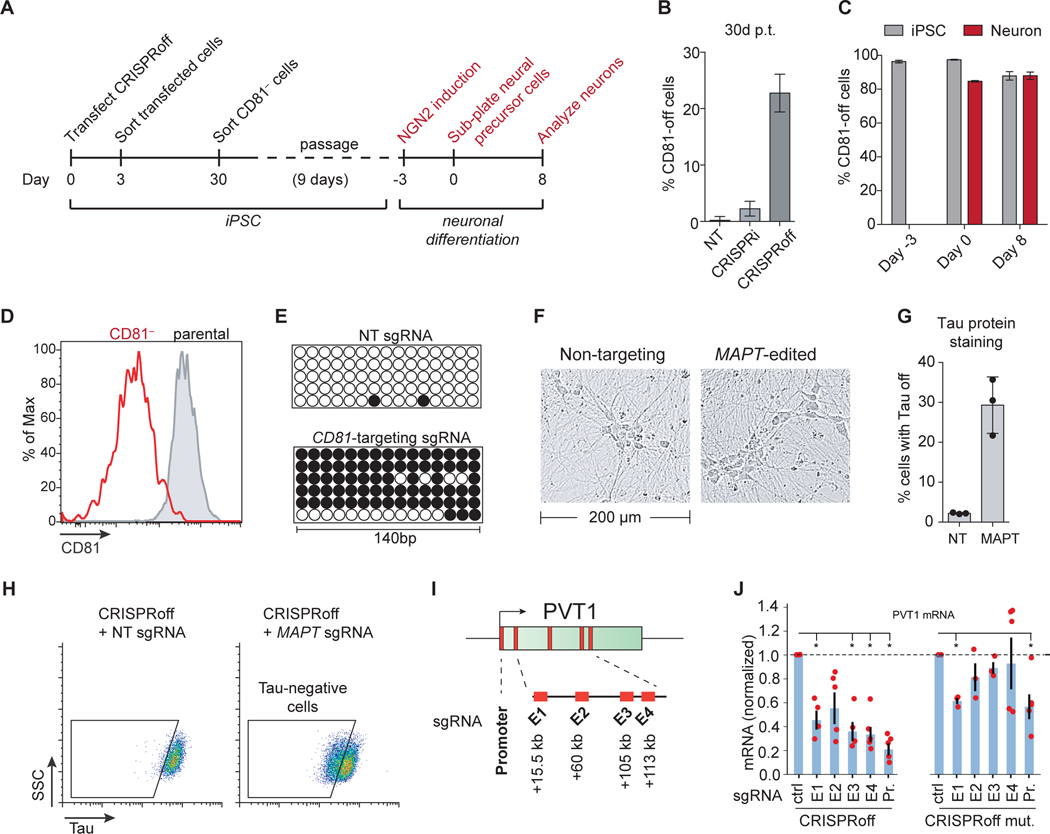
A general approach for heritably altering gene expression has the potential to enable many discovery and therapeutic efforts. Here, we present CRISPRoff-a programmable epigenetic memory writer consisting of a single dead Cas9 fusion protein that establishes DNA methylation and repressive histone modifications. Transient CRISPRoff expression initiates highly specific DNA methylation and gene repression that is maintained through cell division and differentiation of stem cells to neurons. Pairing CRISPRoff with genome-wide screens and analysis of chromatin marks establishes rules for heritable gene silencing. We identify single guide RNAs (sgRNAs) capable of silencing the large majority of genes including those lacking canonical CpG islands (CGIs) and reveal a wide targeting window extending beyond annotated CGIs. The broad ability of CRISPRoff to initiate heritable gene silencing even outside of CGIs expands the canonical model of methylation-based silencing and enables diverse applications including genome-wide screens, multiplexed cell engineering, enhancer silencing, and mechanistic exploration of epigenetic inheritance.

Keywords: CRISPR; DNA methylation; cell therapy; dCas9; epigenetics.


Conflict of interest statement

Declaration of interests J.K.N., J.C., G.C.P., L.A.G., and J.S.W. have filed patent applications related to CRISPRoff, CRISPRon, and CRISPRi/a screening. J.M.R. consults for Maze Therapeutics. L.A.G., J.S.W., H.Y.C., and B.E.B. consult for and hold equity in Chroma Medicine. J.S.W. declares outside interest in KSQ Therapeutics, Maze Therapeutics, Amgen, and Tessera Therapeutics. M.K. serves on the Scientific Advisory Boards of Engine Biosciences, Casma Therapeutics, and Cajal Neuroscience. B.E.B. declares outside interests in Fulcrum Therapeutics, Arsenal Biosciences, HiFiBio, and Cell Signaling Technologies. H.Y.C. is a co-founder of Accent Therapeutics, Boundless Bio, and is an advisor for 10x Genomics, Arsenal Biosciences, and Spring Discovery.

Figures

Figure 1.
Figure 1.. Durable and multiplexed gene silencing by CRISPRoff
(A) A schematic of dCas9 epigenetic editor fusion proteins that were tested for gene silencing activity. 3L denotes Dnmt3L. (B) Plasmids encoding dCas9 fusions and sgRNAs were co-transfected into HEK293T cells stably expressing a DNA methylation-sensitive Snrpn-GFP reporter. Transfected cells were sorted 2 days after transfection and GFP silencing was monitored over time. (C) A time course comparing GFP silencing activities of CRISPRoff-V1, dCas9–3A-3L, and dCas9-KRAB. (D) Bisulfite PCR analysis of the Snrpn locus before or after CRISPRoff targeting. The white circles indicate unmethylated CpG dinucleotides and black circles represent methylated CpG dinucleotides. Each row represents one sequencing read. The red square denotes the sgRNA binding site. (E) A comparison of CRISPRoff-V1 (black) and CRISPRoff-V2 (blue) editors in silencing the endogenously GFP-tagged H2B gene. The dotted lines represent protein expression of CRISPRoff-V1 and -V2. (F) A representative flow cytometry plot of H2B-GFP expression of cells at 50 days post-transfection of CRISPRoff V2. (G) Bisulfite sequencing analysis of a 126 bp region of the H2B CpG island. The red square denotes the sgRNA binding site. (H) Quantification of cells with ITGB1, CD81, or CD151 silenced 3 weeks post-transfection (p.t.) of CRISPRoff-V1 or -V2 with individual sgRNAs (a-c) or a pool of three sgRNAs (a, b, c). (I) Quantification of cells with ITGB1, CD81, CD151 silenced 30 days p.t. from single or double gene targeting experiments. (J) Quantification of multiplexed triple gene silencing by either gating on ITGB1-off cells then gating for CD81- and CD151-off cells (left bar) or by first gating on ITGB1-off cells, then CD151-off cells, and finally CD81-off cells (right bar). The asterisks denote the population of cells with the marked gene turned off. (K) A representative flow cytometry plot of cells targeted for ITGB1, CD81, and CD151 silencing. Cells were first gated on ITGB1 silencing and the represented population displays CD81 and CD151 silencing. (L) A histogram plot of CLTA expression at 15 months p.t. showing 38 clones that retained CLTA repression and one clone that reactivated CLTA expression. The mean values in C, E, H-J were measured from three independent experiments. Error bars represent SD of the mean.
Figure 2.
Figure 2.. Highly specific and robust transcriptional silencing by CRISPRoff
(A–D) RNA-seq plots of HEK293T cells transfected with CRISPRoff and non-targeting (NT) sgRNAs compared to sgRNAs targeting (B) ITGB1, (C) CD81, or (D) CD151. A comparison of untransfected cells and CRISPRoff with NT sgRNA is shown in (A. The volcano plots (bottom) display the targeted genes as the most significantly repressed transcripts globally. The data are representative of the average of two independent replicates. (E) A Manhattan plot displaying differentially methylated CpGs between cells treated with CRISPRoff and CLTA-targeting or NT sgRNAs (30 days post-transfection) analyzed by WGBS. Red dots represent CpGs that gained DNA methylation in targeting sgRNA cells and blue dots represent CpGs that gained DNA methylation in NT sgRNA cells. The arrow denotes the genomic position of CLTA. (F) A comparison of CpG methylation along a 55 kb window that includes the CLTA locus. Tracks labelled ‘Untr.’ represent untransfected cells; the ‘NT’ tracks represent cells transfected with CRISPRoff and non-targeting sgRNA; the ‘T’ tracks represent cells transfected with CRISPRoff and targeting sgRNA. R1 and R2 represent two technical replicates. Red marks represent methylated (beta-value >0.5) and the blue marks represent unmethylated (<0.5) CpG dinucleotides. CpG islands are shown in green. (G) A comparison of H3K9me3 ChIP-seq signal across the H2B gene in cells transfected with CRISPRoff and H2B-targeting (purple) or NT sgRNAs (blue) taken at 5 days and 30 days p.t. The sgRNA binding site is denoted along with the CpG islands and neighboring genes. The BOLA1 gene contains two annotated transcriptional start sites, labeled TSS1 and TSS2. (H) Volcano plot comparing H3K9me3 ChIP-seq data between CRISPRoff transfected with either H2B-targeting or NT sgRNAs. Red dots highlight the genes proximal to the H2B target.
Figure 3.
Figure 3.. CRISPRon reverses silenced genes by combining DNA demethylation and transcriptional activators
(A) A schematic of the four TET1 catalytic domain fusions to dCas9 (TETv1-v4) that were tested for reactivation of CRISPRoff-silenced genes. (B) CRISPRoff-silenced CLTA-GFP cells were transfected with plasmids encoding TETv1–4 and targeting or NT sgRNAs to assess reactivation. (C) A time course of CLTA reactivation after transfection of each of the four TET fusions in (A). The mean values were measured from three independent experiments. Error bars represent SD. (D) A representative flow cytometry plot of CLTA reactivation measured at 28 days p.t. of TETv4 and targeting sgRNAs. (E) Bisulfite-PCR analysis of the CLTA CGI after reactivation by TET1v1 shows high levels of demethylated CpG cytosines (white circles) compared to CRISPRoff-silenced cells. (F) A schematic of the TETv4 and transactivator ribonucleoprotein complex mediated by a sgRNA encoding two MS2 RNA aptamers. Transactivator domains include monopartite, bipartite, and tripartite architectures of VP64, p65, and Rta. (G) Fold change in the fraction of CLTA-GFP reactivated cells compared to TETv4 alone, measured two days p.t. The data are calculated from the mean of eight technical replicates from three independent experiments. (H) Comparison of the expression of CLTA-GFP in single cells, measured by cytometry 28 days p.t. with CRISPRon. The data are aggregated from three technical replicates. * p value < 1e-4, ** p value < 1e-20, *** p value < 1e-100, **** p value = 0, relative to the GFP positive population in the TETv4 condition by the Wilcoxon rank-sum test. Unsilenced CLTA-GFP cells are provided as a benchmark for wild type expression levels.
Figure 4.
Figure 4.. Genome-wide gene silencing by CRISPRoff
(A) A schematic of the dual sgRNA lentiviral vector used in the CRISPRoff genome-wide screens that contains two unique sgRNAs targeting the same gene. (B) A schematic of a pooled genome-wide screen to determine the targeting landscape of CRISPRoff. (C) A time course of CLTA expression in HEK293T after transfection of dCas9-KRAB (gray), CRISPRoff-V2 (black), or mutant CRISPRoff-D3AE765A (orange). (D) A comparison of phenotype scores (γ) between CRISPRoff (y-axis) and CRISPRoff mutant (x-axis) screens. Three types of expected negative controls are highlighted as negative control pseudo-genes (blue), olfactory genes (orange), and Y chromosome genes (green). (E) A violin plot of the phenotype scores (γ) for genes defined as essential or nonessential from DepMap. Each replicate screen is plotted for CRISPRoff (green) and CRISPRoff mutant (orange). (F) A plot of true and false positive rates of genes defined as essential by DepMap. (G) A plot illustrating the distance of an essential gene hit, defined as having a γ ≤ −0.2, from the nearest essential gene hit. Each dot corresponds to a gene hit’s nearest neighboring essential gene, with the x-axis showing the distance between the two genes and the y-axis as the neighboring gene’s phenotype score.
Figure 5.
Figure 5.. CRISPRoff-mediated silencing of genes without promoter CpG island annotations
(A) A plot comparing the phenotype score of genes between the CRISPRoff and CRISPRoff mutant screens with genes that lack a CGI annotation highlighted in red. (B) Histograms of mNeonGreen fluorescence of five HEK293T cell lines, each with the indicated gene endogenously tagged with split mNeonGreen. (C) Quantification of cells with CALD1, DYNC2LI1, LAMP2, MYL6, or VPS25 silenced after CRISPRoff or CRISPRoff mutant treatment. The data were measured at 14 days p.t., except for VPS25 which was collected at 11 days p.t. due to a growth defect upon gene knockdown. (D) Quantification of percent of cells with DYNC2LI1 or LAMP2 reactivated after TETv4 treatment with targeting or non-targeting sgRNAs, obtained at 14 days p.t. (E) CpG methylation profiling within the LAMP2, DYNC2LI1, and MYL6 promoters after CRISPRoff treatments. White circles represent the CpG methylation status of untransfected HEK293T cells. Each dot is an average of eight independent clones. (F, G, H) Time course plots of DYNC2LI1 (F), LAMP2 (G), and MYL6 (H) expression after transfection of either CRISPRoff or CRISPRoff mutant. Error bars represent the SD of three independent replicates. (I) A histogram of DYNC2LI1 expression in 33 clonal lines, measured at 50 days p.t. A positive control of untransfected cells is labeled. (J) A Manhattan plot displaying differentially methylated CpGs between cells treated with CRISPRoff and either DYNC2LI1-targeting or NT sgRNA, as analyzed by WGBS. The arrow points to the genomic location of DYNC2LI1. (K) A view of a 10 kb genomic window containing the DYNC2LI1 locus, highlighting gain of CpG methylation (red) at the promoter in cells transfected with CRISPRoff and DYNC2LI1-targeting sgRNAs.
Figure 6.
Figure 6.. Pooled sgRNA tiling screens reveal a wide targetable window of CRISPRoff-mediated gene repression
(A) A schematic of the sgRNA library that tiles PAM-containing sgRNAs within a +/− 1 kb window from annotated transcription start sites (TSS). (B) A summary of the number of genes per indicated category that comprise the tiling sgRNA library. (C) A comparison of the phenotype score (γ) for genes with annotated CGI between CRISPRoff (y-axis) and CRISPRoff mutant (x-axis). Each dot is the average of the three most active sgRNAs for each gene. The red dots highlight genes that lack a promoter CGI annotation. (D) An aggregate plot comparing the normalized phenotype score for each sgRNA targeting genes with one annotated CGI. The green line represents screen data from CRISPRoff in HEK293Ts, orange from CRISPRoff mutant in HEK293Ts, and purple from CRISPRi in K562s. (E, F, G) Representative sgRNA activity score profiles for DKC1, GPN2, and ZCCHC9 from the indicated screen (y-axis). The green bar depicts the annotated CGI obtained from UCSC Genome Browser. (H) Representative sgRNA activity score profile for ORC5 from the indicated screen (y-axis). (I) An aggregate plot comparing the normalized phenotype score for each sgRNA for genes without annotated CGIs. (J) An overlay of normalized sgRNA phenotype score from the CRISPRoff screen (green) with MNase signal that represents nucleosome occupancy (gray). The plot is an aggregate of genes with one annotated CGI. (K) An overlay of normalized sgRNA phenotype score from the CRISPRoff screen (green) with MNase signal that represents nucleosome occupancy (gray). The plot is an aggregate of the 39 genes with no annotated CGI. (L) A plot of sgRNA activity along with MNase signal for H2B, derived from the sgRNA tiling screen outlined in Figure S6F.
Figure 7.
Figure 7.. CRISPRoff gene silencing in iPSCs, iPSC-derived neurons, and enhancers
(A) An experimental workflow of CD81 knockdown by CRISPRoff in iPSCs, followed by NGN2-mediated differentiation of edited cells into neurons. (B) Quantification of cells with CD81 silenced by CRISPRi or CRISPRoff with CD81-targeting or NT sgRNAs, measured at 30 days p.t. The error bars represent SD from three independent experiments. (C) Quantification of cells with CD81 silenced at the indicated time points from (A). The gray bars indicate the percent of iPSC-edited cells with CD81 silenced that were not differentiated during the experiment. The red bars represent cells that were carried through the neuronal differentiation protocol. The error bars represent SD from three independent experiments. (D) A representative histogram of CD81 expression at days 8 of neuronal differentiation of parental-unedited (gray) or CD81-edited iPSCs (red). (E) Bisulfite PCR of a 140 bp region of the CD81 promoter in cells transfected with CRISPRoff and NT or CD81-targeting sgRNA. (F) Representative bright field microscopy images of differentiated neurons derived from iPSCs transfected with CRISPRoff and MAPT-targeting or NT sgRNA. (G) Quantification of cells with Tau-off in cells transfected with CRISPRoff and NT or MAPT-targeting sgRNA, measured at 10 days post-differentiation. (H) Representative flow cytometry plots of Tau protein staining in iPSC-derived neurons after CRISPRoff transfection with NT or MAPT-targeting sgRNA. The gates are based on unperturbed iPSC-derived neurons. (I) A schematic of the PVT1 locus with the promoter and four enhancer elements (E1-E4) labeled with the distance from the TSS. (J) Plots of normalized PVT1 transcript levels from quantitative RT-qPCR of cells treated with CRISPRoff (left) or CRISPRoff D3A mutant (right) and sgRNAs targeting either the promoter (Pr.) or the four enhancer elements (E1-E4), normalized to control sgRNAs. Asterisks denote statistical significance by t-test and each technical replicate is shown as red dots.

Comment in

References

    1. Adamson B, Norman TM, Jost M, Cho MY, Nuñez JK, Chen Y, Villalta JE, Gilbert LA, Horlbeck MA, Hein MY, et al. (2016). A Multiplexed Single-Cell CRISPR Screening Platform Enables Systematic Dissection of the Unfolded Protein Response. Cell 167, 1867–1882.e21. - PMC - PubMed
    1. Amabile A, Migliara A, Capasso P, Biffi M, Cittaro D, Naldini L, and Lombardo A. (2016). Inheritable Silencing of Endogenous Genes by Hit-and-Run Targeted Epigenetic Editing. Cell 167, 219–232.e14. - PMC - PubMed
    1. Anzalone AV, Koblan LW, and Liu DR (2020). Genome editing with CRISPR–Cas nucleases, base editors, transposases and prime editors. Nat. Biotechnol. 38, 824–844. - PubMed
    1. Audergon PNCB, Catania S, Kagansky A, Tong P, Shukla M, Pidoux AL, and Allshire RC (2015). Restricted epigenetic inheritance of H3K9 methylation. Science 348, 132–135. - PMC - PubMed
    1. Bintu L, Yong J, Antebi YE, McCue K, Kazuki Y, Uno N, Oshimura M, and Elowitz MB (2016). Dynamics of epigenetic regulation at the single-cell level. Science 351, 720–724. - PMC - PubMed

Publication types