

Increased toxicity and retention of perflourooctane sulfonate (PFOS) in humanized CYP2B6-Transgenic mice compared to Cyp2b-null mice is relieved by a high-fat diet (HFD)
- PMID: 33838175
- PMCID: PMC8154739
- DOI: 10.1016/j.fct.2021.112175
Increased toxicity and retention of perflourooctane sulfonate (PFOS) in humanized CYP2B6-Transgenic mice compared to Cyp2b-null mice is relieved by a high-fat diet (HFD)
Abstract
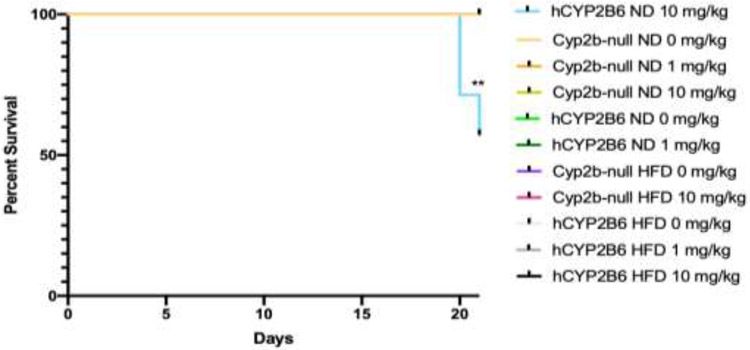
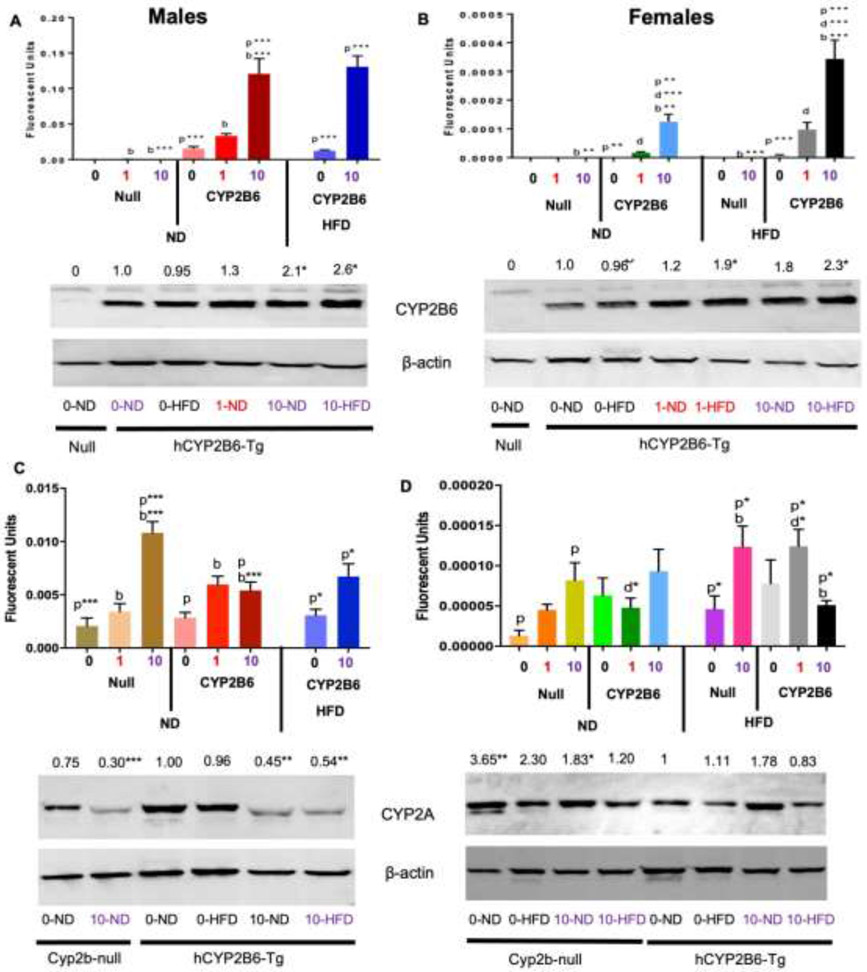
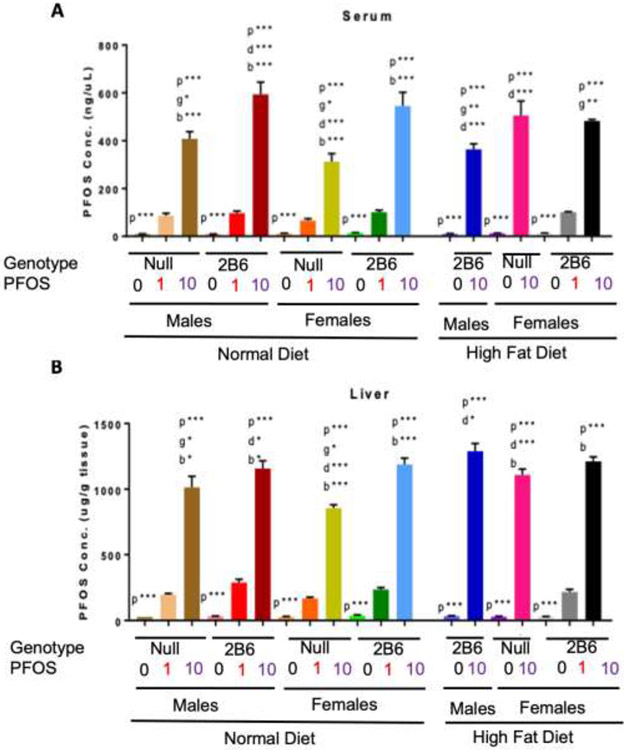
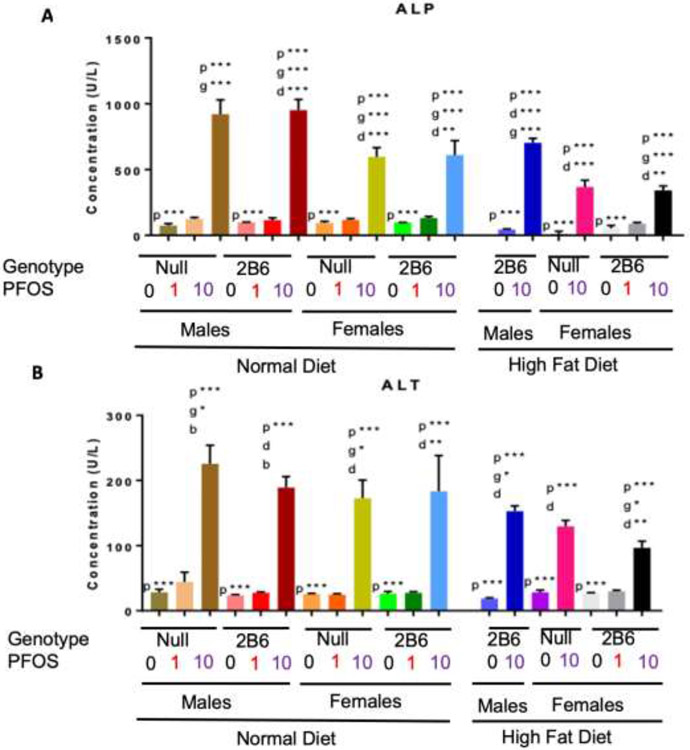
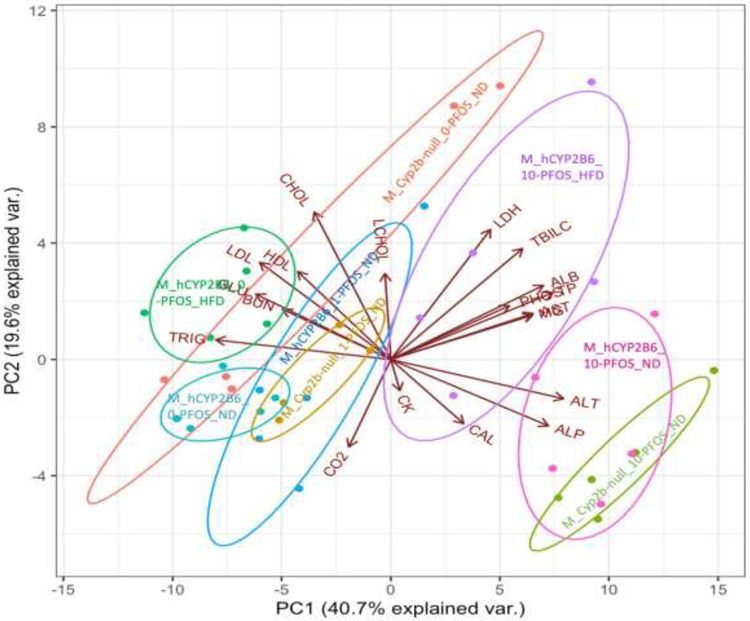
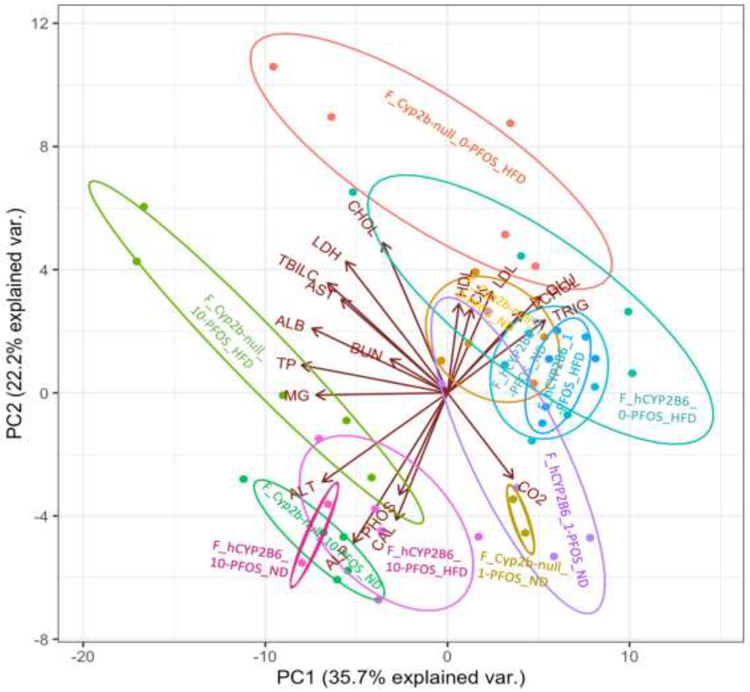
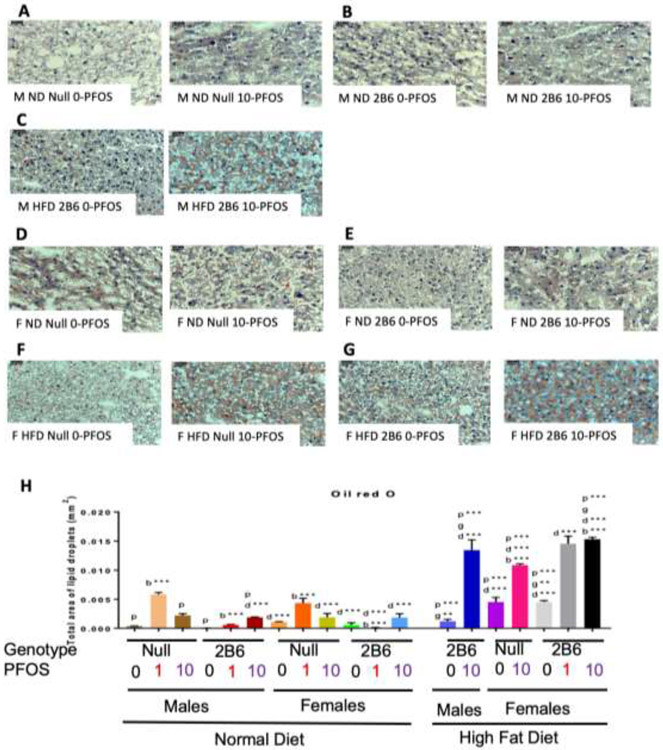
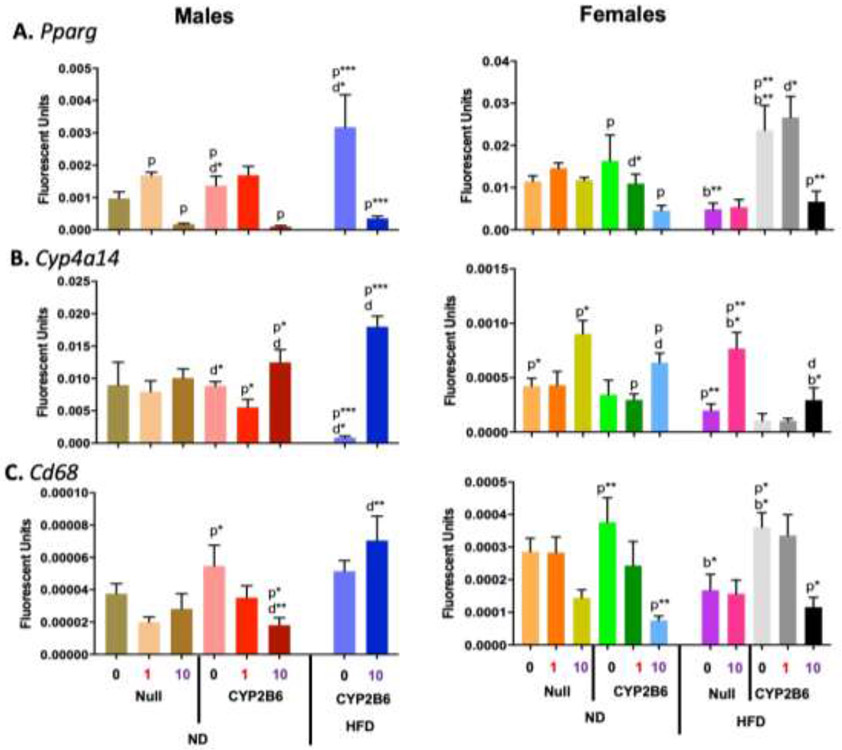
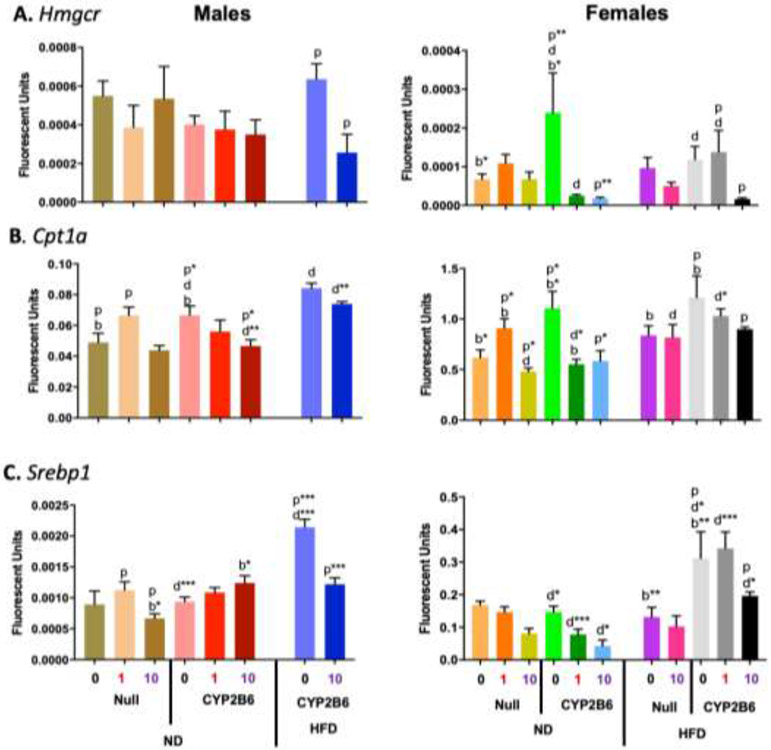
PFOS is a persistent, fluorosurfactant used in multiple products. Murine Cyp2b's are induced by PFOS and high-fat diets (HFD) and therefore we hypothesized that human CYP2B6 may alleviate PFOS-induced steatosis. Cyp2b-null and hCYP2B6-Tg mice were treated with 0, 1, or 10 mg/kg/day PFOS by oral gavage for 21-days while provided a chow diet (ND) or HFD. Similar to murine Cyp2b10, CYP2B6 is inducible by PFOS. Furthermore, three ND-fed hCYP2B6-Tg females treated with 10 mg/kg/day PFOS died during the exposure period; neither Cyp2b-null nor HFD-fed mice died. hCYP2B6-Tg mice retained more PFOS in serum and liver than Cyp2b-null mice presumably causing the observed toxicity. In contrast, serum PFOS retention was reduced in the HFD-fed hCYP2B6-Tg mice; the opposite trend observed in HFD-fed Cyp2b-null mice. Hepatotoxicity biomarkers, ALT and ALP, were higher in PFOS-treated mice and repressed by a HFD. However, PFOS combined with a HFD exacerbated steatosis in all mice, especially in the hCYP2B6-Tg mice with significant disruption of key lipid metabolism genes such as Srebp1, Pparg, and Hmgcr. In conclusion, CYP2B6 is induced by PFOS but does not alleviate PFOS toxicity presumably due to increased retention. CYP2B6 protects from PFOS-mediated steatosis in ND-fed mice, but increases steatosis when co-treated with a HFD.
Keywords: CYP2B6; Cytochrome P450; Hepatotoxicity; Non-alcoholic fatty liver disease (NAFLD); Perflourooctane sulfonate (PFOS); Polyunsaturated fatty acids (PUFAs).
Copyright © 2021 Elsevier Ltd. All rights reserved.
Conflict of interest statement
Declaration of interests
The authors declare that they have no known competing financial interests or personal relationships that could have appeared to influence the work reported in this paper.
Figures
Similar articles
-
Sexually Dimorphic Effects of CYP2B6 in the Development of Fasting-Mediated Steatosis in Mice: Role of the Oxylipin Products 9-HODE and 9-HOTrE.Biomedicines. 2025 Jan 25;13(2):295. doi: 10.3390/biomedicines13020295. Biomedicines. 2025. PMID: 40002708 Free PMC article.
-
Human CYP2B6 produces oxylipins from polyunsaturated fatty acids and reduces diet-induced obesity.PLoS One. 2022 Dec 15;17(12):e0277053. doi: 10.1371/journal.pone.0277053. eCollection 2022. PLoS One. 2022. PMID: 36520866 Free PMC article.
-
Increased Perfluorooctanesulfonate (PFOS) Toxicity and Accumulation Is Associated with Perturbed Prostaglandin Metabolism and Increased Organic Anion Transport Protein (OATP) Expression.Toxics. 2024 Jan 26;12(2):106. doi: 10.3390/toxics12020106. Toxics. 2024. PMID: 38393201 Free PMC article.
-
Perfluorooctanesulfonic acid (PFOS) administration shifts the hepatic proteome and augments dietary outcomes related to hepatic steatosis in mice.Toxicol Appl Pharmacol. 2020 Dec 1;408:115250. doi: 10.1016/j.taap.2020.115250. Epub 2020 Sep 23. Toxicol Appl Pharmacol. 2020. PMID: 32979393 Free PMC article.
-
A CYP2B6-humanized mouse model and its potential applications.Drug Metab Pharmacokinet. 2018 Feb;33(1):2-8. doi: 10.1016/j.dmpk.2018.01.001. Epub 2018 Jan 11. Drug Metab Pharmacokinet. 2018. PMID: 29402634 Review.
Cited by
-
Age- and Diet-Dependent Changes in Hepatic Lipidomic Profiles of Phospholipids in Male Mice: Age Acceleration in Cyp2b-Null Mice.J Lipids. 2022 Mar 29;2022:7122738. doi: 10.1155/2022/7122738. eCollection 2022. J Lipids. 2022. PMID: 35391786 Free PMC article.
-
Replacement per- and polyfluoroalkyl substances (PFAS) are potent modulators of lipogenic and drug metabolizing gene expression signatures in primary human hepatocytes.Toxicol Appl Pharmacol. 2022 May 1;442:115991. doi: 10.1016/j.taap.2022.115991. Epub 2022 Mar 23. Toxicol Appl Pharmacol. 2022. PMID: 35337807 Free PMC article.
-
Sexually Dimorphic Effects of CYP2B6 in the Development of Fasting-Mediated Steatosis in Mice: Role of the Oxylipin Products 9-HODE and 9-HOTrE.Biomedicines. 2025 Jan 25;13(2):295. doi: 10.3390/biomedicines13020295. Biomedicines. 2025. PMID: 40002708 Free PMC article.
-
9-HODE and 9-HOTrE alter mitochondrial metabolism, increase triglycerides, and perturb fatty acid uptake and synthesis associated gene expression in HepG2 cells.Prostaglandins Leukot Essent Fatty Acids. 2024 Mar;202:102635. doi: 10.1016/j.plefa.2024.102635. Epub 2024 Aug 13. Prostaglandins Leukot Essent Fatty Acids. 2024. PMID: 39142221 Free PMC article.
-
Exposure to per- and Polyfluoroalkyl Substances and Markers of Liver Injury: A Systematic Review and Meta-Analysis.Environ Health Perspect. 2022 Apr;130(4):46001. doi: 10.1289/EHP10092. Epub 2022 Apr 27. Environ Health Perspect. 2022. PMID: 35475652 Free PMC article.
References
-
- Abe T, Takahashi M, Kano M, Amaike Y, Ishii C, Maeda K, Kudoh Y, Morishita T, Hosaka T, Sasaki T, et al. (2017). Activation of nuclear receptor CAR by an environmental pollutant perfluorooctanoic acid. Arch Toxicol 91, 2365–2374. - PubMed
-
- Abu-Bakar A. e., Hakkola J, Juvonen R, Rahnasto-Rilla M, Raunio H, and A. Lang M (2012). Function and Regulation of the Cyp2a5/CYP2A6 Genes in Response to Toxic Insults in the Liver. Current Drug Metabolism 14(1), 137–150. - PubMed
-
- Acevedo R, Villanueva H, Parnell PG, Chapman LM, Gimenez T, Gray SL, and Baldwin WS (2005). The contribution of hepatic steroid metabolism to serum estradiol and estriol concentrations in nonylphenol treated MMTVneu mice and its potential effects on breast cancer incidence and latency. J Appl Toxicol 25, 339–353. - PubMed
-
- Alexander J, Auðunsson GA, Benford D, Cockburn A, Cravedi J-P, Dogliotti E, Di Domenico A, Fernández-Cruz ML, Fink-Gremmels J, Fürst P, et al. (2008). Perfluorooctane sulfonate (PFOS), perfluorooctanoic acid (PFOA) and their salts: Scientific Opinion of the Panel on Contaminants in the Food chain1 (Question No EFSA-Q-2004-163). The EFSA Journal 653, 1–131. - PMC - PubMed
MeSH terms
Substances
Grants and funding
LinkOut - more resources
Full Text Sources
Other Literature Sources
Medical
Molecular Biology Databases
Miscellaneous
