. 2021 Jun:35:100460.
doi: 10.1016/j.epidem.2021.100460. Epub 2021 Mar 26.

Competition between RSV and influenza: Limits of modelling inference from surveillance data

Affiliations

Competition between RSV and influenza: Limits of modelling inference from surveillance data

Naomi R Waterlow et al. Epidemics. 2021 Jun.

Abstract

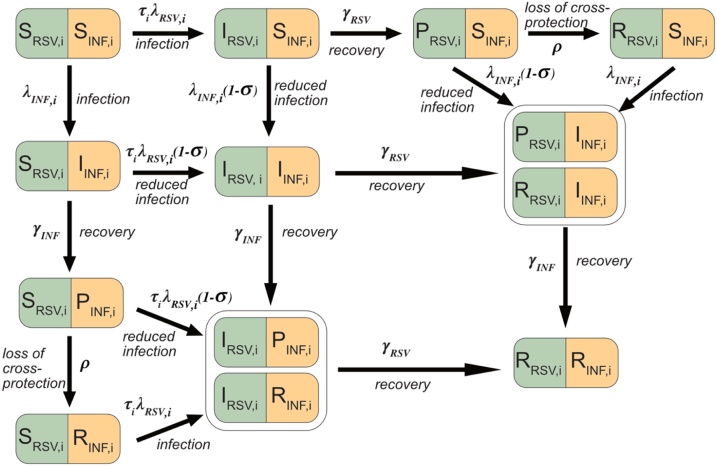
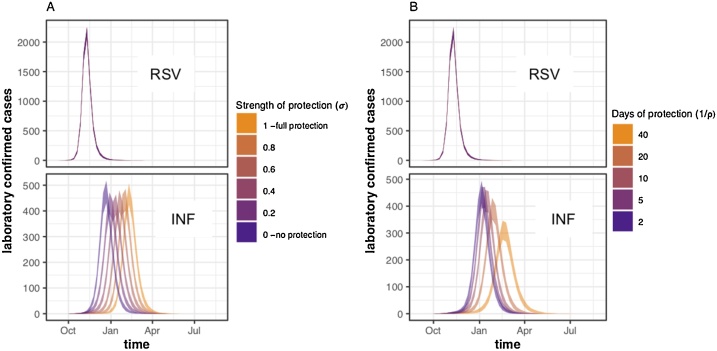
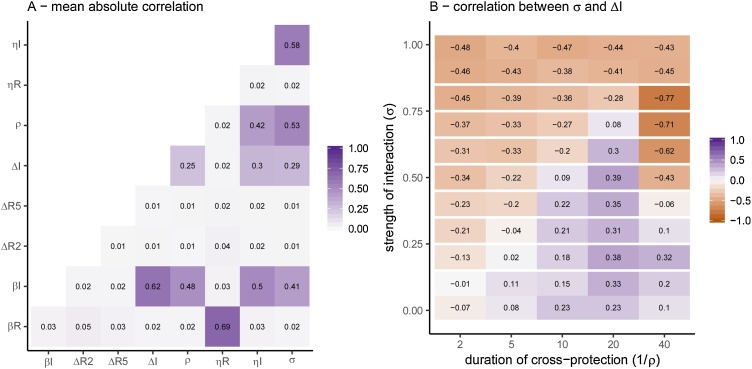
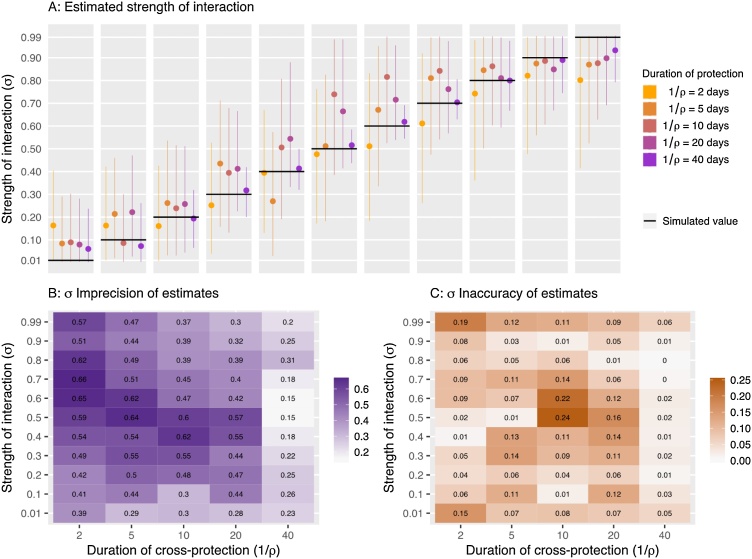
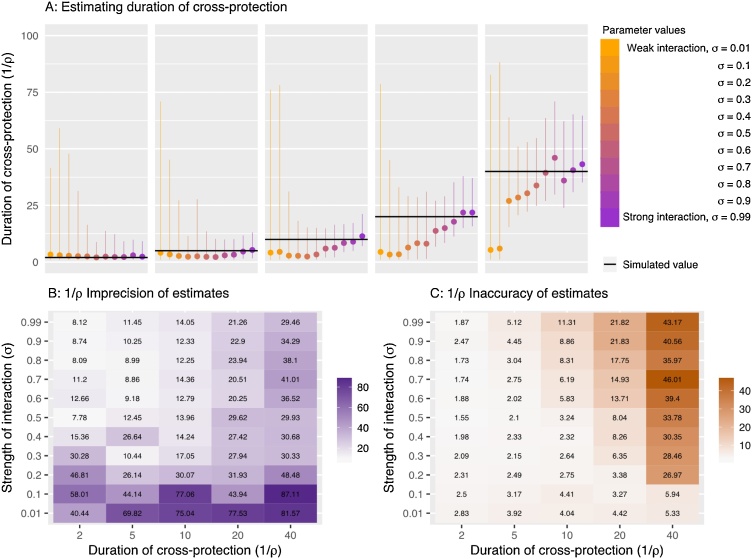
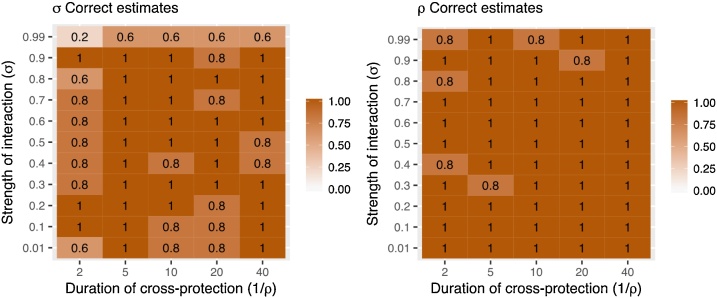
Respiratory Syncytial Virus (RSV) and Influenza cause a large burden of disease. Evidence of their interaction via temporary cross-protection implies that prevention of one could inadvertently lead to an increase in the burden of the other. However, evidence for the public health impact of such interaction is sparse and largely derives from ecological analyses of peak shifts in surveillance data. To test the robustness of estimates of interaction parameters between RSV and Influenza from surveillance data we conducted a simulation and back-inference study. We developed a two-pathogen interaction model, parameterised to simulate RSV and Influenza epidemiology in the UK. Using the infection model in combination with a surveillance-like stochastic observation process we generated a range of possible RSV and Influenza trajectories and then used Markov Chain Monte Carlo (MCMC) methods to back-infer parameters including those describing competition. We find that in most scenarios both the strength and duration of RSV and Influenza interaction could be estimated from the simulated surveillance data reasonably well. However, the robustness of inference declined towards the extremes of the plausible parameter ranges, with misleading results. It was for instance not possible to tell the difference between low/moderate interaction and no interaction. In conclusion, our results illustrate that in a plausible parameter range, the strength of RSV and Influenza interaction can be estimated from a single season of high-quality surveillance data but also highlights the importance to test parameter identifiability a priori in such situations.

Keywords: Competition; Inference; Influenza; Interaction; Respiratory syncytial virus.


Conflict of interest statement

The authors report no declarations of interest.

Figures

Fig. 1
Fig. 1
Model diagram for RSV and Influenza (INF). Individuals could be either Susceptible (S), Infected, (I), Protected (P) or Recovered (R) to either virus. Following infection, (which occurred at rate λRSV,i and λINF,i), recovery occurred at a constant rate (γRSV and γINF), and the population entered the P state. Here they are immune to the virus they were infected by and protected to a varying extent (σ) against infection from the second virus. This protection waned at rate ρ, and the population entered the R compartment. In the R compartment the population was immune to the virus it was infected by, but not the other virus. We ran the model for one season and compartments IRSV,iPINF,i and IRSV,iRINF,I, were combined, and PRSV,iIINF,I and RRSV,iIINF,I were combined, because they are effectively identical. Parameters were: age susceptibility to RSV infection (τi), For clarity, age structure is given only by the subscript (i), for further details see supplement section 2.
Fig. 2
Fig. 2
Mean weekly incidence of observed cases in under 5 s (sum of age groups 0-1 and 2-4) from simulations with A) varying σ values and a fixed protection duration of 10 days (ρ = 0.1), and B) varying ρ values, and a fixed σ of 0.5. Simulations were run and sampled 1000 times for each parameter set and the shaded windows are the 95 % quantiles for each week. In both A and B the top panel shows the observed cases for RSV, and the lower panel the cases for Influenza.
Fig. 3
Fig. 3
A) Mean Pearson correlation coefficient between parameters. B) Correlation coefficient between σ( strength of cross-protection) and ΔINF (start day of influenza). This is shown for 1 simulation, but the patterns were similar for all (Supplementary Section 12).
Fig. 4
Fig. 4
A) Estimated σ values for simulations with different σ and ρ values. Median value and 95 % CI are shown. The black line is the simulated (true) value of σ in each case. B) Imprecision of σ estimates calculated as the 95 % quantile range. C) Inaccuracy of the σ estimates, calculated as the difference between the posterior median and the true value.
Fig. 5
Fig. 5
A) Estimated 1/ ρ values for simulations with different σ and ρ. Lines represent 95 % quantiles of the posterior sample and the circle represents the median value. The black line shows the true 1/ ρ value in each case. B) Imprecision of ρ estimates calculated as the 95 % quantile range. C) Inaccuracy of the ρ estimates, calculated as the difference between the posterior median and the true value.
Fig. 6
Fig. 6
Proportion of simulations where the true value of σ (A) and ρ (B) was included in the 95 % CI of the posterior estimate.

Similar articles

Cited by

References

    1. Ascough S., Paterson S., Chiu C. Induction and subversion of human protective immunity: contrasting influenza and respiratory syncytial virus. Front. Immunol. 2018;9:323. - PMC - PubMed
    1. Baguelin M., Jit M., Miller E., Edmunds W.J. Health and economic impact of the seasonal influenza vaccination programme in England. Vaccine. 2012;30:3459–3462. - PubMed
    1. Baguelin M. Assessing optimal target populations for influenza vaccination programmes: an evidence synthesis and modelling study. PLoS Med. 2013;10 - PMC - PubMed
    1. Bloom-Feshbach K. Latitudinal variations in seasonal activity of influenza and respiratory syncytial virus (RSV): a global comparative review. PLoS One. 2013;8 - PMC - PubMed
    1. Casalegno J.S. Impact of the 2009 influenza a(H1N1) pandemic wave on the pattern of hibernal respiratory virus epidemics, France, 2009. Eurosurveillance. 2010;15(2) - PubMed

Publication types

MeSH terms