. 2021 Aug:476:173-188.
doi: 10.1016/j.ydbio.2021.03.024. Epub 2021 Apr 9.

Altered sacral neural crest development in Pax3 spina bifida mutants underlies deficits of bladder innervation and function

Affiliations

Altered sacral neural crest development in Pax3 spina bifida mutants underlies deficits of bladder innervation and function

Karen K Deal et al. Dev Biol. 2021 Aug.

Abstract

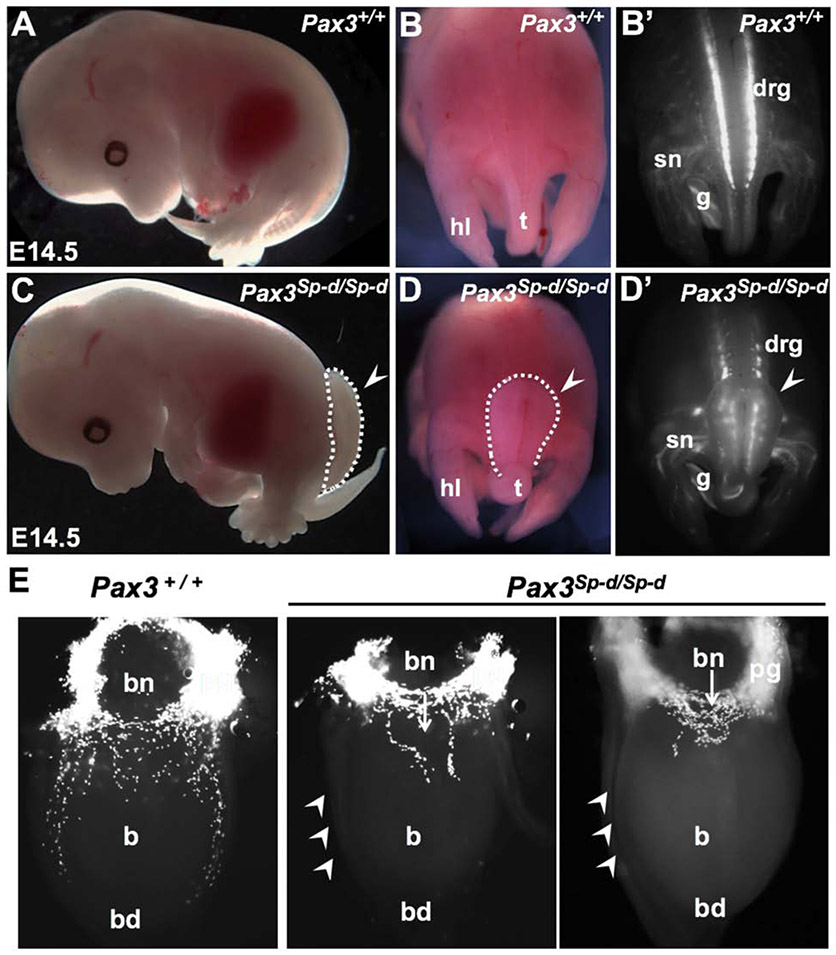
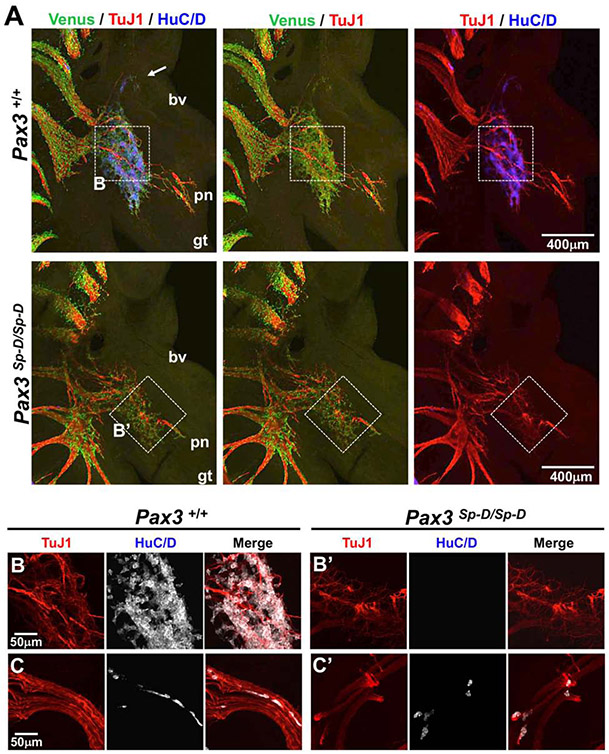
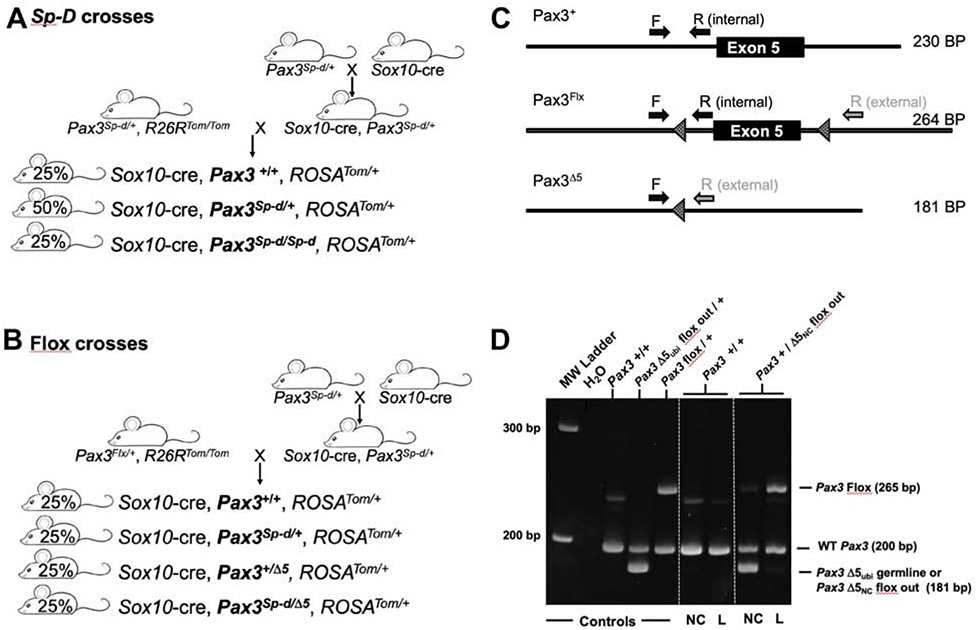
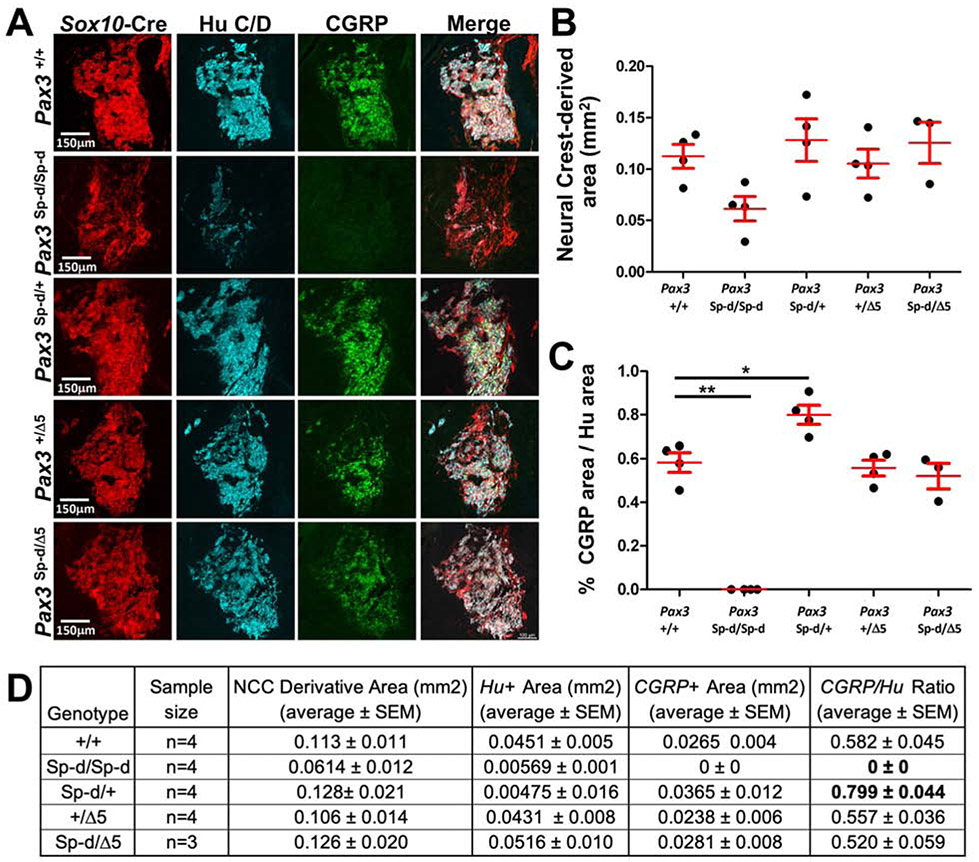
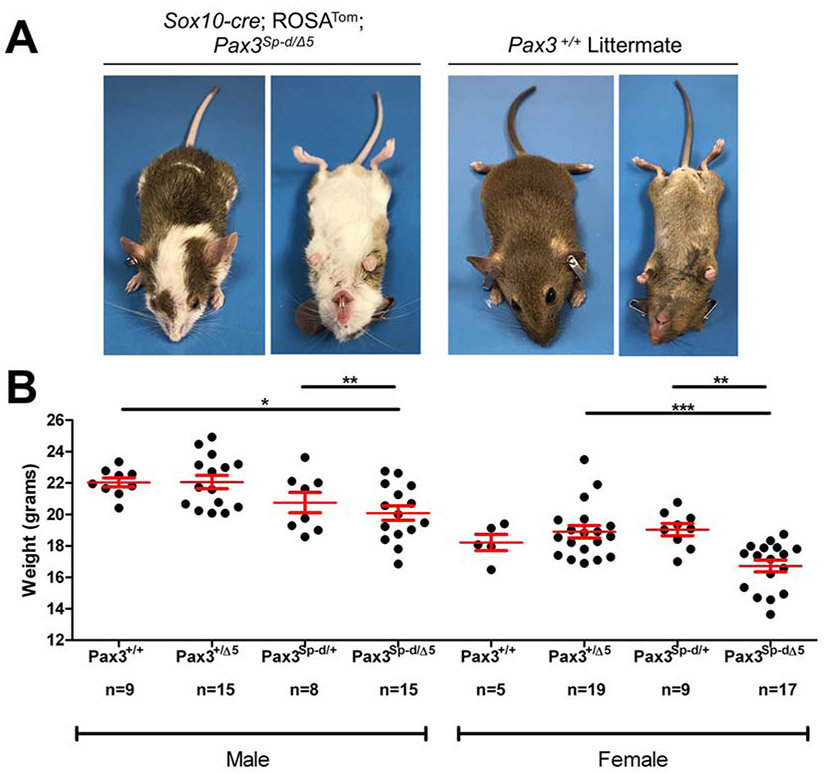
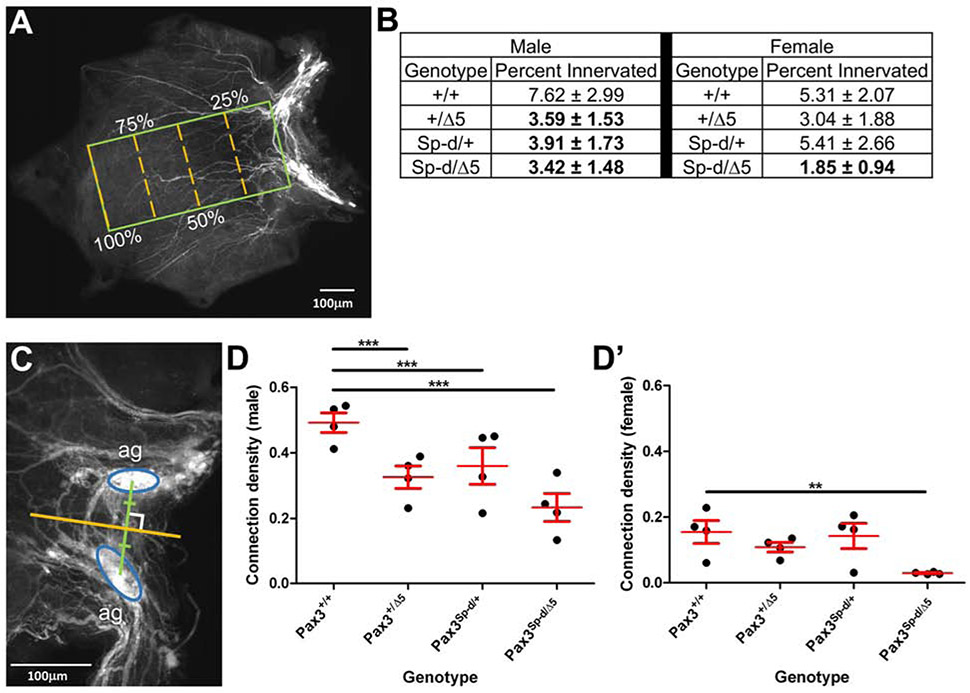
Mouse models of Spina bifida (SB) have been instrumental for identifying genes, developmental processes, and environmental factors that influence neurulation and neural tube closure. Beyond the prominent neural tube defects, other aspects of the nervous system can be affected in SB with significant changes in essential bodily functions such as urination. SB patients frequently experience bladder dysfunction and SB fetuses exhibit reduced density of bladder nerves and smooth muscle although the developmental origins of these deficits have not been determined. The Pax3 Splotch-delayed (Pax3Sp-d) mouse model of SB is one of a very few mouse SB models that survives to late stages of gestation. Through analysis of Pax3Sp-d mutants we sought to define how altered bladder innervation in SB might arise by tracing sacral neural crest (NC) development, pelvic ganglia neuronal differentiation, and assessing bladder nerve fiber density. In Pax3Sp-d/Sp-d fetal mice we observed delayed migration of Sox10+ NC-derived progenitors (NCPs), deficient pelvic ganglia neurogenesis, and reduced density of bladder wall innervation. We further combined NC-specific deletion of Pax3 with the constitutive Pax3Sp-d allele in an effort to generate viable Pax3 mutants to examine later stages of bladder innervation and postnatal bladder function. Neural crest specific deletion of a Pax3 flox allele, using a Sox10-cre driver, in combination with a constitutive Pax3Sp-d mutation produced postnatal viable offspring that exhibited altered bladder function as well as reduced bladder wall innervation and altered connectivity between accessory ganglia at the bladder neck. Combined, the results show that Pax3 plays critical roles within sacral NC that are essential for initiation of neurogenesis and differentiation of autonomic neurons within pelvic ganglia.

Keywords: Autonomic nervous system; Bladder; Lower urinary tract; Pax3; Pelvic ganglia; Sacral neural crest.


Conflict of interest statement

Declaration of competing interest The authors declare no competing or financial interests.

Figures

Figure 1.
Figure 1.. Altered neural crest development revealed by Sox10-H2BVenus transgene expression in Pax3Sp-d/Sp-d embryos.
Whole mount lateral views of Pax3+/+;Sox10-H2BVenus (A) and homozygous Pax3Sp-d/Sp-d;Sox10-H2BVenus (C) littermates show caudal rachischisis (arrowheads/dashed area) in mutants at 14.5 dpc. Dorsal bright field and fluorescence images of fetal spine of WT embryos (B,B’) and Pax3Sp-d/Sp-d mutants (D,D’) show open neural tube, bent tail, and misshapen sacral DRG revealed by Sox10-H2BVenus transgene labeling. Ventral views (E) of micro-dissected bladder from wild type Pax3+/+ relative to Pax3Sp-d/Sp-d shows aberrant migration of Sox10+ NCPs in lateral streams (arrowheads) and medial populations (arrows). Abbreviations: b, bladder; bd, bladder dome; bn, bladder neck; drg, dorsal root ganglia; g, gut; hl, hindlimb; pg, pelvic ganglia; sn, sciatic nerve; t, tail.
Figure 2.
Figure 2.. Pax3Sp-d/Sp-d pelvic ganglia exhibit reduced neuronal commitment in midgestation.
(A) Fluorescent images of parasagittal sections from 14.5 dpc embryos obtained at comparable anatomic levels are shown. Sox10 transgene fluorescence illuminates PG, enteric nervous system in the fetal gut, and peripheral nerve fibers. (B) Higher magnification images of Sox10-H2BVenus transgene fluorescence (left) in cryosections from each of the Pax3 genotypes immunostained for HuC/D (blue, right). (C) Plot of pelvic ganglia area, as delineated by Sox10-H2BVenus expression. (D) Plot of pelvic ganglia area stained by HuC/D. (E) Plot of percent HuC/D area relative to total PG area. Each dot in plots C-E represents the average value for an independent embryo from which 5-6 PG sections were imaged (n=7-8 distinct embryos per genotype class). Average ± SEM (red lines). Statistical significance was determined by Tukey’s HSD between genotypes: * p<0.05; **p<0.01; ***p<0.001; ****p<0.0001. Abbreviations: b, bladder; g, gut; pg, pelvic ganglia.
Figure 3.
Figure 3.. Proliferation of Sox10+ progenitors and differentiating neurons within pelvic ganglia is reduced in Pax3Sp-d/Sp-d embryos.
(A) Confocal images of Sox10-H2BVenus transgene expression (green) in cryosections of 14.5 dpc PG stained with HuC/D (blue) and Ki67 (red) to detect proliferating cells. (B) High magnification confocal images (630X) from each genotype show co-localization of H2B-Venus+ signal with Ki67+ (arrowheads) as well as of Ki67+ HuC/D+ differentiating neurons (arrows). (C) Plot of percent Ki67 over total area of pelvic ganglia defined by area of H2BVenus expression. Proliferation detected by Ki67 immunolabeling is significantly reduced proliferation within pelvic ganglia between Pax3+/+ and Pax3Sp-d/Sp-d embryos (p≤0.05) and Pax3+/+ and Pax3Sp-d/+ embryos (p≤0.05). Each dot represents values for an independent embryo averaged across measures from three pelvic ganglia sections. Average ± SEM (red lines). * p<0.05
Figure 4.
Figure 4.. Sox10+ NPCs migrate appropriately into the developing urogenital system of Pax3Sp-d/Sp-d mutants but fail to initiate neurogenesis by 12.5 dpc.
(A) Tiled confocal images of vibratome sections through sacral regions of Pax3+/+ (upper panels) and Pax3Sp-d/Sp-d (lower panels) embryos expressing Sox10-H2BVenus transgene expression (green) at 12.5 dpc. TuJ1 (red) labeling that detects nerve fiber processes entering the lower urinary tract is similar between genotypes. Immunolabeling for HuC/D (blue) that detects differentiating neurons is absent from the region where NPCs aggregate at the base of the genital tubercle in Pax3Sp-d/Sp-d embryos. (B, B’) High magnification images of boxed regions in A panels shows absence of HuC/D labeling despite the presence of TuJ1 positive nerve fibers. (C, C’) High magnification images of nerve bundles coming from dorsal root ganglion (out of the field of view in A, A’ panels) show migration of HuC/D positive progenitors along TuJ1 positive nerve fibers in both Pax3+/+ and Pax3Sp-d/Sp-d embryos. Abbreviations: bv, blood vessel; gt, genital tubercle; pn, pudendal nerve.
Figure 5.
Figure 5.. Crosses and genotyping assays to derive NC-specific deletion of Pax3 for comparison with Pax3Sp-d mutants.
(A) Schematic diagram of crosses performed to enable NC lineage tracing in Pax3Sp-d offspring using the Sox10-cre line in combination with ROSATom reporter. (B) Schematic of crosses performed to enable NC-specific deletion of Pax3flox allele in combination with the Pax3Sp-d allele. (C) Diagram of PCR oligonucleotide primer placement to detect wild type and Pax3flox alleles. (D) Image of ethidium bromide stained-PCR products separated by gel electrophoresis for the various genotype possibilities illustrating appropriate excision of the Pax3flox construct when crossed to the Sox10-cre line. PCR products are adjacent to a 100bp Molecular Weight ladder (far left), with four control DNA samples run left to right: Lane 1, H2O no template added; Lane 2, wild type C57BL/6J DNA; Lane 3, adult B6.Pax3Δ5/+ DNA (exon 5 deleted in germline therefore ubiquitous deletion of flox cassette); Lane 4, adult B6. Pax3flox with intact exon5 flanked by flox sites. The additional four lanes indicate the ability to concomitantly use the combination of predominantly NC-derived tissue from the fetal snout (NC) and non-NC-derived tissue from fetal liver (L) collected for each embryo to distinguish each of the four possible Pax3 genotypic variants prior to immunohistochemical analysis of pelvic ganglia.
Figure 6.
Figure 6.. Constitutive Pax3Spd mutant disrupts expression of CGRP in fetal pelvic ganglia while NC-specific Pax3 ablation does not.
(A) Confocal Images of 14.5 dpc cryosections from Pax3 variant genotypes stained for HuC/D and CGRP show total absence of CGRP expression in Pax3Sp-d/Sp-d PG. (B) Plot of total PG area of NC derivatives labeled by tdTomato activated via Sox10-cre for each genotype class. (C) Plot of percent CGRP labeling within total HuC/D area for each genotype class. Each dot represents average values for an independent embryo measured from six pelvic ganglia sections. Average ± SEM (red lines). * p<0.05; **p<0.01.
Figure 7.
Figure 7.. Constitutive Pax3Spd mutation disrupts development of noradrenergic neurons in fetal pelvic ganglia.
Confocal images of cryosections through 14.5 dpc PG stained for noradrenergic neurons (TH+) relative to total HuC/D staining reveals that this neuron subtype is present although at reduced frequency in Pax3Sp-d/Sp-d mutant PG in contrast to the complete absence of CGRP+ neurons.
Figure 8.
Figure 8.. Pax3 mutations in mice alter fetal bladder wall nerve fiber density and extent of innervation.
(A) Example image of nerve fiber quantitation in a sagittal cryosection through Pax3+/+ 14.5 dpc bladder. Sections selected for presence of the bladder-ureteral reflection (BUR) and the pubic symphysis (PS) provided comparable anatomical planes. Pixel density in circular selections (blue) at anterior (a), posterior (p), and bladder dome (bd) were quantified. Directionality of anterior (A), dorsal (D), ventral (V), and posterior (P) are indicated. (B) Plot of CGRP+ nerve fiber density across genotype classes identifies significant difference for Pax3Sp-d/Sp-d mutants only in anterior regions. Each dot represents average values for independnt embryos (n=4) measured from five pelvic ganglia sections. Average ± SEM (red lines). *p<0.05. (C) Image illustrating measurement of the extent of bladder innervation as a function of overall bladder length. Perpendicular line drawn from the BUR-PS axis midpoint (orange line) to the bladder dome (blue line) defines bladder length compared to the furthest extent of CGRP+ fibers in the anterior bladder wall (white line). (D) Plot of CGRP+/bladder length ratio for all Pax3 genotype classes. Each dot represents one animal (n=3-4) measured from five sections. Average ± SEM (red lines). Significant differences in the CGRP/bladder length ratio were found between all genotypes when compared to Pax3Sp-d/Sp-d embryos; *p<0.05; ***p<0.001. Abbreviations: BUR, bladder-ureteral reflection; PS, pubic symphysis.
Figure 9.
Figure 9.. Pax3Sp-d/Δ5 mice survive postnatally and exhibit NC phenotypes.
(A) Pax3Sp-d/Δ5 mice show deficits in multiple NC-derived cell types including pigmentation deficits (melanocytes) and micrognathia with malocclusion (craniofacial). (B) Body weights of Pax3 variant mice. Pax3Sp-d/Δ5 mutants of both sexes weigh significantly less than littermates. * p<0.05; **p<0.01; ***p<0.001.
Figure 10.
Figure 10.. Urination patterns are altered in Pax3Sp-d/Δ5 male mice.
(A) Plot of average voiding frequency (number of individual voids over the testing period) assessed by VSA in male and female 4-week old mice. (B) Plot of average total area of all urine spots summed for the assay period. Pax3Sp-d/Δ5 males void significantly smaller area of urine than Pax3+/+ littermates. (C) Plot of average largest void spot for all genotype classes. Primary void spots are significantly smaller for Pax3Sp-d/Δ5 males than Pax3+/+ (p≤0.005). Black dots represent different individual animals within each genotype class. Average ± SEM (red lines). n=15 for all genotypes in each plot. *p ≤ 0.05, ** p ≤ 0.01
Figure 11.
Figure 11.. Alterations in Pax3 affect interganglionic and bladder wall nerve fiber density in postnatal mice.
(A) Fluorescent whole mount image of Sox10-cre,ROSATom bladder that relied on Tomato fluorescence to quantify neural projections. Pixel density was measured along a line (dotted orange) at 25, 50, 75, and 100% increments of a rectangle drawn to span the width between and extended towards the bladder dome. (B) Tabulated summary of bladder innervation density for Pax3 variant genotype classes and sexes (n=4 per genotype per sex). Boldface percentages indicate values that differ significantly from wild type (p<0.05) based on a post-hoc test conducted with Tukey’s HSD. (C) High magnification image of the bladder neck region used to assess interganglionic fiber density based on Tomato fluorescence. Segment drawn connecting the PG centers with a perpendicular line was placed at the midpoint, extending across the interganglionic fibers. Pixel density along perpendicular line (orange) was used to assess fiber density. (D, D’) Plots of fiber connection density for males and females (n=4 per class). Each dot represents a single animal. Average ± SEM (red lines). Post-hoc test conducted with Tukey’s HSD (**, p<0.005, ***, p<0.0005). Abbreviations: ag, accessory ganglia.

Similar articles

Cited by

References

    1. Anderson RB, Stewart AL, Young HM, 2006. Phenotypes of neural-crest-derived cells in vagal and sacral pathways. Cell Tissue Res 323, 11–25. - PubMed
    1. Arellano J, Xelhuantzi N, Mirto N, Hernandez ME, Cruz Y, 2019. Neural interrelationships of autonomic ganglia from the pelvic region of male rats. Auton Neurosci 217, 26–34. - PubMed
    1. Barber TD, Barber MC, Tomescu O, Barr FG, Ruben S, Friedman TB, 2002. Identification of target genes regulated by PAX3 and PAX3-FKHR in embryogenesis and alveolar rhabdomyosarcoma. Genomics 79, 278–284. - PubMed
    1. Bjorling DE, Wang Z, Vezina CM, Ricke WA, Keil KP, Yu W, Guo L, Zeidel ML, Hill WG, 2015. Evaluation of voiding assays in mice: impact of genetic strains and sex. Am J Physiol Renal Physiol 308, F1369–1378. - PMC - PubMed
    1. Borycki AG, Li J, Jin F, Emerson CP, Epstein JA, 1999. Pax3 functions in cell survival and in pax7 regulation. Development 126, 1665–1674. - PubMed

Publication types

MeSH terms

Substances

LinkOut - more resources