

Native cyclase-associated protein and actin from Xenopus laevis oocytes form a unique 4:4 complex with a tripartite structure
- PMID: 33839148
- PMCID: PMC8113726
- DOI: 10.1016/j.jbc.2021.100649
Native cyclase-associated protein and actin from Xenopus laevis oocytes form a unique 4:4 complex with a tripartite structure
Abstract
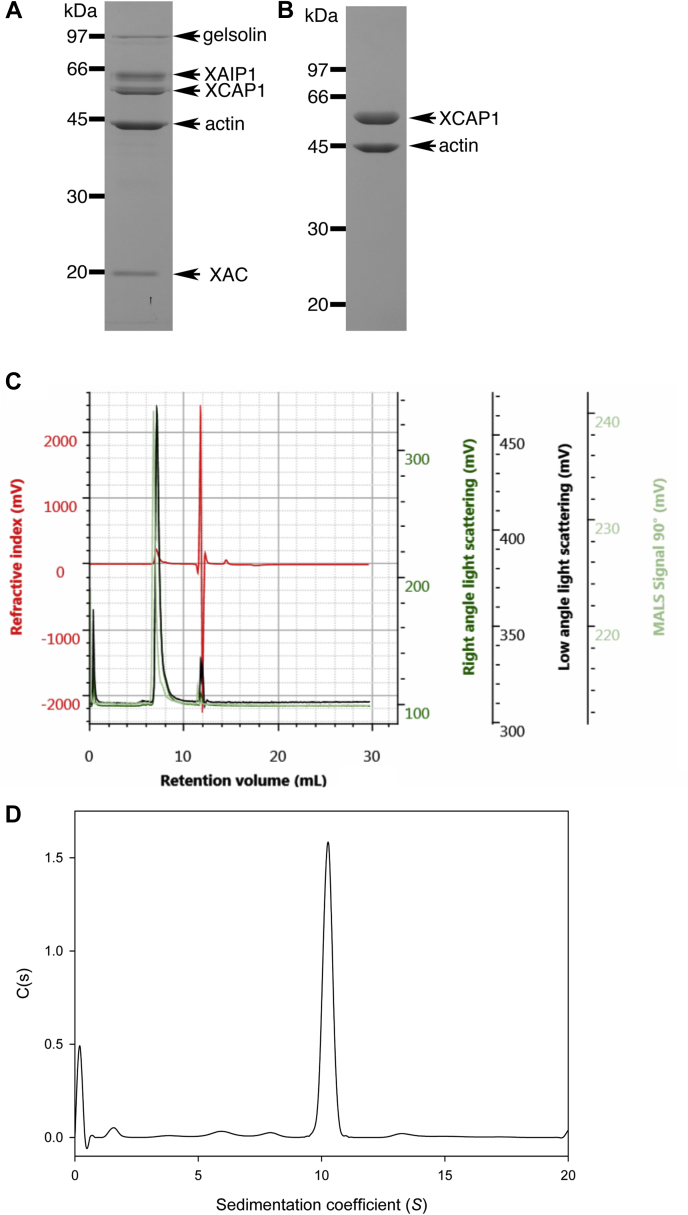
Cyclase-associated protein (CAP) is a conserved actin-binding protein that regulates multiple aspects of actin dynamics, including polymerization, depolymerization, filament severing, and nucleotide exchange. CAP has been isolated from different cells and tissues in an equimolar complex with actin, and previous studies have shown that a CAP-actin complex contains six molecules each of CAP and actin. Intriguingly, here, we successfully isolated a complex of Xenopus cyclase-associated protein 1 (XCAP1) with actin from oocyte extracts, which contained only four molecules each of XCAP1 and actin. This XCAP1-actin complex remained stable as a single population of 340 kDa species during hydrodynamic analyses using gel filtration or analytical ultracentrifugation. Examination of the XCAP1-actin complex by high-speed atomic force microscopy revealed a tripartite structure: one middle globular domain and two globular arms. The two arms were observed in high and low states. The arms at the high state were spontaneously converted to the low state by dissociation of actin from the complex. However, when extra G-actin was added, the arms at the low state were converted to the high state. Based on the known structures of the N-terminal helical-folded domain and C-terminal CARP domain, we hypothesize that the middle globular domain corresponds to a tetramer of the N-terminal helical-folded domain of XCAP1 and that each arm in the high state corresponds to a heterotetramer containing a dimer of the C-terminal CARP domain of XCAP1 and two G-actin molecules. This novel configuration of a CAP-actin complex should help to understand how CAP promotes actin filament disassembly.
Keywords: Xenopus; actin; atomic force microscopy (AFM); cyclase-associated protein; cytoskeleton; protein complex.
Copyright © 2021 The Authors. Published by Elsevier Inc. All rights reserved.
Conflict of interest statement
Conflict of interest The authors declare no conflict of interest.
Figures


Similar articles
-
Actin monomers influence the interaction between Xenopus cyclase-associated protein 1 and actin filaments.bioRxiv [Preprint]. 2025 Aug 15:2025.08.14.670363. doi: 10.1101/2025.08.14.670363. bioRxiv. 2025. PMID: 40832179 Free PMC article. Preprint.
-
Structure and mechanism of mouse cyclase-associated protein (CAP1) in regulating actin dynamics.J Biol Chem. 2014 Oct 31;289(44):30732-30742. doi: 10.1074/jbc.M114.601765. Epub 2014 Sep 16. J Biol Chem. 2014. PMID: 25228691 Free PMC article.
-
The role of cyclase-associated protein in regulating actin filament dynamics - more than a monomer-sequestration factor.J Cell Sci. 2013 Aug 1;126(Pt 15):3249-58. doi: 10.1242/jcs.128231. J Cell Sci. 2013. PMID: 23908377 Free PMC article. Review.
-
The C-terminal dimerization motif of cyclase-associated protein is essential for actin monomer regulation.Biochem J. 2016 Dec 1;473(23):4427-4441. doi: 10.1042/BCJ20160329. Epub 2016 Oct 11. Biochem J. 2016. PMID: 27729544 Free PMC article.
-
Contractile ring formation in Xenopus egg and fission yeast.Cell Struct Funct. 2001 Dec;26(6):545-54. doi: 10.1247/csf.26.545. Cell Struct Funct. 2001. PMID: 11942608 Review.
Cited by
-
Spatiotemporal resolution in high-speed atomic force microscopy for studying biological macromolecules in action.Microscopy (Oxf). 2023 Apr 6;72(2):151-161. doi: 10.1093/jmicro/dfad011. Microscopy (Oxf). 2023. PMID: 36744614 Free PMC article. Review.
-
The actin filament pointed-end depolymerase Srv2/CAP depolymerizes barbed ends, displaces capping protein, and promotes formin processivity.Proc Natl Acad Sci U S A. 2025 Feb 4;122(5):e2411318122. doi: 10.1073/pnas.2411318122. Epub 2025 Jan 28. Proc Natl Acad Sci U S A. 2025. PMID: 39874286 Free PMC article.
-
Actin monomers influence the interaction between Xenopus cyclase-associated protein 1 and actin filaments.bioRxiv [Preprint]. 2025 Aug 15:2025.08.14.670363. doi: 10.1101/2025.08.14.670363. bioRxiv. 2025. PMID: 40832179 Free PMC article. Preprint.
-
Extracellular Vesicles Contribute to the Metabolism of Transthyretin Amyloid in Hereditary Transthyretin Amyloidosis.Front Mol Biosci. 2022 Mar 23;9:839917. doi: 10.3389/fmolb.2022.839917. eCollection 2022. Front Mol Biosci. 2022. PMID: 35402512 Free PMC article.
-
Dynamic remodeling of actin networks by cyclase-associated protein and CAP-Abp1 complexes.Curr Biol. 2023 Oct 23;33(20):4484-4495.e5. doi: 10.1016/j.cub.2023.09.032. Epub 2023 Oct 4. Curr Biol. 2023. PMID: 37797614 Free PMC article.
References
-
- Field J., Vojtek A., Ballester R., Bolger G., Colicelli J., Ferguson K., Gerst J., Kataoka T., Michaeli T., Powers S., Riggs M., Rodgers L., Wieland I., Wheland B., Wigler M. Cloning and characterization of CAP, the S. cerevisiae gene encoding the 70 kd adenylyl cyclase-associated protein. Cell. 1990;61:319–327. - PubMed
-
- Fedor-Chaiken M., Deschenes R.J., Broach J.R. SRV2, a gene required for RAS activation of adenylate cyclase in yeast. Cell. 1990;61:329–340. - PubMed
Publication types
MeSH terms
Substances
Grants and funding
LinkOut - more resources
Full Text Sources
Other Literature Sources
Research Materials
Miscellaneous
