. 2021 Apr;23(4):415-428.
doi: 10.1016/j.neo.2021.03.006. Epub 2021 Apr 8.

Trop-2 cleavage by ADAM10 is an activator switch for cancer growth and metastasis

Affiliations

Trop-2 cleavage by ADAM10 is an activator switch for cancer growth and metastasis

Marco Trerotola et al. Neoplasia. 2021 Apr.

Abstract

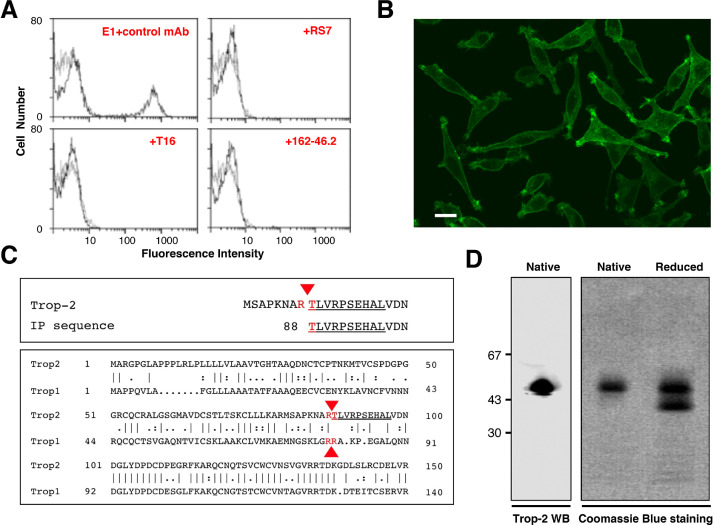
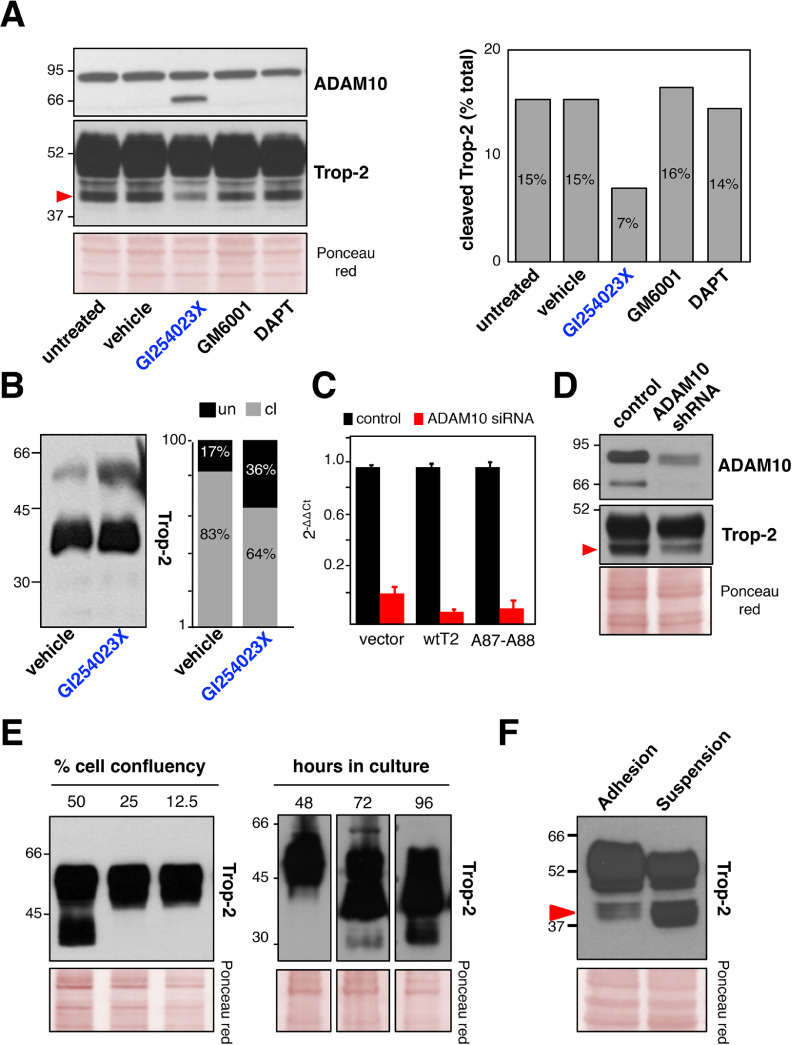
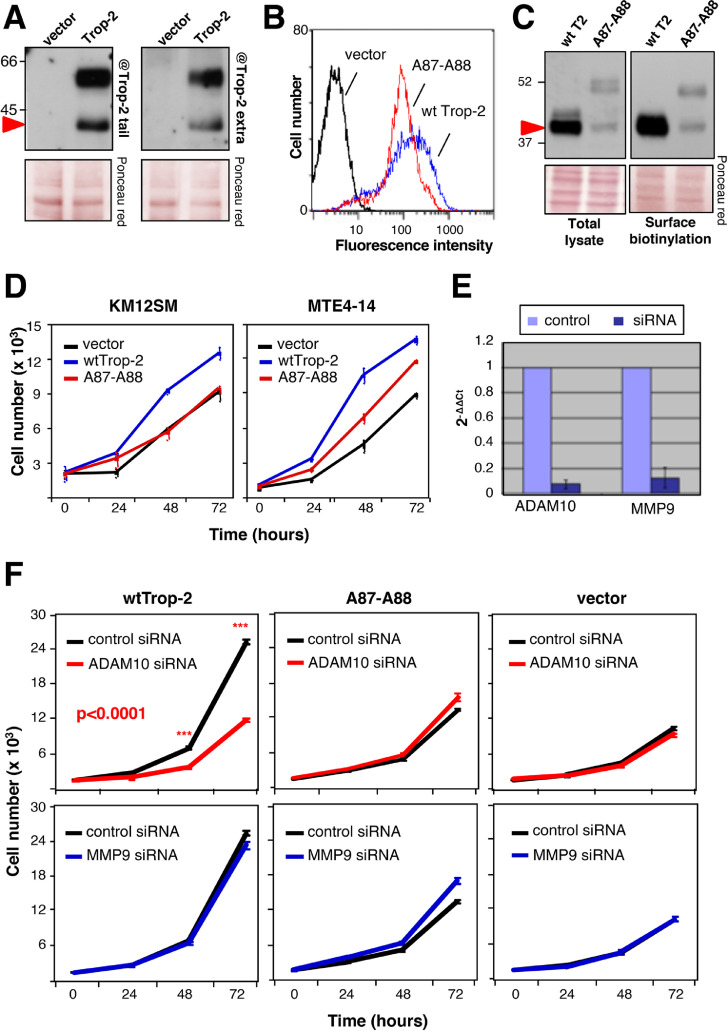
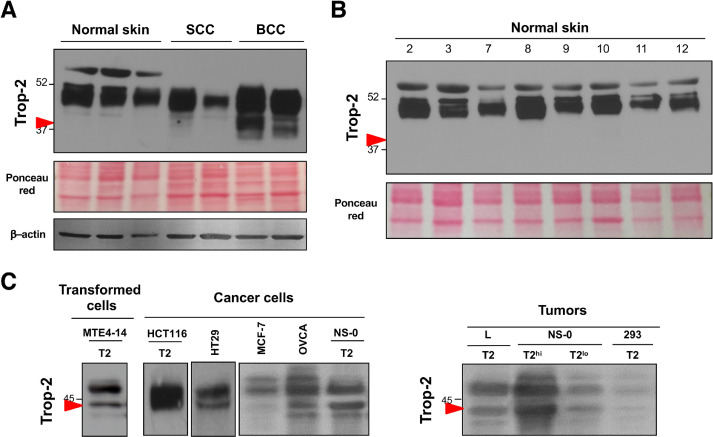
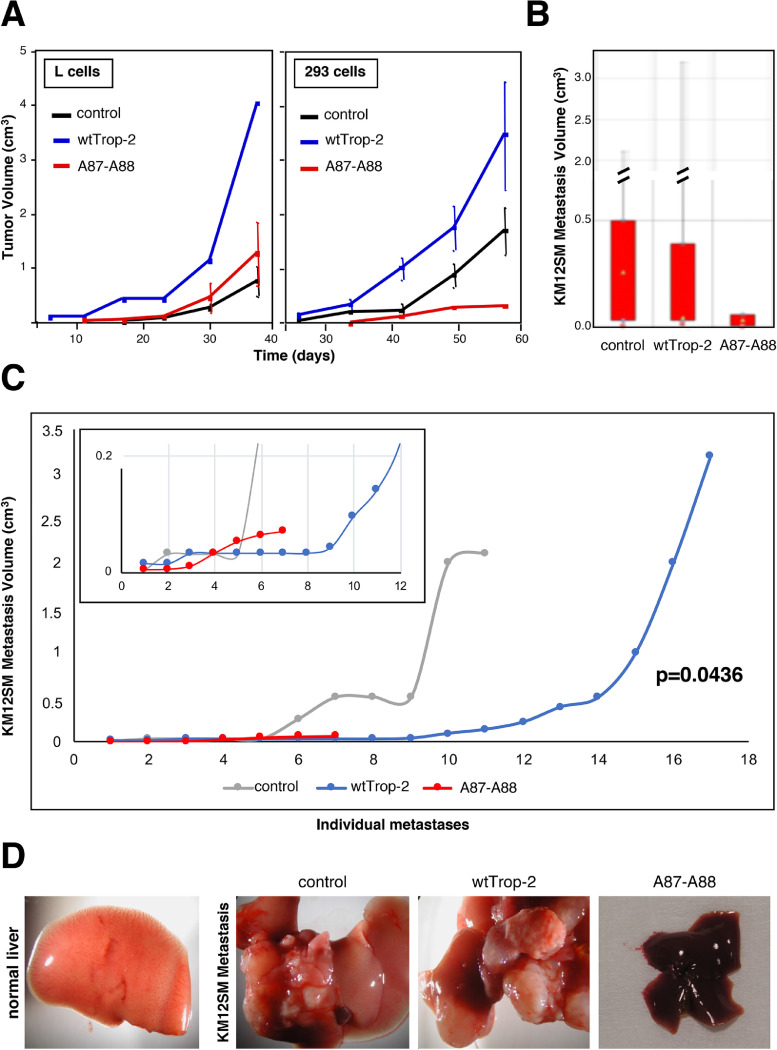
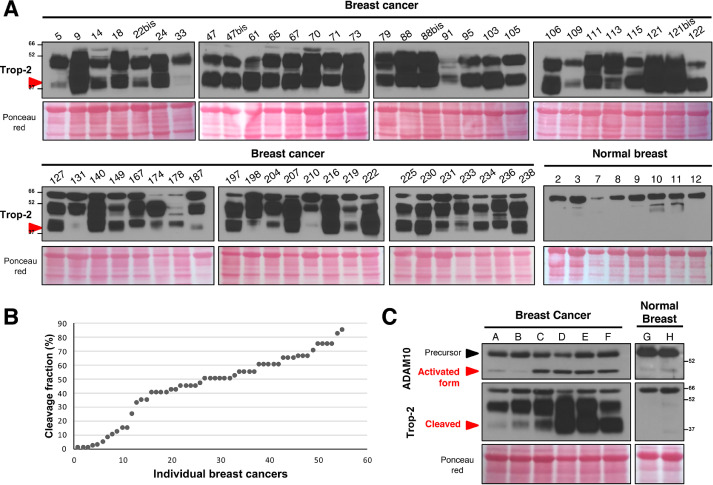
Trop-2 is a transmembrane signal transducer that can induce cancer growth. Using antibody targeting and N-terminal Edman degradation, we show here that Trop-2 undergoes cleavage in the first thyroglobulin domain loop of its extracellular region, between residues R87 and T88. Molecular modeling indicated that this cleavage induces a profound rearrangement of the Trop-2 structure, which suggested a deep impact on its biological function. No Trop-2 cleavage was detected in normal human tissues, whereas most tumors showed Trop-2 cleavage, including skin, ovary, colon, and breast cancers. Coimmunoprecipitation and mass spectrometry analysis revealed that ADAM10 physically interacts with Trop-2. Immunofluorescence/confocal time-lapse microscopy revealed that the two molecules broadly colocalize at the cell membrane. We show that ADAM10 inhibitors, siRNAs and shRNAs abolish the processing of Trop-2, which indicates that ADAM10 is an effector protease. Proteolysis of Trop-2 at R87-T88 triggered cancer cell growth both in vitro and in vivo. A corresponding role was shown for metastatic spreading of colon cancer, as the R87A-T88A Trop-2 mutant abolished xenotransplant metastatic dissemination. Activatory proteolysis of Trop-2 was recapitulated in primary human breast cancers. Together with the prognostic impact of Trop-2 and ADAM10 on cancers of the skin, ovary, colon, lung, and pancreas, these data indicate a driving role of this activatory cleavage of Trop-2 on malignant progression of tumors.

Keywords: Cell growth; Human cancer; Molecular modeling; Proteolytic processing; Signaling activation; Trop.


Figures

Fig. 1
Fig. 1
Purification, sequencing and analysis of Trop-2. (A) Reconstituted mixtures of 70% parental L cells and 30% Trop-2/L cells transfectants were used for competition studies of E1 with other anti-Trop-2 mAbs. Cell mixtures were stained with the FITC-E1 mAb. Competition of E1 with other anti-Trop-2 mAbs was performed by incubating cell mixtures with 100-fold excess of the indicated ascites (red). Successful competition was revealed by the disappearance of the peak of stained cells, indicating that the E1 binding site is the same as, or is in close proximity to, that of the competing Abs. E1 was efficiently competed-out by the anti-Trop-2 162-46.2 antibody , the T16 mAb and the RS7-3G11 mAb, from which the humanized anti-Trop-2 therapeutic IMMU132 was derived . (B) Reactivity of the E1 mAb with Trop-2. Immunofluorescence microscopy analysis of FITC-E1-stained TROP2/L cell transfectants. (C, top) Alignment of the amino-acid sequence obtained by Edman degradation (underlined) with the canonical Trop-2 sequence. Red arrowhead: cleavage site. (C, bottom) Alignment of the proteolytic sites of Trop-2 and Trop-1 (red arrows). The Edman degradation sequence of E1/Trop-2 is underlined. (D, left) Western blotting of Trop-2, as immunoprecipitated from ovarian cancer cells and purified by affinity chromatography over Sepharose–E1 mAb. Purified Trop-2 was run in SDS-PAGE under native (nonreducing) conditions. (D, right) Coomassie blue staining of purified Trop-2 protein run in SDS-PAGE gradient gel under native or reducing conditions. (Colored version of figure is available online.)
Fig. 2
Fig. 2
Trop-2 cleavage by ADAM10. (A) Inhibition of ADAM10 activity by treatment of BxPC3 cells with chemical inhibitors. Western blot detections of ADAM10 (top) and Trop-2 (bottom) show accumulation of the mature ADAM10 and corresponding reduction of the 40-kD Trop-2 cleavage band only upon treatment with GI254023X (blue). Quantification of the 40-kD Trop-2 cleavage band upon treatment with protease inhibitors is shown on the right, as percentage of total Trop-2. Ponceau red staining, control of protein loading. (B) Reduction of Trop-2 cleavage upon treatment of MTE4-14/Trop-2 transfectants with the ADAM10 inhibitor GI254023X (blue). Quantification of the Trop-2 cleavage band was carried out, and the ratio between uncleaved (un, black) versus cleaved (cl, gray) Trop-2 is shown on the right panel. (C) ADAM10 mRNA levels (red) 48 h upon treatment with ADAM10 siRNA or control siRNA (human CD133) (black). Vector: vector-alone transfectants; A87-A88: mutagenized Trop-2 at the cleavage site. The 2−ΔΔCT algorithm was used to calculate the relative changes in gene expression. RNA levels of ADAM10 in Vector, wt Trop-2 and A87-A88 Trop-2 cells are shown here for cell group cross-comparison, and are intended as reference data for the functional assays shown in the next figures. (D) ADAM10 protein inhibition by shRNA (top). Corresponding reduction of the Trop-2 cleavage is shown (mid). Ponceau red staining, control of protein loading (bottom). (E) Western blotting of Trop-2 cleavage in MTE 4-14/Trop-2 transfectants. (left) Cells were seeded at the indicated fraction of full confluency, as normalized to 100%, or (right) cells were seeded at equal confluency and then lysed at different subsequent time points. Ponceau red staining, control of protein loading. MW markers are indicated. (F) Western blotting of MCF7 human breast cancer cells grown in adhesion or in suspension and lysed 5 d after seeding for analysis of the Trop-2 cleavage. Red arrow shows cleaved Trop-2. Ponceau red staining, control of protein loading. MW markers are indicated. (Color version of figure is available online.)
Fig. 3
Fig. 3
Trop-2 proteolytic processing-defective mutant versus wild-type. (A) Western blotting analysis of KM12SM/Trop-2 transfectants was carried out using anti-Trop-2 antibodies against the cytoplasmic tail and extracellular domain, as indicated. The Trop-2 bands were recognized by both antiextracellular domain and anticytoplasmic tail antibodies, indicating that the Trop-2 signal belongs to transmembrane forms. Red arrow, cleaved Trop-2. Vector, vector-alone transfectants. Ponceau red staining, control of protein loading. MW markers are indicated. (B) Flow cytometry analysis of MTE 4-14/Trop-2 transfectants using the T16 anti-Trop-2 antibody. The A87-A88 Trop-2 mutant (red) and wt Trop-2 (blue) are expressed at comparable levels. Vector: vector-alone transfectants. (C) Trop-2 cleavage at the cell surface. Trop-2 cleavage was assessed upon cell-surface biotinylation on KM12SM metastatic colon cancer cells. Pull-down after cell-surface biotinylation was carried out to reveal the status of Trop-2 at the cell membrane. (left) total cell lysate, (right) cell membrane pulled-down material. Western blotting analysis was carried out with a rabbit polyclonal antibody directed against the extracellular domain of Trop-2, and shows that wt Trop-2 is completely cleaved. Quantitative cleavage reduction was observed for the A87-A88 proteolytic site mutant. Red arrow, cleaved Trop-2. Ponceau red staining, control of protein loading. MW markers are indicated. (D) Growth curves in vitro of KM12SM human colon cancer cells and MTE4-14 murine cells transfected with wt Trop-2 versus A87-A88 Trop-2 mutant. Bars, standard errors of the mean (SEM). (E) ADAM10 (left) and MMP9 (right) reduced RNA levels by siRNAs, as measured by real-time RT-PCR. (F) Cell growth curves of wt Trop-2, A87-A88 Trop-2 or vector-alone transfectants upon ADAM10 (red), MMP9 (blue) or control (black) siRNA-mediated inhibition. Bars, SEM. P value (ADAM10, left panel): ANOVA analysis. Stars indicate post-hoc Bonferroni's t test P values (***, P ≤ 0.001). (Color version of figure is available online.)
Fig. 4
Fig. 4
Proteolytic processing of Trop-2 in tumor cells. (A) Western blotting analysis of Trop-2 cleavage in normal epidermal cells and skin tumors (SCC, squamous cell carcinoma; BCC, basal cell carcinoma). Red arrow, cleaved Trop-2. MW markers are indicated. Ponceau red staining and western blotting for β-actin were used as controls of protein loading. (B) Western blotting analysis of Trop-2 cleavage in normal skin samples. Red arrow, absence of Trop-2 cleavage at R87-T88. MW markers are indicated. Ponceau red staining, control of protein loading. (C) Trop-2 cleavage patterns in vitro and in vivo. Western blotting of transformed MTE4-14/Trop-2 transfectants and cancer cells either transfected with or endogenously expressing Trop-2 as indicated, grown in culture (left) or as tumors in nude mice (right). T2: TROP2-transfected cells; T2hi, T2lo: TROP2-transfected NS-0 cells selected to express TROP2 at high or low levels, respectively. Red arrow, cleaved Trop-2. (Color version of figure is available online.)
Fig. 5
Fig. 5
Tumor growth and metastasis dissemination require Trop-2 cleavage. (A) Tumor growth curves of L murine fibrosarcoma and 293 transformed human kidney cells, transfected with wt Trop-2 or A87-A88 Trop-2. Bars, SEM. N = 4 per experimental group. Subcutaneous tumor growth curves were obtained by weekly measurements of tumor volumes (d2 x D/2), followed by normalization on a group-by-group basis, and computation. (B) Boxplot analysis of KM12SM liver metastasis volume. The lowest median in the mutant set of data, together with the lowest max and minimum values of metastasis volume in mutant, processing-less Trop-2 are shown. N = 37 mice were injected with KM12SM/vector control cells, N=34 were injected with the KM12SM/Trop-2 transfectants and N = 13 were injected with the KM12SM/A87-A88 Trop-2 transfectants, i.e. expressing the cleavage-resistant R87-T88 Trop-2 mutant. (C) Individual KM12SM metastasis volume distribution curves. Gray: control metastases; Blue: wt Trop-2 metastases; Red: proteolytic mutant metastases. The distribution and correlated mutant liver metastases versus vector alone control cells and wt Trop-2 transfectants were statistically assessed by Mann-Whitney non-parametric test. This showed a significant reduction of volumes in the mutant transfectant metastases versus wt Trop-2 (P value = 0.0436), consistent with the loss of the Trop-2 activation path. (D) Macroscopic assessment of normal liver, control KM12SM liver metastasis, and of metastasis by wt Trop-2 or proteolytic mutant Trop-2 colon cancer transfectants.
Fig. 6
Fig. 6
Breast cancer case series. (A) Frozen samples from a consecutive breast cancer case series were analyzed for Trop-2 expression and cleavage by Western blotting. Western blot lanes bear the original patient number in the case series. The latin “bis” indication refers to a second sampling of the same tumor case, upon local relapse. Red arrow: cleaved Trop-2. Ponceau red staining, control of protein loading. MW markers are indicated. The bottom right panel shows a Western blotting analysis of Trop-2 expression and cleavage in normal breast tissue samples from control individuals. (B) Distribution of the fraction of cleaved Trop-2 molecules in individual breast cancer samples, ordered from low to high Trop-2 cleavage. (C) Western blotting analysis of ADAM10 expression and of Trop-2 cleavage in samples from breast cancer and normal breast tissues. The samples were pooled from the individual cases shown in the panel A as based on the extent of Trop-2 cleavage. The pools are as follows: A = 5+22+78+109+187; B = 113+131+174+187+204; C = 78+131+198+231+233; D = 9+18+24+47+61; E = 65+67+70+73+88; F = 95+103+106+115+122; G = 2+8+12; H = 3+7+9. ADAM10 was detected as bands at 55-50 kDa, designated as precursor and activated forms of the protein. Red arrow: presence/absence of Trop-2 cleavage at R87-T88. (Color version of figure is available online.)

References

    1. Ripani E, Sacchetti A, Corda D, Alberti S. The human Trop-2 is a tumor-associated calcium signal transducer. Int J Cancer. 1998;76:671–676. - PubMed
    1. Basu A, Goldenberg DM, Stein R. The epithelial/carcinoma antigen EGP-1, recognized by monoclonal antibody RS7-3G11, is phosphorylated on serine 303. Int J Cancer. 1995;62:472–479. - PubMed
    1. Klein CE, Hartmann B, Schön MP, Weber L, Alberti S. Expression of 38-kD cell-surface glycoprotein in transformed human keratinocyte cell lines, basal cell carcinomas, and epithelial germs. J Invest Dermatol. 1990;95:74–82. - PubMed
    1. Alberti S, Miotti S, Stella M, Klein CE, Fornaro M, Ménard S, Colnaghi MI. Biochemical characterization of Trop-2, a cell surface molecule expressed by human carcinomas: formal proof that the monoclonal antibodies T16 and MOv-16 recognize Trop-2. Hybridoma. 1992;11:539–545. - PubMed
    1. Calabrese G, Crescenzi C, Morizio E, Palka G, Guerra E, Alberti S. Assignment of TACSTD1 (alias TROP1, M4S1) to human chromosome 2p21 and refinement of mapping of TACSTD2 (alias TROP2, M1S1) to human chromosome 1p32 by in situ hybridization. Cytogenet Cell Genet. 2001;92:164–165. - PubMed

Publication types

MeSH terms