. 2021 Aug;11(8):2094-2111.
doi: 10.1158/2159-8290.CD-20-1228. Epub 2021 Apr 10.

Oncogenic KRAS Recruits an Expansive Transcriptional Network through Mutant p53 to Drive Pancreatic Cancer Metastasis

Affiliations

Oncogenic KRAS Recruits an Expansive Transcriptional Network through Mutant p53 to Drive Pancreatic Cancer Metastasis

Michael P Kim et al. Cancer Discov. 2021 Aug.

Abstract

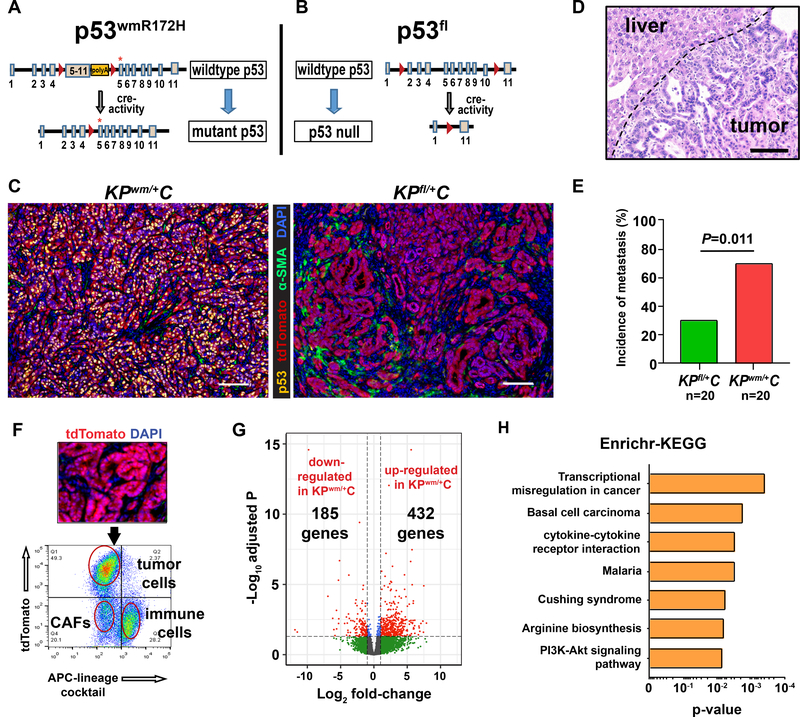
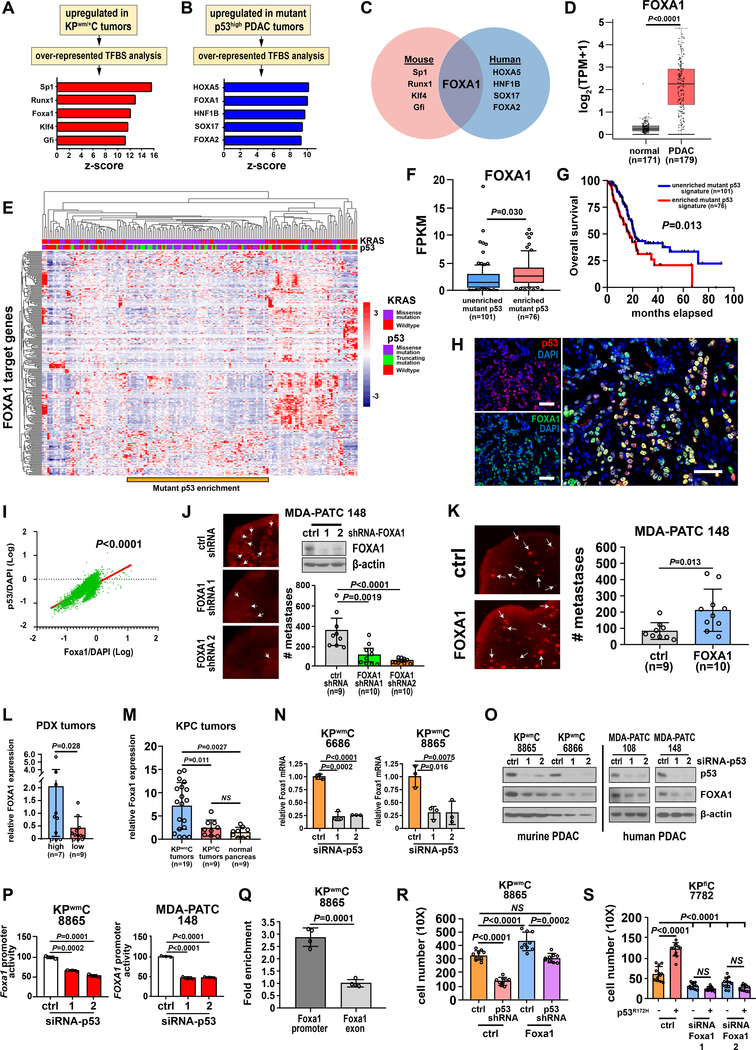
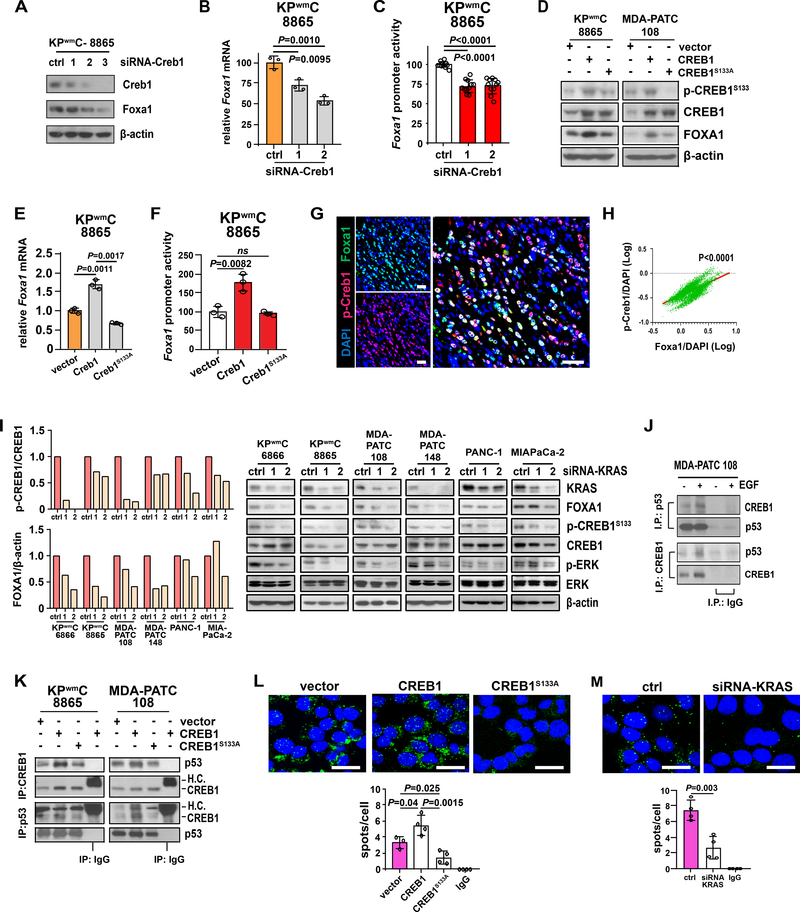
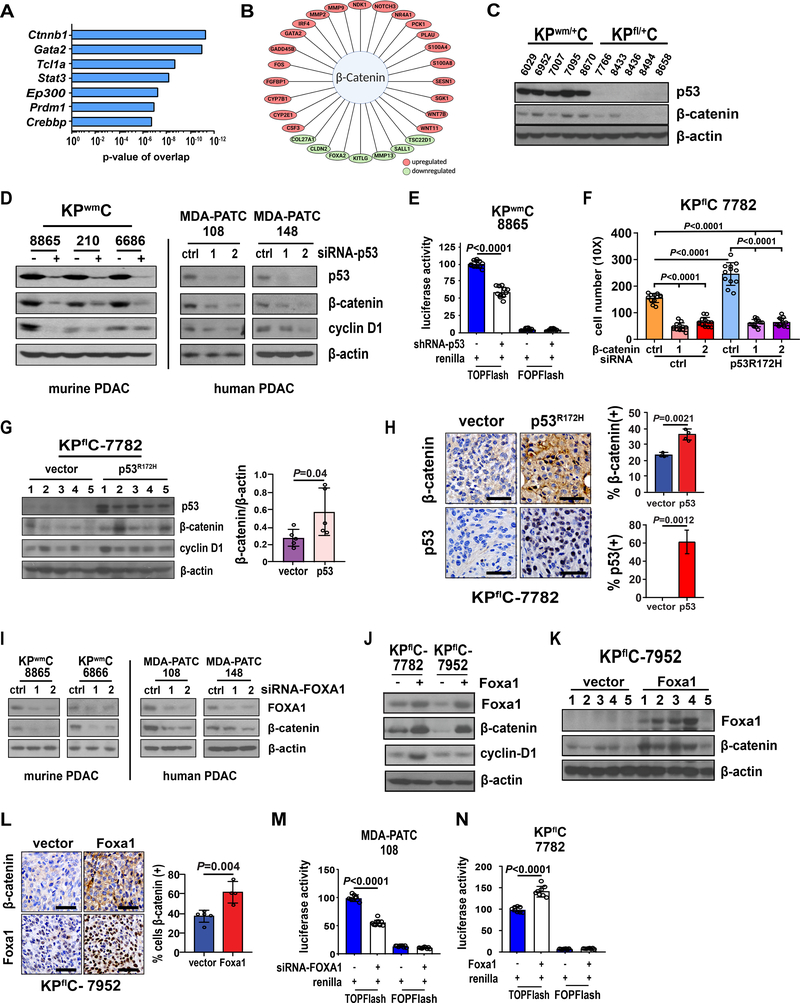
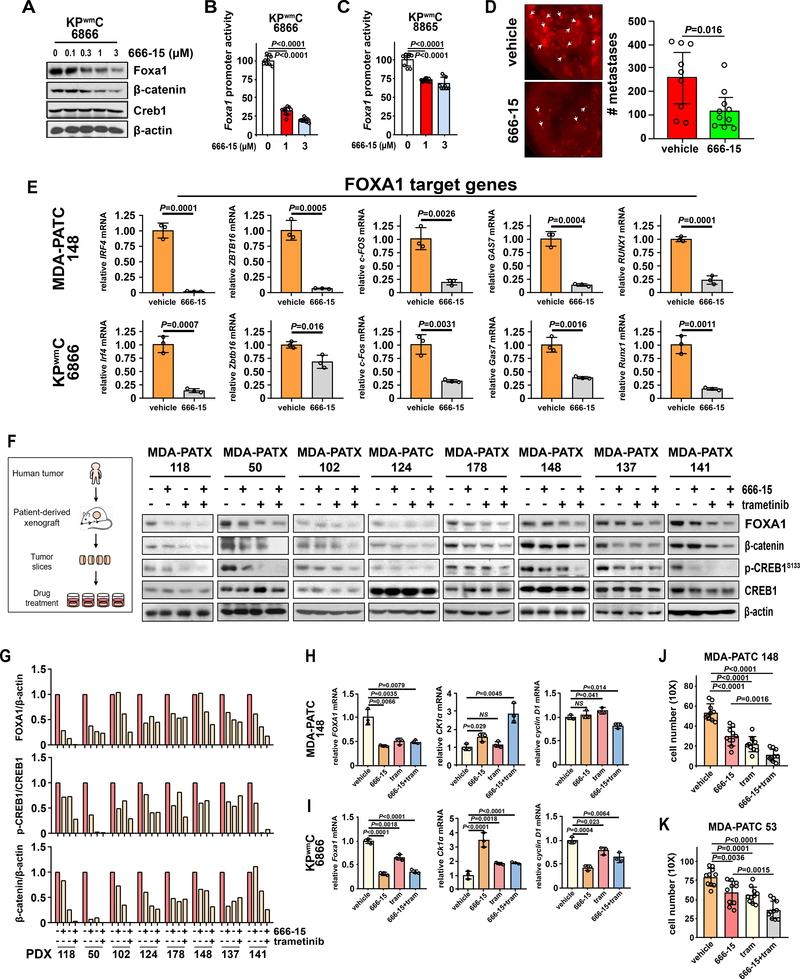
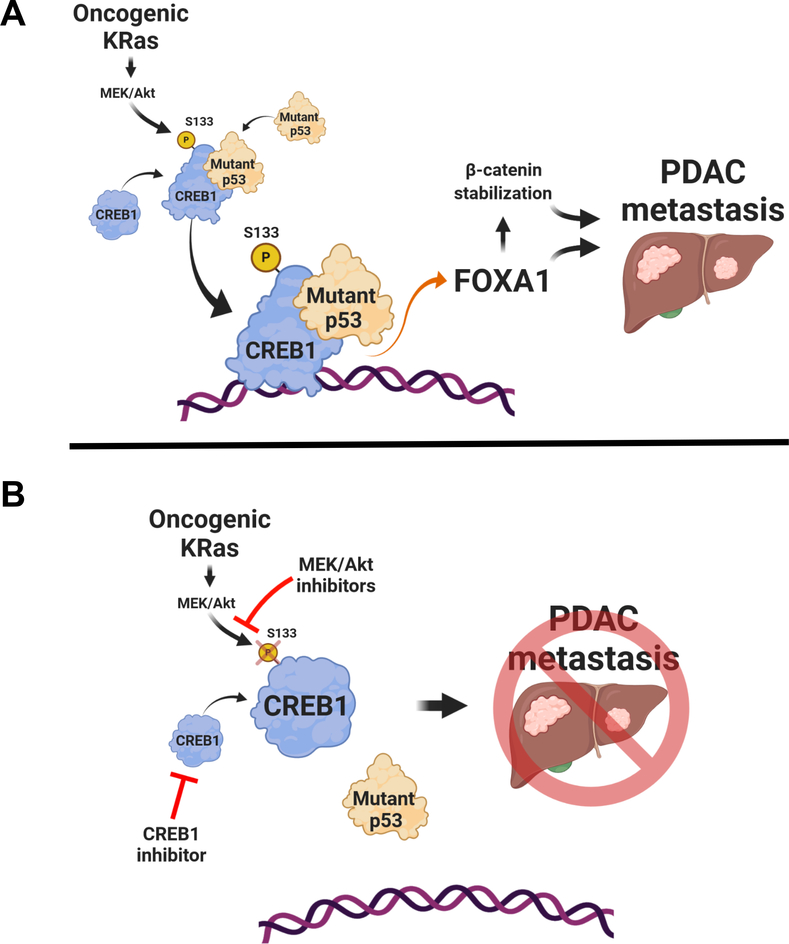
Pancreatic ductal adenocarcinoma (PDAC) is almost uniformly fatal and characterized by early metastasis. Oncogenic KRAS mutations prevail in 95% of PDAC tumors and co-occur with genetic alterations in the TP53 tumor suppressor in nearly 70% of patients. Most TP53 alterations are missense mutations that exhibit gain-of-function phenotypes that include increased invasiveness and metastasis, yet the extent of direct cooperation between KRAS effectors and mutant p53 remains largely undefined. We show that oncogenic KRAS effectors activate CREB1 to allow physical interactions with mutant p53 that hyperactivate multiple prometastatic transcriptional networks. Specifically, mutant p53 and CREB1 upregulate the prometastatic, pioneer transcription factor FOXA1, activating its transcriptional network while promoting WNT/β-catenin signaling, together driving PDAC metastasis. Pharmacologic CREB1 inhibition dramatically reduced FOXA1 and β-catenin expression and dampened PDAC metastasis, identifying a new therapeutic strategy to disrupt cooperation between oncogenic KRAS and mutant p53 to mitigate metastasis. SIGNIFICANCE: Oncogenic KRAS and mutant p53 are the most commonly mutated oncogene and tumor suppressor gene in human cancers, yet direct interactions between these genetic drivers remain undefined. We identified a cooperative node between oncogenic KRAS effectors and mutant p53 that can be therapeutically targeted to undermine cooperation and mitigate metastasis.This article is highlighted in the In This Issue feature, p. 1861.


Conflict of interest statement

Disclosure statement: The authors declare no potential conflicts of interest.

Figures

Figure 1.
Figure 1.. Mutant p53 augments PDAC metastasis.
A, The KPwm/+C mouse model incorporates a mutant p53 allele that converts from constitutive wildtype p53 to mutant p53R172H expression after cre-mediated recombination. Mutant p53R172H is somatically expressed in pancreatic epithelial cells and wildtype p53 is expressed in stromal cells present in the TME. B, The KPfl/+C mouse model incorporates a loss-of-function p53 allele with loxP sites flanking exons 2–11. Wildtype p53 is somatically deleted in pancreatic epithelial cells following cre-recombination and wildtype p53 is expressed in stromal cells present in the TME. C, Mutant p53 is expressed and stabilized in pancreatic tumor cells in KPwm/+C mice. Wildtype p53 expression is lost in pancreatic tumor cells in KPfl/+C mice. Scale bar, 250μM. D, Representative histology of a liver metastasis in a KPwm/+C mouse. Scale bar, 250μM. E, The incidence of liver or lung metastasis in KPwm/+C and KPfl/+C PDAC models. P value determined by unpaired two-tailed t-test. F, Single tumor cells from KPwm/+C and KPfl/+C mice were positively selected by FACS based on a tdTomato reporter. G, Volcano plot of genes differentially expressed in enriched PDAC cell populations in KPwm/+C (n=4) versus KPfl/+C (n=4) mice. H, Enrichr-KEGG analysis of KPwm/+C tumors demonstrates enriched transcriptional misregulation in cancer.
Figure 2.
Figure 2.. Mutant p53 is associated with a FOXA1 transcriptional signature and regulates FOXA1 to drive PDAC cell metastasis.
A, Overrepresented, conserved transcription factor binding site (TFBS) motifs in genes differentially upregulated in KPwm/+C (n=4) versus KPfl/+C (n=4) mice. B, Overrepresented, conserved TFBS motifs in genes differentially expressed in p53high (n=19) versus p53low (n=11) PDAC PDX tumors. C, Overlap of overrepresented TFBS motifs enriched in mutant p53 tumors in murine and human PDAC. D, Comparison of FOXA1 expression in normal pancreas and PDAC using the TCGA dataset. P value calculated by one-way ANOVA. E, Non-hierarchal clustering of genes upregulated in KPwm/+C tumors with FOXA1 binding motifs within the TCGA PDAC dataset. Relative to patients harboring truncating p53 mutations, patients with p53 missense mutations significantly clustered with oncogenic KRAS (Fisher exact test, p<0.0001). A distinct gene expression signature corresponds to this region as generated through listing FOXA1 target genes. F, Comparison of FOXA1 expression within and external to the region of mutant p53 enrichment. G, Overall survival of patients within and external to the region of mutant p53 enrichment that clusters with oncogenic KRAS. H, Representative spatial co-expression of mutant p53 and Foxa1 in KPwm/+C tumors as measured by confocal multicolor immunofluorescence (n=4 mice, 5 random fields/mouse). Scale bars, 50μM. I, Correlation of mutant p53 and Foxa1 expression as measured by Pearson correlation (p<0.0001). J, FOXA1 was knocked down in PDAC cells and metastasis measured by lung colonization metastasis assays. K, FOXA1 was overexpressed in PDAC cells and metastasis measured by lung colonization metastasis assays. L, Comparison of FOXA1 expression between p53high and p53low PDX models. M, Comparison of Foxa1 expression between tumors derived from KPwm/+C or KPfl/+C mice and normal murine pancreas. N and O, FOXA1 mRNA and protein levels after mutant p53 was silenced in murine and human PDAC. P, FOXA1 promoter reporter activity after mutant p53 knockdown. Q, Enrichment of mutant p53 occupancy at the Foxa1 promoter relative to a downstream exon. Pooled data from four independent experiments. R, Effect of Foxa1 overexpression on PDAC cell migration/invasion with and without mutant p53 knockdown. S, Effect of ectopic mutant p53 overexpression on PDAC cell migration/invasion with and without Foxa1 knockdown. (J, K, L, M, N, P, Q), Data are mean±s.d. and P values determined by unpaired two-tailed t-tests. (N, O, P), Data representative of at least three independent experiments, each in triplicate. (R, S), P value calculated by one-way ANOVA.
Figure 3.
Figure 3.. Oncogenic KRAS effectors enable mutant p53 binding to CREB1 and FOXA1 upregulation.
A, Foxa1 levels following Creb1 knockdown. B and C, Foxa1 expression and promoter reporter activity following Creb1 knockdown. D, Wildtype CREB1 or phosphorylation-resistant CREB1S133A mutant were transfected into PDAC cells and FOXA1 levels measured by western blot. E and F, The effect of wildtype Creb1 or Creb1S133A mutant overexpression on Foxa1 expression and Foxa1 promoter reporter activity. G, Representative spatial co-expression of p-Creb1 and Foxa1 in KPwm/+C tumors as measured by multicolor immunofluorescence (n=4 mice, 5 random fields/mouse). Scale bars, 50μM. H, Correlation of p-Creb1 and Foxa1 expression as measured by Pearson correlation (p<0.0001). I, p-CREB1S133 and FOXA1 levels following KRAS knockdown. J, Reciprocal co-immunoprecipitation of mutant p53 and CREB1, with and without EGF treatment. K, Reciprocal co-immunoprecipitation between CREB1 and mutant p53 following overexpression of wildtype CREB1 or the phosphorylation-resistant mutant, CREB1S133A. L, The effect of CREB1S133 phosphorylation on mutant p53 and CREB1 binding interactions as measured by proximity ligation assay (PLA). M, The effect of KRAS knockdown on mutant p53 and CREB1 binding interactions as measured by PLA. A-F, L, M. Representative of at least three independent experiments performed in triplicate. I-K, Representative of at least three independent experiments. (B, C, E, F, L, M) Data are mean±s.d. and P values determined by unpaired two-tailed t-tests. (L, M) Scale bars, 20μM.
Figure 4.
Figure 4.. Mutant p53 promotes β-catenin stabilization and activity through FOXA1.
A, IPA analysis results of top upstream regulators of genes differentially expressed in tumors derived from KPwm/+C mice relative to KPfl/+C mice. B, Enriched transcription factors associated with Wnt/β-catenin signaling in KPwm/+C tumors. C, β-catenin levels measured in tumors derived from KPwm/+C and KPfl/+C mice. D, Effect of mutant p53 knockdown on β-catenin levels in murine and human PDAC. E, β-catenin activity following mutant p53 knockdown as measured by the TOPFlash luciferase reporter system (TLRS). F, The effect of β-catenin knockdown on PDAC cell migration/invasion, with and without mutant p53R172H. G, β-catenin levels following ectopic mutant p53R172H expression in p53 null, KPflC cells (KPflC-p53R172H) and heterotopic engraftment into immunodeficient mice. H, Immunohistochemical evaluation and quantification of β-catenin in KPflC (n=5) and KPflC-p53R172H (n=5) tumors. I, The effect of FOXA1 knockdown on β-catenin levels in murine and human PDAC. J, Levels of β-catenin following Foxa1 overexpression in two p53-null, KPflC cell lines (KPflC-Foxa1). K, β-catenin levels were measured in whole tumor lysates following engraftment of KPflC-Foxa1 cells into nude mice (n=5) along with vector controls (n=5). L, Immunohistochemical evaluation and quantification of Foxa1 in KPflC (n=5) and KPflC-Foxa1 (n=5) tumors. M, β-catenin activity (TLRS) following FOXA1 knockdown. N, β-catenin activity (TLRS) following FOXA1 overexpression. (E, G, H, L, M, N), Data are mean±s.d. and P values determined by unpaired two-tailed t-tests. (F), P value calculated by one-way ANOVA.
Figure 5.
Figure 5.. Therapeutic CREB1 inhibition limits PDAC metastasis.
A, Foxa1 and β-catenin levels following treatment with a CREB1 inhibitor (666–15). B and C, The effect of 666–15 treatment on Foxa1 promoter reporter activity. D, The effect of pharmacologic CREB1 inhibition on PDAC metastasis as determined by lung colonization metastasis assays in host mice treated with vehicle (n=9) or 666–15 (n=9). P values determined by unpaired two-tailed t-tests. E, The effect of 666–15 treatment on FOXA1 target gene activation in murine and human PDAC. F, The effects of single and combinatorial treatment with 666–15 and trametinib (MEK inhibitor) on FOXA1, β-catenin, and p-CREB1S133 levels in 8 unique PDAC PDX models. G, Quantification of FOXA1 and p-CREB1S133 levels in 8 unique PDAC PDX models following treatment with 666–15 and/or trametinib. H and I, FOXA1, CK1α and cyclin D1 expression following treatment with a CREB1 inhibitor (666–15), MEK inhibitor (trametinib) or combination in human and murine PDAC. J and K, The effects of treatment with a CREB1 inhibitor (666–15), MEK inhibitor (trametinib) or combination on PDAC cell migration/invasion as measured by transwell assays. (A-C, E, H-K) Representative data from at least three independent experiments performed in triplicate. Data are mean±s.d. P values determined by unpaired two-tailed t-tests.
Figure. 6.
Figure. 6.. Mutant p53 cooperates with oncogenic KRAS effectors to generate metastatic phenotypes.
A, Model depicting KRAS effectors phosphorylating CREB1 to enable binding and hyperactivation by mutant p53. Consequently, FOXA1 is upregulated and β-catenin is stabilized, leading to pro-metastatic phenotypes. B, Reductions in CREB1 phosphorylation through MEK inhibition, coupled with direct CREB1 inhibition with 666–15, blocks FOXA1 upregulation and β-catenin stabilization, inhibiting PDAC metastasis.

References

    1. Ozdemir BC, Pentcheva-Hoang T, Carstens JL, Zheng X, Wu CC, Simpson TR, et al. Depletion of Carcinoma-Associated Fibroblasts and Fibrosis Induces Immunosuppression and Accelerates Pancreas Cancer with Reduced Survival. Cancer Cell 2015;28(6):831–3 doi 10.1016/j.ccell.2015.11.002. - DOI - PubMed
    1. Rhim AD, Mirek ET, Aiello NM, Maitra A, Bailey JM, McAllister F, et al. EMT and dissemination precede pancreatic tumor formation. Cell 2012;148(1–2):349–61 doi 10.1016/j.cell.2011.11.025. - DOI - PMC - PubMed
    1. Rhim AD, Oberstein PE, Thomas DH, Mirek ET, Palermo CF, Sastra SA, et al. Stromal elements act to restrain, rather than support, pancreatic ductal adenocarcinoma. Cancer Cell 2014;25(6):735–47 doi 10.1016/j.ccr.2014.04.021. - DOI - PMC - PubMed
    1. Aguirre AJ, Bardeesy N, Sinha M, Lopez L, Tuveson DA, Horner J, et al. Activated Kras and Ink4a/Arf deficiency cooperate to produce metastatic pancreatic ductal adenocarcinoma. Genes Dev 2003;17(24):3112–26 doi 10.1101/gad.1158703. - DOI - PMC - PubMed
    1. Hingorani SR, Petricoin EF, Maitra A, Rajapakse V, King C, Jacobetz MA, et al. Preinvasive and invasive ductal pancreatic cancer and its early detection in the mouse. Cancer Cell 2003;4(6):437–50. - PubMed

Publication types

Substances