. 2022 May 6;118(6):1548-1563.
doi: 10.1093/cvr/cvab134.

Single-cell dual-omics reveals the transcriptomic and epigenomic diversity of cardiac non-myocytes

Affiliations

Single-cell dual-omics reveals the transcriptomic and epigenomic diversity of cardiac non-myocytes

Li Wang et al. Cardiovasc Res. .

Abstract

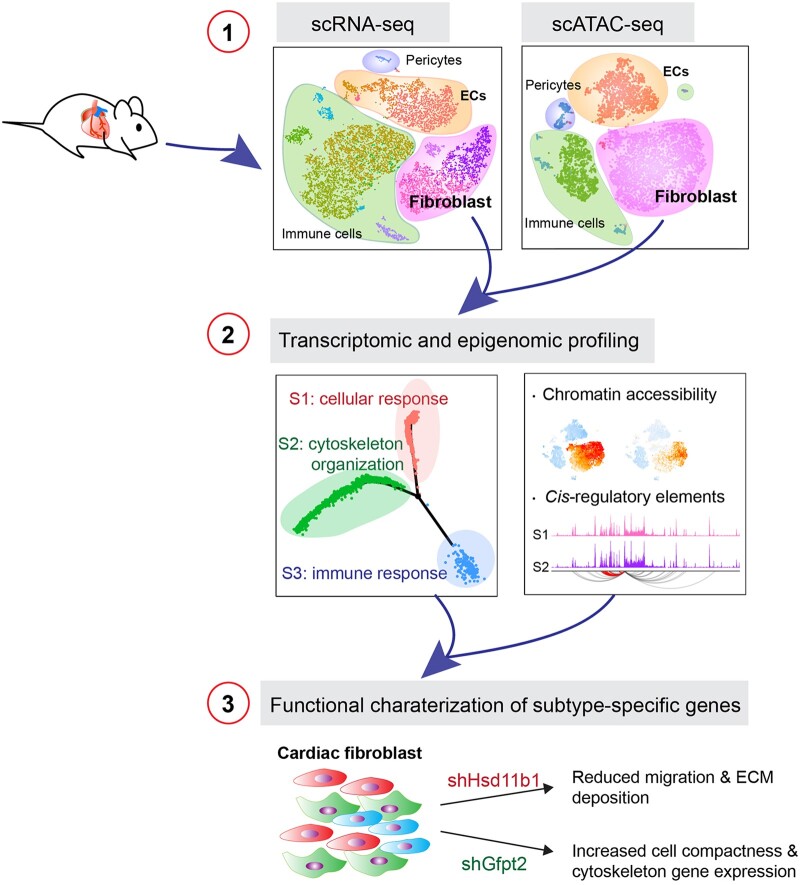
Aims: The precise cellular identity and molecular features of non-myocytes (non-CMs) in a mammalian heart at a single-cell level remain elusive. Depiction of epigenetic landscape with transcriptomic signatures using the latest single-cell multi-omics has the potential to unravel the molecular programs underlying the cellular diversity of cardiac non-myocytes. Here, we characterized the molecular and cellular features of cardiac non-CM populations in the adult murine heart at the single-cell level.

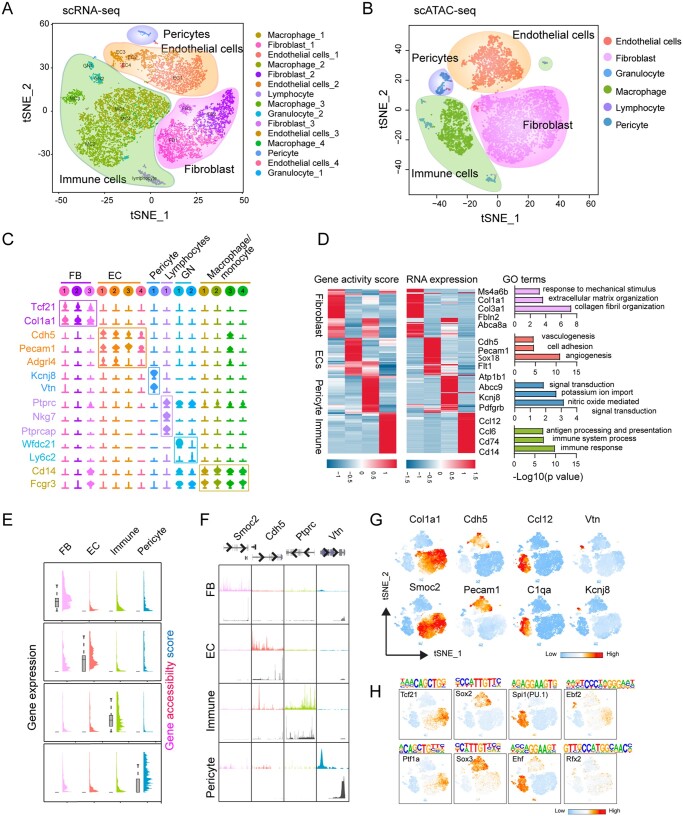
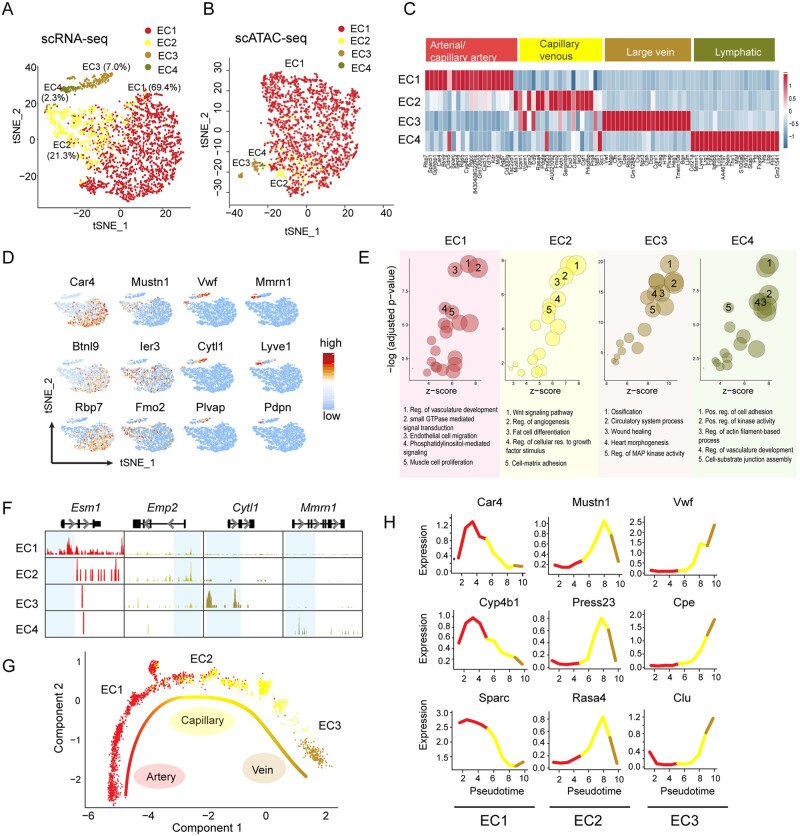
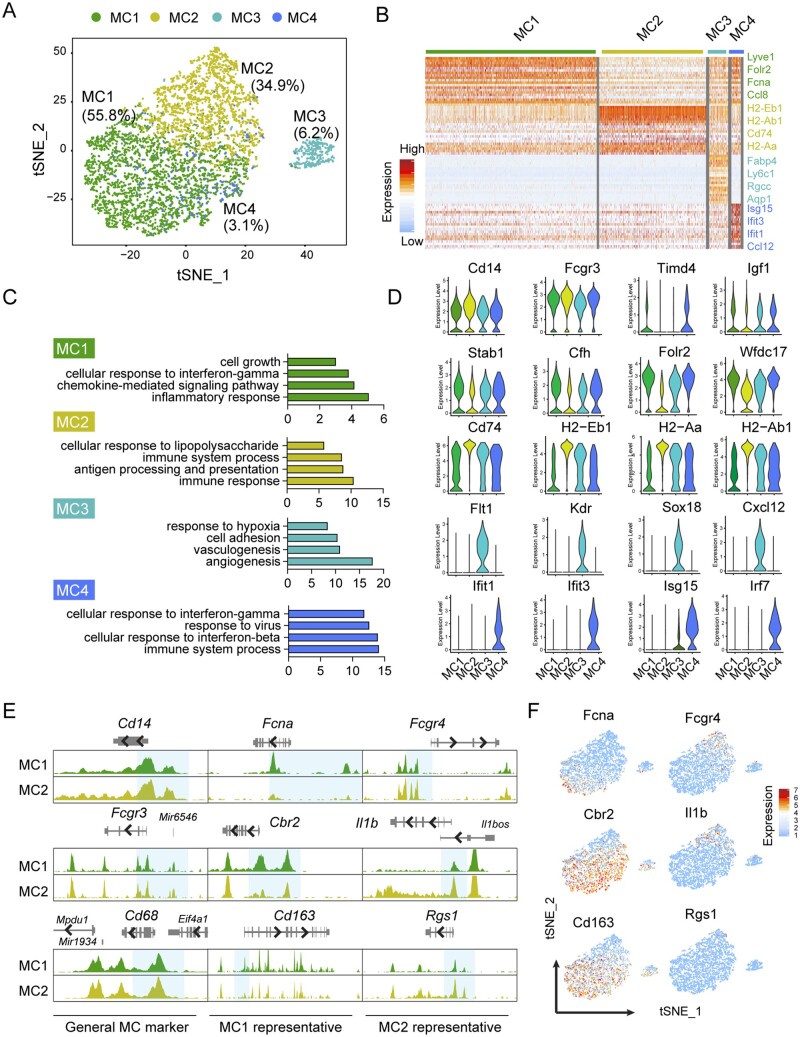
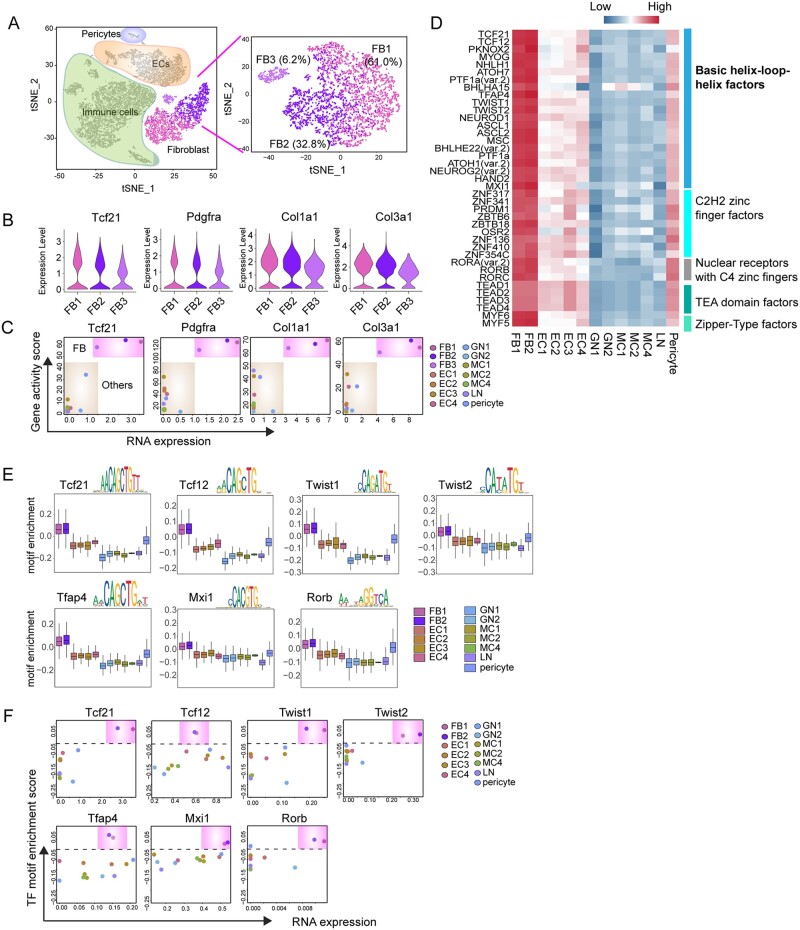
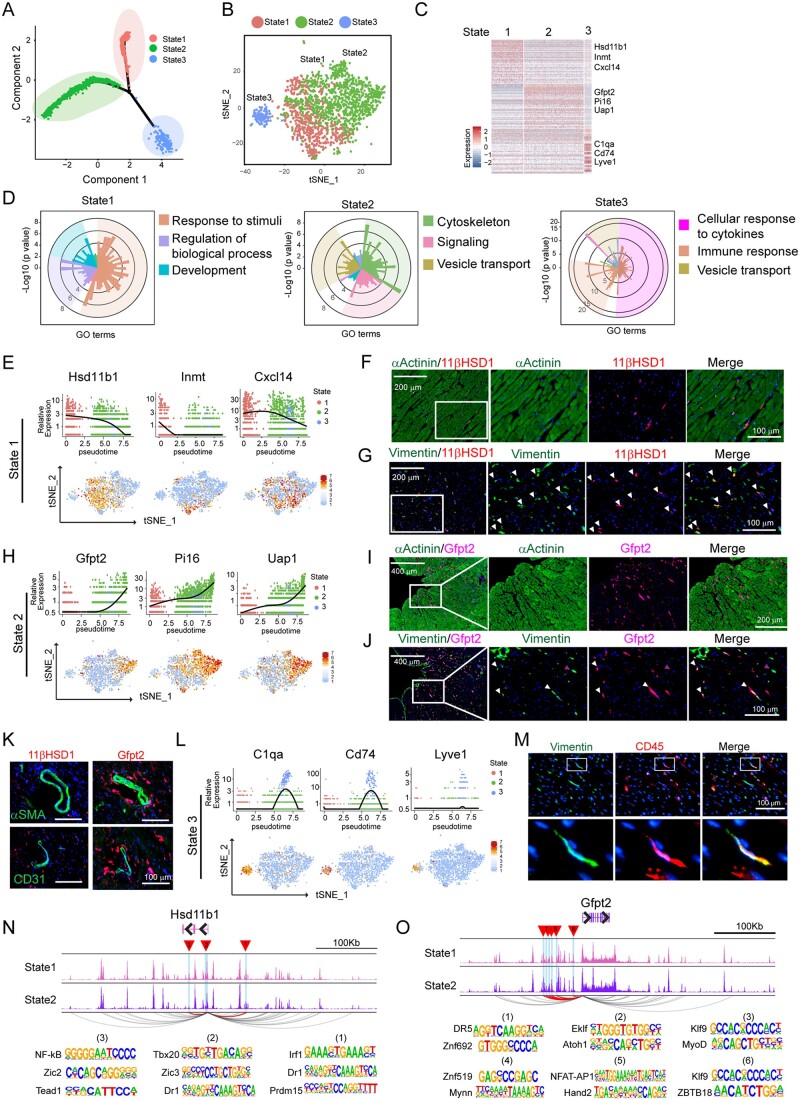
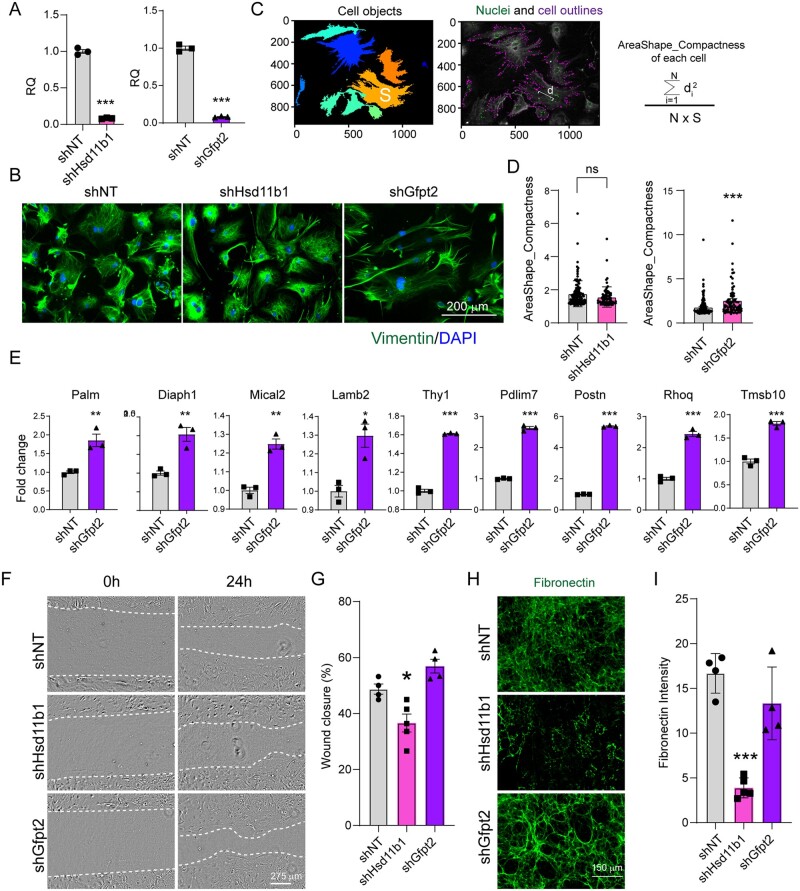
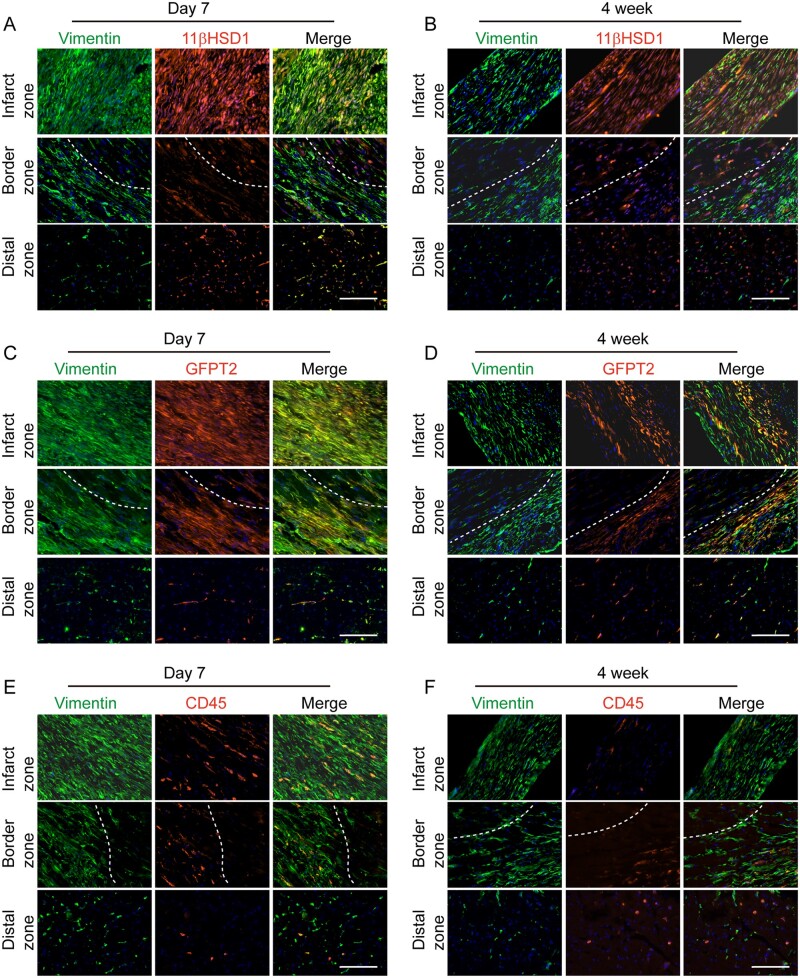
Methods and results: Through single-cell dual omics analysis, we mapped the epigenetic landscapes, characterized the transcriptomic profiles and delineated the molecular signatures of cardiac non-CMs in the adult murine heart. Distinct cis-regulatory elements and trans-acting factors for the individual major non-CM cell types (endothelial cells, fibroblast, pericytes, and immune cells) were identified. In particular, unbiased sub-clustering and functional annotation of cardiac fibroblasts (FBs) revealed extensive FB heterogeneity and identified FB sub-types with functional states related to the cellular response to stimuli, cytoskeleton organization, and immune regulation, respectively. We further explored the function of marker genes Hsd11b1 and Gfpt2 that label major FB subpopulations and determined the distribution of Hsd11b1+ and Gfp2+ FBs in murine healthy and diseased hearts.

Conclusions: In summary, we characterized the non-CM cellular identity at the transcriptome and epigenome levels using single-cell omics approaches and discovered previously unrecognized cardiac fibroblast subpopulations with unique functional states.

Keywords: Fibroblast; Murine adult heart; Non-myocytes; Single-cell ATAC-seq; Single-cell transcriptomics.


Figures

None
Graphical abstract
Figure 1
Figure 1
Integrated single-cell transcriptomic and epigenomic analysis of non-cardiac (non-CM) cells. (A) Unsupervised clustering demonstrates 15 distinct cell types shown in a t-SNE plot. Non-CMs (n = 12 779) were obtained from two adult hearts. (B) t-SNE plot of major cell types captured by scATAC-seq (n = 9524). (C) Violin plots showing the relative expression levels of representative marker genes across the 15 main clusters. (D) Heatmaps showing the promoter accessibility and the corresponding gene expression of differentially expressed genes (DEGs) in four major non-CM cell populations. Representative gene ontology (GO) terms of the DEGs obtained from scRNA-seq were shown at the right side. (E) Plots showing the gene accessibility score (coloured peaks) and expression levels (grey boxes) of the scRNA-seq derived cell-type signature genes for major non-CM clusters including fibroblasts (FBs), endothelial cells (ECs), pericytes and immune cells. (F) Aggregate chromatin accessibility (colour peaks) and gene expression (grey peaks) profiles for each cell cluster at representative marker gene loci (Smoc2 for FBs, Cdh5 for ECs, Ptprc for immune cells and Vtn for pericytes). (G) t-SNE plot showing the differential accessibilities of representative marker genes for major non-CM clusters. (H) t-SNE plot showing the differentially enriched transcription factor (TF) binding motifs among major non-CM clusters.
Figure 2
Figure 2
Characterization of endothelial cell subpopulations from cardiac non-myocytes. (A) t-SNE plot showing subpopulations of ECs from scRNA-seq. EC cells (n = 2939) were subclustered into four subsets and the percentage of each subcluster was shown. (B) t-SNE plot showing subpopulations of ECs from scATAC-seq (n = 2287). (C) Heatmap of top 20 DEGs in each EC subcluster that re-define ECs into arterial/capillary artery ECs, capillary venous, large vein and lymphatic ECs. (D) t-SNE plot showing expression of representative markers in individual EC sub-clusters. (E) Genome track showing the chromatin accessibility profiles of the representative markers in each EC subcluster. EC subcluster specific peaks were highlighted in blue. (F) Enriched GO terms of each EC sub-types using DAR nearby genes. Top five non-redundant GO terms were shown as representatives. Reg, regulation; pos, positive; res, response. (G) Trajectory analysis of the ECs forming blood vessels. (H) Expression profile of marker genes differentially expressed along the trajectory in EC sub-clusters forming blood vessels.
Figure 3
Figure 3
Characterization of macrophages/monocytes from cardiac non-myocytes. (A) t-SNE plot showing 4 macrophage/monocyte (MC) sub-types (n = 5532) from non-CMs. (B) Heatmap showing expression of top 30 DEGs in each MC sub-type. (C) GO terms enriched for each MC sub-type. (D) Violin plot showing the expression of the representative genes in each MC sub-type. (E) Genome tracks showing the chromatin accessibility profiles of the representative marker genes for the two major MC sub-type (MC1 and MC2). Differentially accessible regions near promoter were highlighted in blue. (F) t-SNE plot showing the expressions of representative marker genes for different MC sub-types.
Figure 4
Figure 4
Cis- and trans-regulatory elements of cardiac fibroblast. (A) Unsupervised clustering of FBs (n = 3459) by Seurat demonstrating three FB sub-types. (B) Violin plot showing the relative expression of canonical FB marker genes in three FB sub-types. (A) X–Y plots showing the gene expression levels (X-axis) and the gene accessibility score (Y-axis) of canonical FB marker genes. (D) Heatmap showing the motif enrichment scores for TF motifs highly enriched in FB sub-types. (E) Box plot showing the enrichment scores for seven representative TF motifs that are specifically enriched and highly expressed in FB population. (F) X–Y plots showing the gene expression levels and TF motif enrichment scores of FB-specific TFs.
Figure 5
Figure 5
Heterogeneity of fibroblast reflected by three subpopulations in distinct functional states. (A) Ordering single fibroblast cells along a cell state trajectory using Monocle (n = 2048). (B) Projection of FBs in three state into t-SNE plot clustered by Seurat. (C) Heat map showing a subset of transcripts that are enriched in each functional state. Three representative genes were listed. (D) Top 3 enriched GO categories analysed from DEGs of each cell state. In each panel, each histogram represents a GO term, the height of the bar indicates the P-value, and the colour indicates similar functional GO categories. GO terms of similar biological function were gathered as a function group, representative GO terms were shown and followed by a P-value. (E) Representative gene expression in State 1 FB shown in total fibroblast population along pseudotime trajectory (upper panel) and their distribution in major cell populations in t-SNE plot (bottom panel). (F) Representative immunohistochemistry (IHC) images showing 11βHDS1+αActinin-State 1 FBs. (G) Representative IHC images showing the identification of State 1 FB positive for both 11βHDS1 and Vimentin (white arrowhead). (H) Representative gene expression in State 2 FB shown in total fibroblast population along pseudotime trajectory (upper panel) and their distribution in major cell populations in t-SNE plot (bottom panel). (I) Representative IHC images showing Gfpt2+α-Actinin-State 2 FBs. (J) Representative IHC images showing the identification of State 2 FB positive for both Gfpt2 and Vimentin (white arrowhead). (K) Representative IHC images showing the co-staining of 11βHDS1+ and Gfpt2+ cells with either αSMA or CD31. (L) Representative gene expression in State 3 FBs shown in total FB population along pseudotime trajectory (upper panel) and in major cell populations in tSNE plot (bottom panel). (M) Representative IHC images showingV the identification of FB (state 3) positive for both CD45 and Vimentin. (N,O) Genome track of the Hsd11b1 (N) and Gfpt2 (O) loci. Predicted promoter-enhancer interactions of statistical significance (P-value < 0.05) are shown in arcs, where the interactions involving differentially accessible regions (DARs; highlighted in blue, as well as red triangles) are highlighted in purple, and the others are in gray. For panels F, G, I, J, K, and M, n = 3 hearts were used, and n = 4 sections at different positions from each heart were stained for indicated protein.
Figure 6
Figure 6
Effects of Hsd11b1 and Gfpt2 knockdown on cardiac fibroblasts in vitro. (A) Knockdown efficiency of Hsd11b1 and Gfpt2 evaluated by RT-qPCR. Lenti-viral shRNAs targeting Hsd11b1, Gfpt2 and non-targeting control (shNT) were individually introduced to FBs isolated from 3 m adult hearts. Three days post-viral infection, cells were collected for qPCR. This experiment was repeated three times with n = 5 hearts and averaged numbers from technical triplicates were used for statistics. Error bars indicate mean ± s.e.m; *** P < 0.001. (B) Representative ICC images showing the morphology of cultured FBs upon shHsd11b1 and shGfpt2 treatment. (C) Representative images and formula showing the parameters of area (S) and distance (d) for measuring cell compactness using Cellprofiler. (D) Histogram showing the cell compactness changes upon shHsd11b1 and shGfpt2 treatment in comparison with shNT control. In left panel, n = 112 for shNT, and n = 73 for shHsd11b1; in right panel, n = 146 for shNT and n = 76 for shGfpt2. (E) Quantification of the expression of genes involved in cytoskeleton organization in FBs treated with shNT or shGfpt2 by qPCR. This experiment was repeated three times with n = 5 hearts each time. Averaged numbers from technical triplicates were used for statistics. Error bars indicate mean ± s.e.m; * P < 0.05, ** P < 0.01, ***P < 0.001. (F,G) Representative light microscopic images (F) and quantification (G) of cardiac FB migration at 0 h and 24 h after scratching. (H,I) Representative ICC images (H) and quantification (I) showing the deposition of fibronectin in FBs treated with shRNAs targeting Hsd11b1, Gfpt2, and the non-targeting control. For panels (F–I), the experiments were repeated three times in technical duplicates using n = 3 hearts each time. In each replicate, n = 4–5 individual fields were taken and calculated for statistics. Error bars indicate mean ± s.e.m; * P < 0.05, ** P < 0.01, *** P < 0.001.
Figure 7
Figure 7
Expression of Hsd11b1 and Gfpt2 in cardiac fibroblast upon myocardial injury. (A,B) Representative IHC images showing the expression of Hsd11b1 and its colocalization with Vimentin in infarcted region, border zone and distal zone of heart 7 days (A) and 4 weeks (B) post-MI. (C,D) Representative IHC images showing the expression of Gfpt2 and its colocalization with Vimentin in infarcted region, border zone and distal zone of heart 7 days (C) and 4 weeks (D) post-MI. (E,F) Representative IHC images showing the expression of Gfpt2 expression and its colocalization with Vimentin in infarcted region, border zone and distal zone of heart 7 days (E) and 4 weeks (F) post-MI. Dashed lines indicate the borderline between injured and uninjured or less injured area. The experiment was performed with n = 5 mice per each group. In each heart, n = 4 sections at different layers of heart were used.

Comment in

References

    1. Pinto AR, Ilinykh A, Ivey MJ, Kuwabara JT, D'Antoni ML, Debuque R, Chandran A, Wang L, Arora K, Rosenthal NA, Tallquist MD. Revisiting cardiac cellular composition. Circ Res 2016;118:400–409. - PMC - PubMed
    1. Tallquist MD, Molkentin JD. Redefining the identity of cardiac fibroblasts. Nat Rev Cardiol 2017;14:484–491. - PMC - PubMed
    1. Armulik A, Abramsson A, Betsholtz C. Endothelial/pericyte interactions. Circ Res 2005;97:512–523. - PubMed
    1. Lee LL, Chintalgattu V. Pericytes in the heart. Adv Exp Med Biol 2019;1122:187–210. - PubMed
    1. Prabhu SD, Frangogiannis NG. The biological basis for cardiac repair after myocardial infarction: from inflammation to fibrosis. Circ Res 2016;119:91–112. - PMC - PubMed

Publication types