. 2021 Jun;34(2):149-173.
doi: 10.1007/s00497-021-00409-0. Epub 2021 Apr 11.

HAG1 and SWI3A/B control of male germ line development in P. patens suggests conservation of epigenetic reproductive control across land plants

Affiliations

HAG1 and SWI3A/B control of male germ line development in P. patens suggests conservation of epigenetic reproductive control across land plants

Anne C Genau et al. Plant Reprod. 2021 Jun.

Abstract

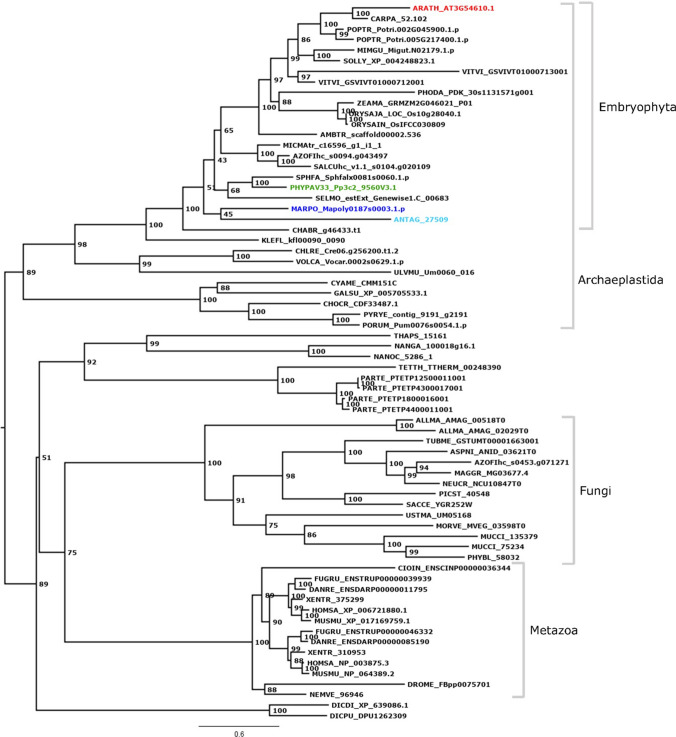
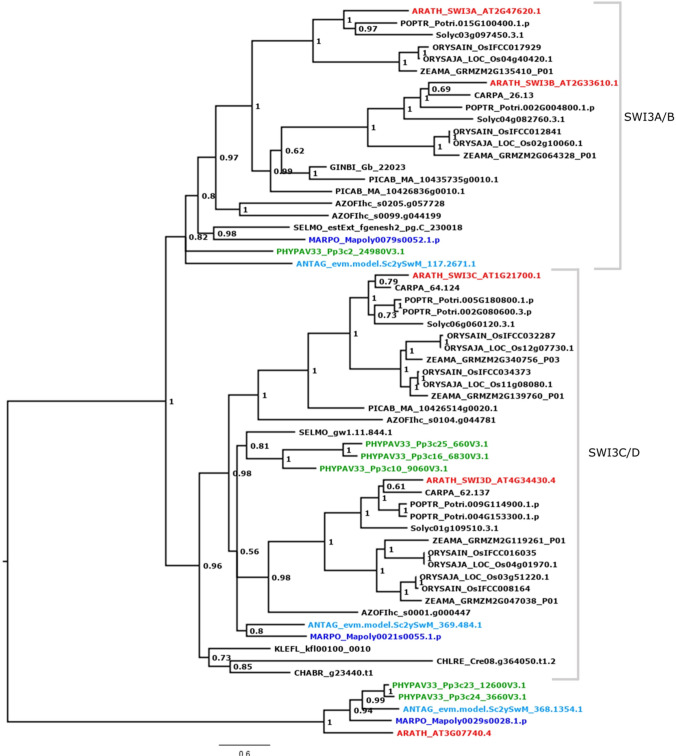
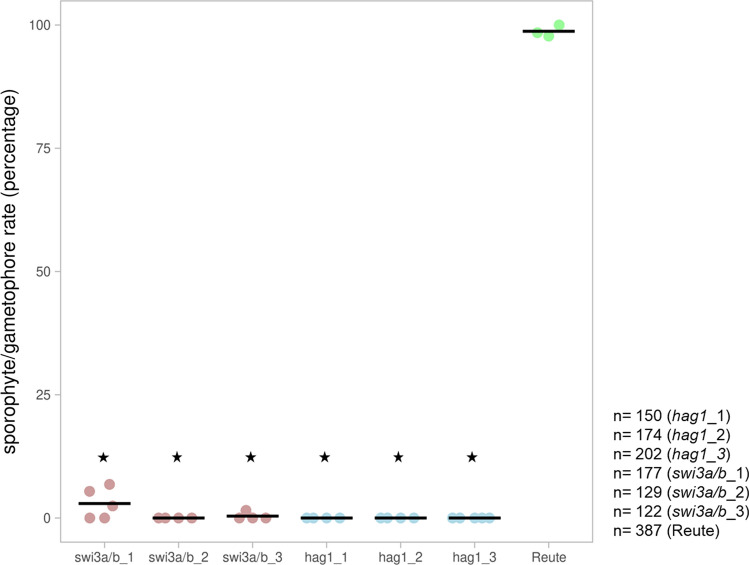
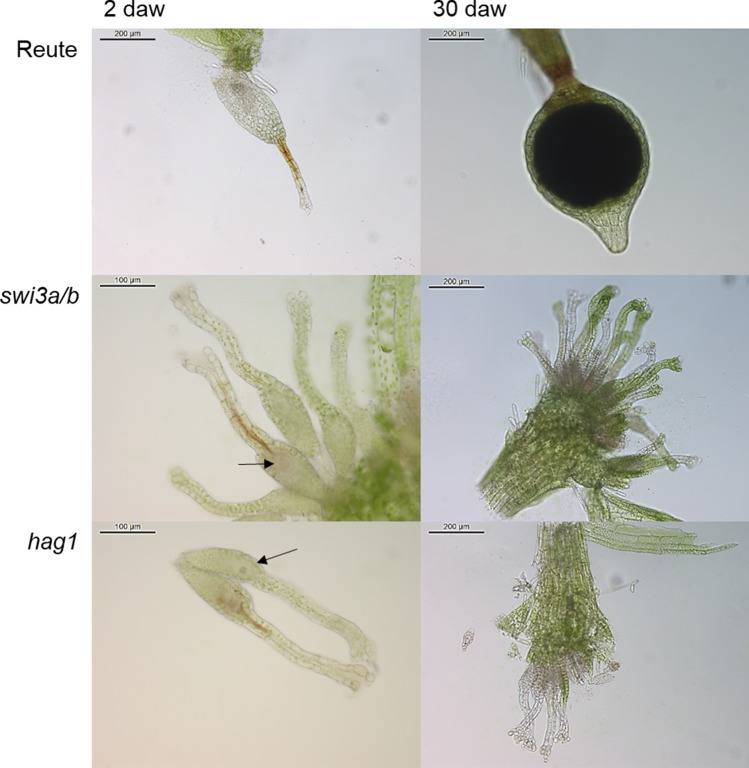
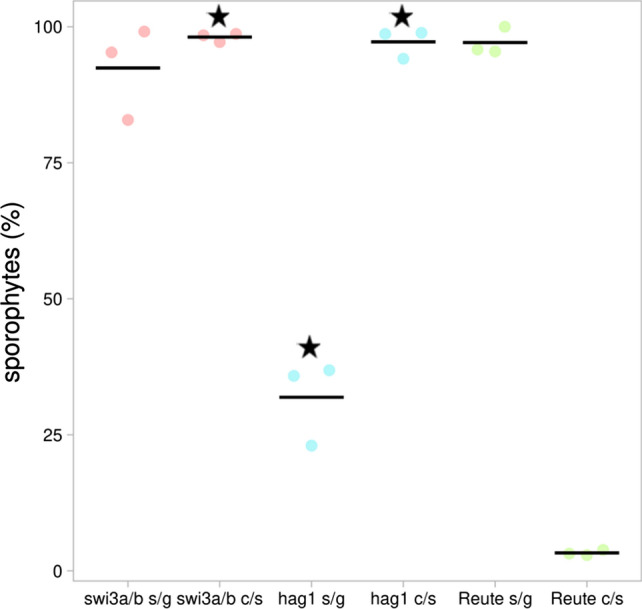
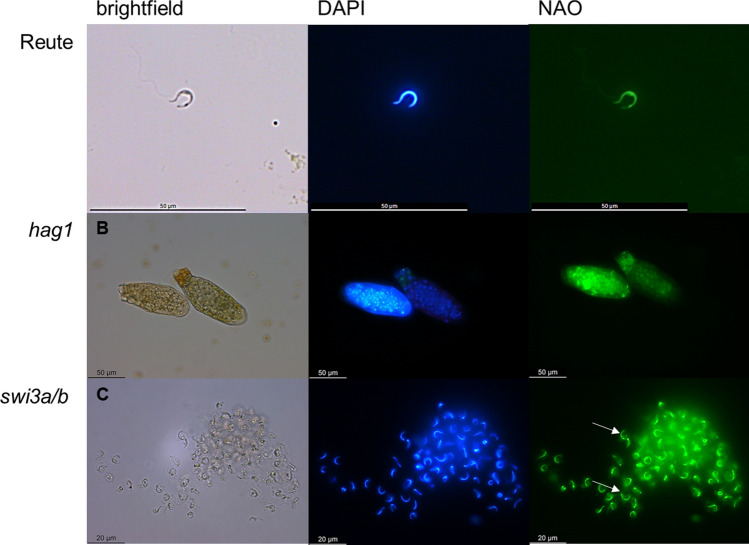
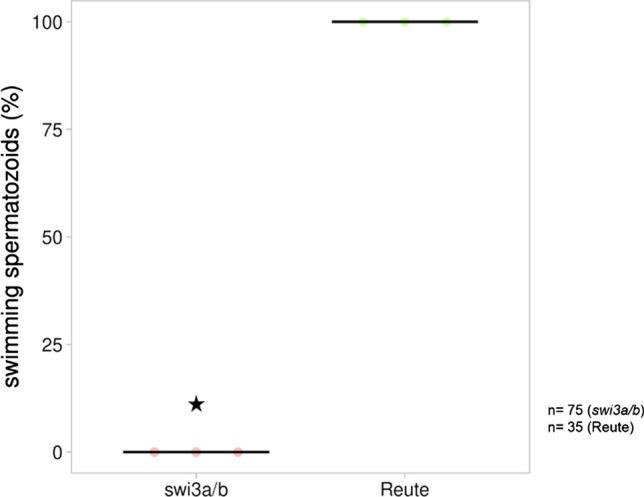
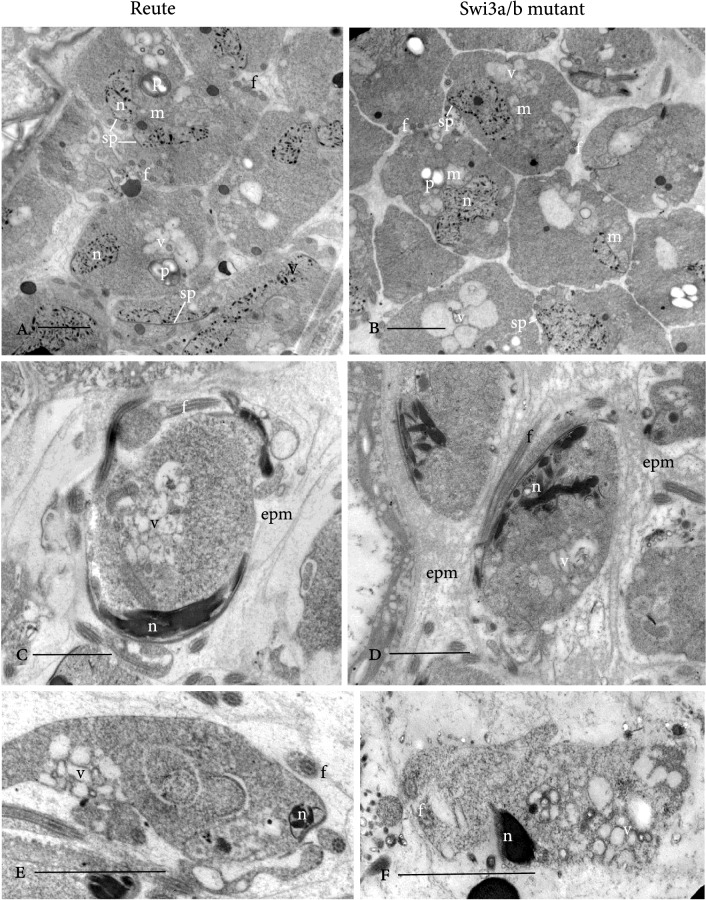
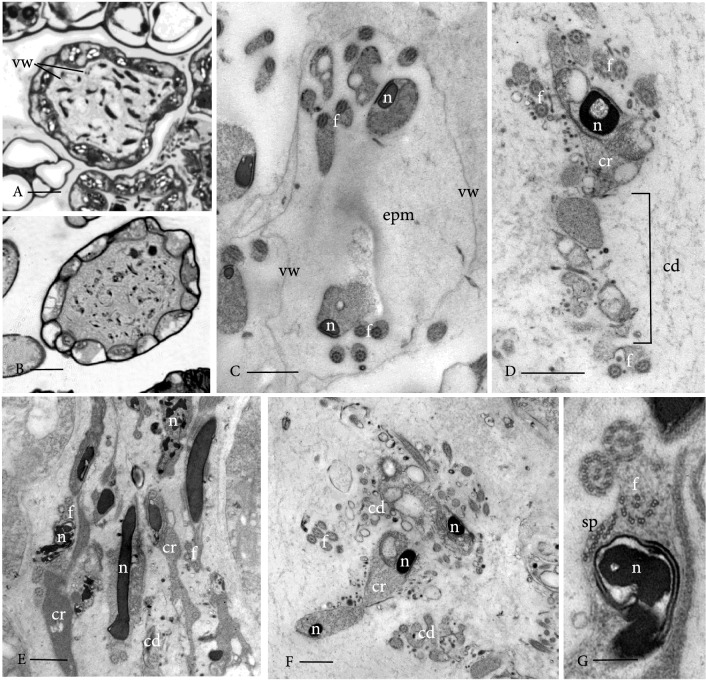
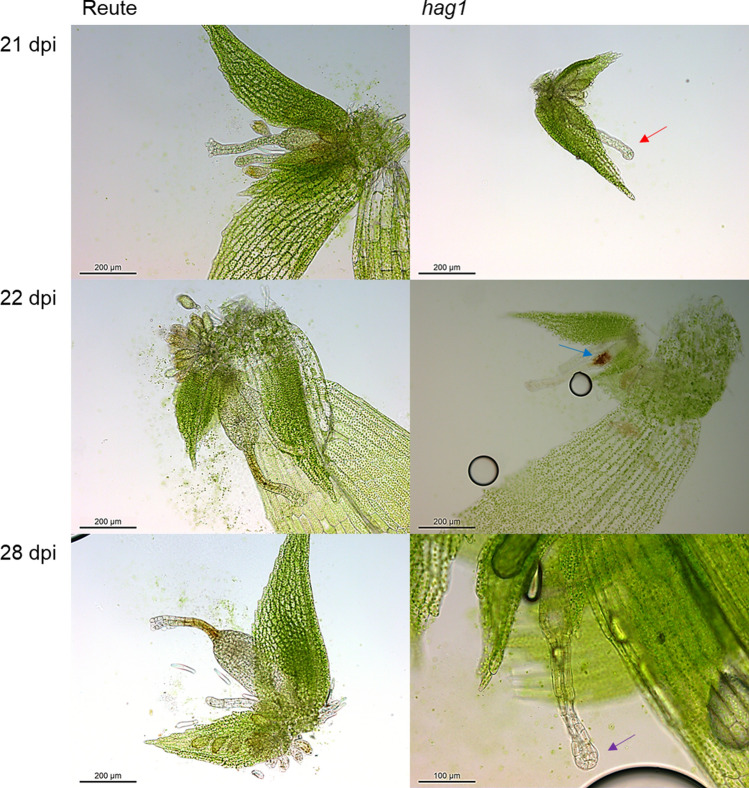
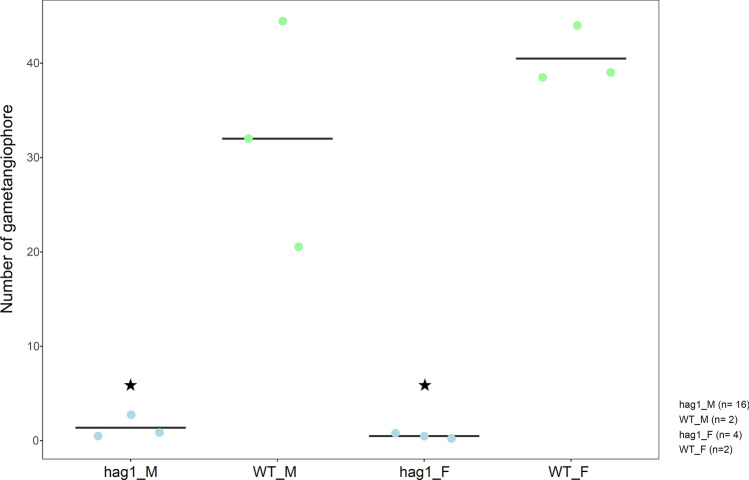
Bryophytes as models to study the male germ line: loss-of-function mutants of epigenetic regulators HAG1 and SWI3a/b demonstrate conserved function in sexual reproduction. With the water-to-land transition, land plants evolved a peculiar haplodiplontic life cycle in which both the haploid gametophyte and the diploid sporophyte are multicellular. The switch between these phases was coined alternation of generations. Several key regulators that control the bauplan of either generation are already known. Analyses of such regulators in flowering plants are difficult due to the highly reduced gametophytic generation, and the fact that loss of function of such genes often is embryo lethal in homozygous plants. Here we set out to determine gene function and conservation via studies in bryophytes. Bryophytes are sister to vascular plants and hence allow evolutionary inferences. Moreover, embryo lethal mutants can be grown and vegetatively propagated due to the dominance of the bryophyte gametophytic generation. We determined candidates by selecting single copy orthologs that are involved in transcriptional control, and of which flowering plant mutants show defects during sexual reproduction, with a focus on the under-studied male germ line. We selected two orthologs, SWI3a/b and HAG1, and analyzed loss-of-function mutants in the moss P. patens. In both mutants, due to lack of fertile spermatozoids, fertilization and hence the switch to the diploid generation do not occur. Pphag1 additionally shows arrested male and impaired female gametangia development. We analyzed HAG1 in the dioecious liverwort M. polymorpha and found that in Mphag1 the development of gametangiophores is impaired. Taken together, we find that involvement of both regulators in sexual reproduction is conserved since the earliest divergence of land plants.

Keywords: Fertilization; Gametangia; Germ line; Marchantia; Physcomitrium; Spermatozoid.


Conflict of interest statement

The authors declare that they have no conflict of interest.

Figures

Fig. 1
Fig. 1
HAG1 phylogenetic analysis. Midpoint-rooted maximum likelihood tree of the HAG1 family across selected eukaryotes. There are clear single copy orthologs of the A. thaliana gene (red) in the three bryophyte species of interest, P. patens (moss, green), A. agrestis (hornwort, turquoise) and M. polymorpha (liverwort, blue). Support values at the nodes represent bootstrap support. Species names are abbreviated in a five letter code where the first three letters represent the species and the latter two the genus, e.g., ORYza SAtiva = ORYSA [red algae: CYAME = Cyanidioschyzon merolae, GALSU = Galdieria sulphuraria, CHOCR = Chondrus crispus, PORUM = Porphyra umbilicalis, PYRYE = Pyropia yezoensis; chlorophyte algae: CHLRE = Chlamydomonas reinhardtii, ULVMU = Ulva mutabilis, VOLCA = Volvox carteri; streptophyte algae: KLEFL = Klebsormidium nitens, CHABR = Chara braunii; bryophytes: ANTAG = Anthoceros agrestis, MARPO = Marchantia polymorpha, PHYPA = Physcomitrium patens, SPHFA = Sphagnum fallax; SELMO = Selaginella moellendorffii (lycophyte); ferns: AZOFI = Azolla filiculoides, SALCU = Salvinia cucullate, MICMA = Microlepia marginata; angiosperms: monocots, ZEAMA = Zea mays, ORYSA = Oryza sativa, PHODA = Phoenix dactylifera; dicots, ARATH = Arabidopsis thaliana, POPTR = Populus trichocarpa, CARPA = Carica papaya, SOLLY = Solanum lycopersicum, MIMGU = Mimulus guttatus, VITVI = Vitis vinifera, PHODA = Phoenix dactylifera; ANA grade: AMBTR = Amborella trichopoda; fungi: ALLMA = Allomyces macrogynus, MORVE = Mortierella verticillata, MUCCI = Mucor circinelloides, PHYBL = Phycomyces blakesleeanus, USTMA = Ustilago maydis, SACCE = Saccharomyces cerevisiae, PICST = Scheffersomyces stipitis, TUBME = Tuber melanosporum, ASPNI = Aspergillus nidulans, NEUCR = Neurospora crassa, MAGGR = Magnaporthe grisea; amoebozoa: DICPU = Dictyostelium purpureum, DICDI = Dictyostelium discoideum; SAR: THAPS = Thalassiosira pseudonana, NANOC = Nannochloropsis oceanica CCMP1779, NANGA = Nannochloropsis gaditana, TETTH = Tetrahymena thermophila, PARTE = Paramecium tetraurelia; invertebrates: CIOIN = Ciona intestinalis, NEMVE = Nematostella vectensis, DROME = Drosophila melanogaster; vertebrates: HOMSA = Homo sapiens, FUGRU = Fugu rubripes, XENTR = Xenopus tropicalis, MUSMU = Mus musculus, DANRE = Danio rerio]
Fig. 2
Fig. 2
SWI3 phylogenetic analysis. Midpoint-rooted Bayesian phylogenetic tree of plant SWI3 proteins. The phylogenetic analysis distinguishes the four A. thaliana SWI-like proteins (A, B, C, D; red). The SWI3A/B clade shows single copy orthologs for the three bryophyte species of interest, P. patens (moss, green), A. agrestis (hornwort, turquoise) and M. polymorpha (liverwort, blue). Support values at the nodes represent posterior probabilities of Bayesian inference, and the outgroup represents the longest internal branch. Species names are abbreviated in a five letter code where the first three letters represent the species and the latter two the genus, e.g., ORYza SAtiva, ORYSA (rice) [angiosperms: dicots, ARATH = A. thaliana (thale cress), CARPA = Carica papaya (papaya), POPTR = Populus trichocarpa (poplar), SOLLY = Solanum lycopersicum (tomato); monocots: ORYSAIN = Oryza sativa indica (rice), ORYSAJA = Oryza sativa japonica (rice), ZEAMA = Zea mays (corn); gymnosperms: PICAB = Picea abies (Norway spruce), GINBI = Ginkgo biloba; AZOFI = Azolla filiculoides (water fern); SELMO = Selaginella moellendorffii (lycophyte); bryophytes: PHYPA = Physcomitrium patens (moss), MARPO = Marchantia polymorpha (liverwort), ANTAG = Anthoceros agrestis (hornwort); streptophyte algae: CHABR = Chara braunii, KLEFL = Klebsormidium flaccidum; CHLRE = Chlamydomonas reinhardtii (chlorophyte alga)]
Fig. 3
Fig. 3
Sporophytes per gametophore. The control (Reute, green) shows the expected selfing rate/number of sporophytes per gametophore of in average 99%. Ppswi3a/b (red) and Pphag1 (blue) show significantly less sporophytes per gametophore (p < 0.01, Fisher’s exact test, asterisks). At least three independent replicates (dots) were performed for the mutant lines as well as the control; the total number of gametophores analyzed per mutant/control is shown to the right. The number of sporophytes per gametophore was calculated as percentage relative to the total number of gametophores. Averages of replicates are shown as horizontal lines
Fig. 4
Fig. 4
Phenotypic analysis of swi3a/b and hag1 compared to control after watering. Two days after watering, Reute (control) developed early stage (ES) sporophytes, recognizable by the swollen archegonial cavity, while the mutants were arrested at the archegonial stage, with egg cells still being visible inside the cavity (arrows). Reute developed mature brown (B) sporophytes 30 days after watering, while both mutants developed an abundance of archegonia. Developmental stages according to Hiss et al. (2017). Note the brown coloration of archegonial neck cells 2daw, that has been described to occur in the wildtype upon fertilization, but apparently occurs in the mutants despite lack of fertilization
Fig. 5
Fig. 5
Crossing analyses with a fluorescent male fertile strain to test for male impairment. Ppswi3a/b and Pphag1 were crossed with Re-mcherry according to Perroud et al. (2019). Shown is the number of sporophytes per gametophore (s/g) in percentage relative to the total number of gametophores, and the rate of crosses per sporophytes (c/s) in percentage relative to the total number of sporophytes. Most of the sporophytes in the Reute control derive from selfing (homozygous; hence low number of heterozygous sporophytes, c/s). In contrast, almost 100% of mutant sporophytes are heterozygous (asterisks), indicating a male impairment (p < 0.01, Fisher’s exact test). The cross with the male fertile strain could largely restore the phenotype in swi3a/b (sporophyte/gametophore ratio at least 80%), while Pphag1 shows a significantly reduced sporophyte ratio (asterisk) as compared to the control. Three independent replicates (dots) were performed for the mutant lines as well as the control. The total number of gametophores analyzed was 621 (swi3a/b), 770 (hag1) and 190 (control). Averages of replicates are shown as horizontal lines. Numbers per individual mutant line are shown in Table S2
Fig. 6
Fig. 6
Spermatozoid analysis via a double staining with DAPI and NAO. A) A released Reute (control) spermatozoid is shown with its slender shape und fully reduced cytoplasm. B) Pphag1 antheridia do not release spermatozoids, but they remain in a round shape inside the antheridia. C) Ppswi3a/b antheridia release spermatozoids, which however show incomplete cytoplasmic reduction (white arrows). See Figs. S9-11 for further micrographs of sperm morphology
Fig. 7
Fig. 7
Swimming capability of spermatozoids shortly after release. Mature antheridia (21 dpi) release their spermatozoids, which were analyzed in terms of movement in three independent replicates in Ppswi3a/b and the control. The released spermatozoids of each antheridium were analyzed in terms of movement. The movement was classified as swimming and no swimming. Swimming was defined as the ability to move away independently from the position of antheridial release. The control showed motile, swimming spermatozoids in 100% of analyzed antheridia, whereas no swimming at all was observed in Ppswi3a/b (significant reduction, p < 0.01, Fisher’s exact). In total, 75 (n = 29) (first replicate), 32 (second replicate), 14 (third replicate) antheridia (Ppswi3a/b) were analyzed that opened spontaneously. For the control, 35 antheridia (n = 10, 17 and 8 for the first, second and third replicate, respectively) were analyzed. Averages of replicates are shown as horizontal lines
Fig. 8
Fig. 8
TEM of developing spermatids. Reute control in left column and Ppswi3a/b mutant in right column. a, b Identical early stages of spermatid differentiation reveal elongating flagella (f), a microtubular spline (sp) and associated condensing nucleus (n), a single starch-laden plastid (p) with mitochondrion (m). Vacuoles and vesicles (v) are evidence of cytoplasmic reduction. c, d As nuclear compaction nears completion, deviations from Reute control (C) to Ppswi3a/b gametes (D) include irregular chromatin condensation and an abnormal extraprotoplasmic matrix (epm) in which gametes develop that consist of dense material and anastomosing fibers different from the fine granular to electron-lucent matrix around Reute gametes. e, f A central network of coated and smooth vesicles (v) is evidence of continued cytoplasmic reduction in both Reute (e) and Ppswi3a/b (f) gametes. Bars: A-F = 2 mm
Fig. 9
Fig. 9
Cartoonized schema of a developing sperm cell with focus on cell walls. Spermatogenesis in moss involves the deposition of four sequential cell walls or matrices. Wall one (W1) is the primary cell wall stemming from antheridial cell divisions. The thick blue wall (W2) is deposited and makes the cell round/spherical. The black inner line around the spermatozoid is the third wall (W3) or "vesicle" (cf. Figs. 8/10) in which gametes are released. The fourth wall layer is the extraprotoplasmic matrix (epm) in which the sperm cells develop. Each wall has a different polymer composition, and only W3 remains intact when gametes are mature/released. Mature wildtype gametes have two anterior flagella (red, f) that encircle the cell, an elongated cylindrical nucleus (blue, n), a spline (sp) of microtubules that forms the backbone of the cell and two mitochondria (brown, m), one at the anterior (not visible) and one in the mid-region of the nucleus that is associated with a single plastid (green, p). In Ppswi3a/b gametes, extraneous cytoplasm does not break down and the wall layers are not properly degraded, leaving the gametes embedded in a cloud of fluorescent material. The caviar-like structure of Ppswi3a/b (cf. Figs., S9, S11) is likely the outline of wall 3 due to incomplete degradation of cell wall polymers and the retention of remnants of each of the four wall layers
Fig. 10
Fig. 10
Mature antheridia and gametes. a LM cross section, Reute (control) antheridium contains evenly spaced, streamlined, coiled gametes individually enclosed in a round/spherical thin “vesicle” wall (vw). b Ppswi3a/b gametes are poorly defined and embedded in a dense irregular matrix. c TEM of nearly mature Reute sperm cell showing two profiles of the coiled nucleus (n) and flagella (f) embedded in the extraprotoplasmic matrix (epm) that is electron-lucent and enclosed in a “vesicle” wall (vw) or third wall; cf. figure dg TEMs of Ppswi3a/b gametes showing disrupted cell shape, irregular nuclear (n) compaction and coiling, abnormal locomotory apparatus and cytoplasmic remnants (cr) attached to the cell body. The matrix in which gametes are embedded is irregularly granular/fibrillar with abundant cytoplasmic debris (cd). The “vesicle” wall is typically not delineated but may remain in less severe phenotypes. g Disrupted spline (sp) and malformed axonemes (f) are common in the mutant. Bars: A, B = 10 mm; C, D, E, F = 1 mm; G = 0.25 mm
Fig. 11
Fig. 11
Archegonial development at 21, 22 and 28 dpi. Reute (control) archegonia are open at 21 dpi (a) and fertilized at day 22 (b) (embryo development), at day 28 (c) a pre-meiotic early sporophyte has developed (Hiss et al. 2017). In contrast, hag1 archegonia in many cases do not open (red arrow) but develop a brownish coloration (blue arrow) or bleaching (purple arrow) 22 and 28 dpi. As soon as an analyzed antheridium or archegonium was classified as opened, the apex was not further analyzed (characterized as mature). In terms of closed gametangia, no open antheridium or archegonium was found onto the respective apex. The timepoints were chosen according to Hiss et al. (2017)
Fig. 12
Fig. 12
Analyses of opened Pphag1 archegonial neck cells and antheridia. A The archegonia of the Reute control as well as Pphag1 were analyzed in terms of archegonial opening 21, 22 and 28 dpi in three independent replicates. Pphag1 shows a significantly lower (asterisks) opened archegonia rate at every analyzed time point compared to the respective control (p < 0.05, Fisher’s exact test). The total number of analyzed archegonia per mutant line/control at each time point is shown to the right. The number of opened archegonia was calculated as percentage relative to the total number of counted archegonia. Averages of replicates are shown as horizontal lines. B The antheridia of the control as well as Pphag1 were analyzed 21, 22 and 28 dpi in terms of antheridial opening in three independent replicates. Pphag1 shows a significantly lower (asterisks) number of opened antheridia at every analyzed time point compared to the control (p < 0.01, Fisher’s exact test). The total number of analyzed antheridia per mutant line/control at each time point is shown to the right. The number of opened antheridia was calculated in percentage relative to the total number of counted antheridia. Averages of replicates are shown as horizontal lines
Fig. 13
Fig. 13
Gametangiophore development of Mphag1. Three independent replicates (dots) were analyzed. Green dots represent wild-type (control) lines, whereas blue dots represent mutant lines (m = male, f = female). Averages of replicates are shown as horizontal lines. The mutants develop significantly less gametangiophores per plant as compared with the control (p < 0.05, t test). See Table S6 for details per mutant line
Fig. 14
Fig. 14
Key regulators of bryophyte sexual reproduction. a P. patens reproductive organs (gametangia) develop on the apex of each gametophore (leafy shoot); archegonia are the egg-containing female and antheridia the spermatozoid-containing male organs. The latter undergo a complex developmental process starting with the development of the spermatid mother cell (SMC). After mitotic division, each SMC develops into two spermatozoids. During spermatozoid differentiation, autophagy and nuclear condensation take place to finally produce spermatozoids bearing two flagella, two mitochondria and one plastid. Mature antheridia release the motile spermatozoids under wet conditions. The motile male gamete subsequently swims through the archegonial venter to fertilize the egg cell in the cavity. After fertilization, the zygote starts to divide mitotically and embryo development and sporophyte development commences. b M. polymorpha is dioecious, and there are male and female vegetative thalli from which gametangiophores emerge that will develop gametangia. Reproductive structures and development are principally as described in (a), with pegged rhizoids (colored in red) delivering spermatozoids to archegonia (Shimamura 2016). a, b Several gene products involved in sexual reproduction (also mentioned in the text) are shown at their site of action, in the following description the function in flowering plants/animals is mentioned in square brackets for comparison. MpBNB [generative cell specification in pollen] (Yamaoka et al. 2018) and MpHAG1 (this study) [reduced fecundity, flower development] are involved in the protrusion of gametangia. Pphag1 (this study) leads to impaired gametangia maturation [reduced fecundity, flower development]. PpBELL1 [gynoecium/carpel development], MpRKD [egg cell differentiation] (Rovekamp et al. ; Koi et al. 2016) and PpLFY [floral identity] control the female germ line via zygote formation/egg cell maturation/first zygote division (Maizel et al. ; Horst et al. 2016b). PpCCDC39 [flagella of male animal sperm] (Meyberg et al. 2020), PpSWI3A/B (this study) [early embryo development, B male germ line; male fertility in animals] and PpBELL1 are involved in male germ line formation through proper flagella formation/late maturation of spermatozoids/putative control of male fecundity (Ortiz-Ramírez et al. 2017). MpRKD [egg cell differentiation] controls the differentiation of antheridial cells into spermatid mother cells, MpDUO1 the last step of spermatozoid formation [spermatid cell formation] (Higo et al. 2018). PpPRC2 controls the haploid body plan (represses the diploid body plan) [reproductive control in plants and animals] (Mosquna et al. ; Okano et al. 2009); PpKNOX2 controls the diploid body plan [also in flowering plants] (Sakakibara et al. 2013). PRC2 acts via deposition of H3K27me3 as a silencing mark (Katz et al. ; Ikeuchi et al. ; Kawashima and Berger 2014), while SWI/SNF acts antagonistically via H3K27 acetylation (shown by double-sided arrow). HAG1 also acts via activating acetylation, of H3K14

Similar articles

Cited by

References

    1. Aasland R, Stewart AF, Gibson T. The SANT domain: a putative DNA-binding domain in the SWI-SNF and ADA complexes, the transcriptional co-repressor N-CoR and TFIIIB. Trends Biochem Sci. 1996;21(3):87–88. - PubMed
    1. Althoff F, Kopischke S, Zobell O, Ide K, Ishizaki K, Kohchi T, Zachgo S. Comparison of the MpEF1alpha and CaMV35 promoters for application in Marchantia polymorpha overexpression studies. Transgenic Res. 2014;23(2):235–244. - PubMed
    1. Alver BH, Kim KH, Lu P, Wang X, Manchester HE, Wang W, Haswell JR, Park PJ, Roberts CW. The SWI/SNF chromatin remodelling complex is required for maintenance of lineage specific enhancers. Nat Commun. 2017;8:14648. - PMC - PubMed
    1. Aquea F, Johnston AJ, Canon P, Grossniklaus U, Arce-Johnson P. TRAUCO, a Trithorax-group gene homologue, is required for early embryogenesis in Arabidopsis thaliana. J Exp Bot. 2010;61(4):1215–1224. - PMC - PubMed
    1. Aquea F, Timmermann T, Herrera-Vasquez A. Chemical inhibition of the histone acetyltransferase activity in Arabidopsis thaliana. Biochem Biophys Res Commun. 2017;483(1):664–668. - PubMed

Publication types