. 2021 Jun;30(6):1169-1183.
doi: 10.1002/pro.4082. Epub 2021 Apr 26.

High-throughput identification of conditional MHCI ligands and scaled-up production of conditional MHCI complexes

Affiliations

High-throughput identification of conditional MHCI ligands and scaled-up production of conditional MHCI complexes

Martine Darwish et al. Protein Sci. 2021 Jun.

Abstract

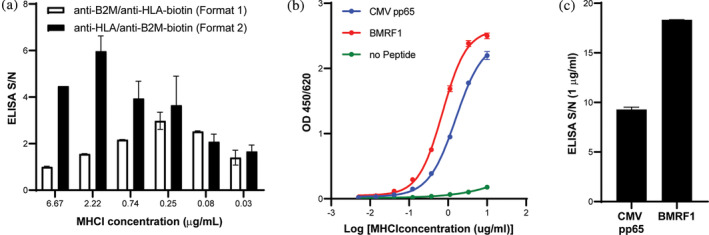
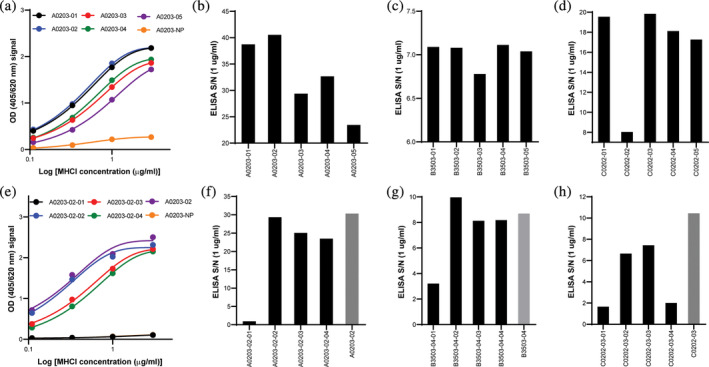
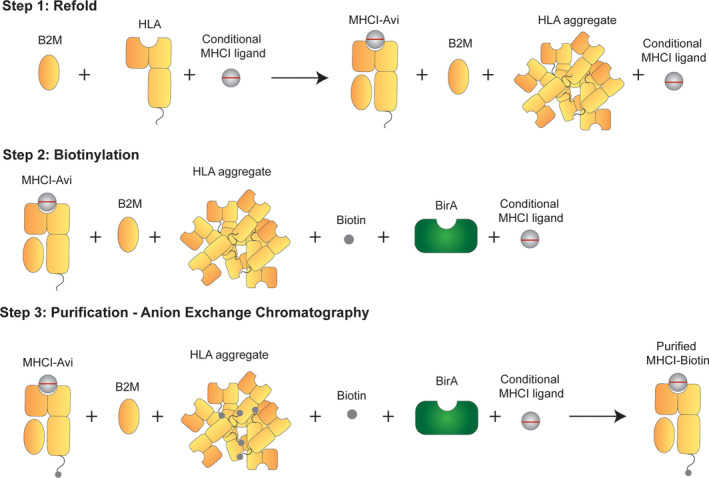
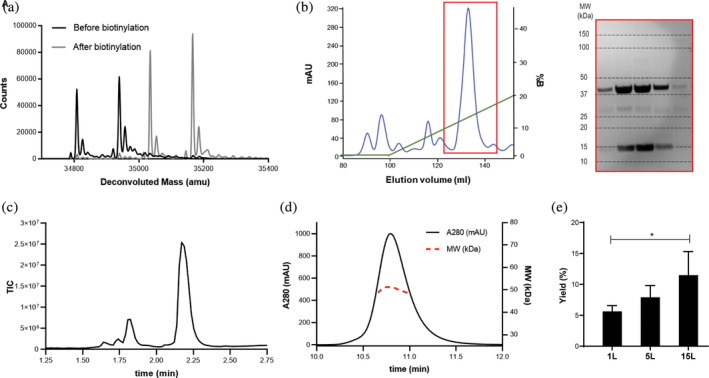
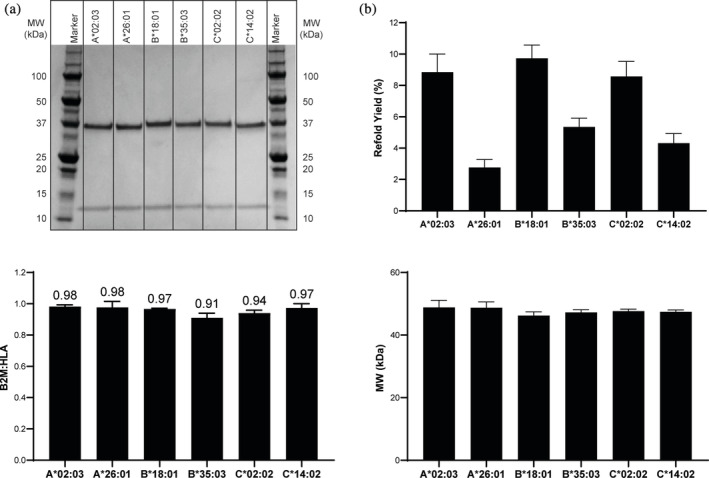
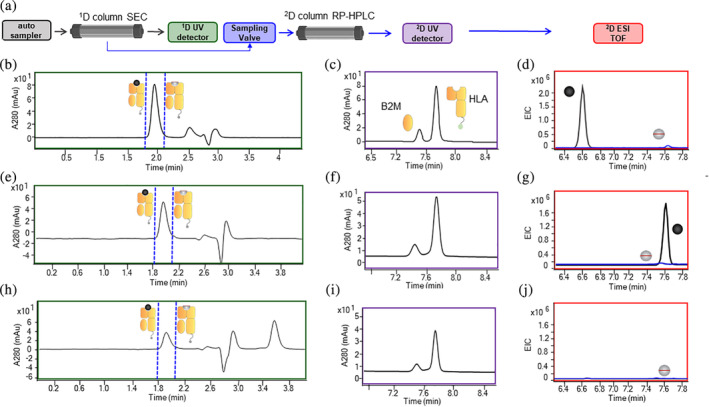
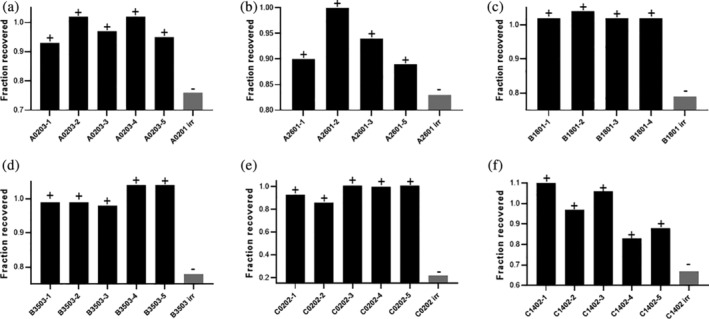
Despite the need to monitor the impact of Cancer Immunotherapy (CI)/Immuno-Oncology (IO) therapeutics on neoantigen-specific T-cell responses, very few clinical programs incorporate this aspect of immune monitoring due to the challenges in high-throughput (HTP) generation of Major Histocompatibility Complex Class I (MHCI) tetramers across a wide range of HLA alleles. This limitation was recently addressed through the development of MHCI complexes with peptides containing a nonnatural UV cleavable amino acid (conditional MHCI ligands) that enabled HTP peptide exchange upon UV exposure. Despite this advancement, the number of alleles with known conditional MHCI ligands is limited. We developed a novel workflow to enable identification and validation of conditional MHCI ligands across a range of HLA alleles. First, known peptide binders were screened via an enzyme-linked immunosorbent assay (ELISA) assay. Conditional MHCI ligands were designed using the highest-performing peptides and evaluated in the same ELISA assay. The top performers were then selected for scale-up production. Next-generation analytical techniques (LC/MS, SEC-MALS, and 2D LC/MS) were used to characterize the complex after refolding with the conditional MHCI ligands. Finally, we used 2D LC/MS to evaluate peptide exchange with these scaled-up conditional MHCI complexes after UV exposure with validated peptide binders. Successful peptide exchange was observed for all conditional MHCI ligands upon UV exposure, validating our screening approach. This approach has the potential to be broadly applied and enable HTP generation of MHCI monomers and tetramers across a wider range of HLA alleles, which could be critical to enabling the use of MHCI tetramers to monitor neoantigen-specific T-cells in the clinic.

Keywords: 2D liquid chromatography/mass spectrometry; MHCI; MHCI tetramers; conditional ligand; neoantigen.


Figures

FIGURE 1
FIGURE 1
ELISA assay development. (a) Comparison of ELISA formats. S/N values at MHCI concentration of 0.03–6.67 μg/mL for CMV pp65 and HLA‐A*02:01. (b) ELISA analysis of HLA‐A*02:01 after small scale refold with CMV pp65 (blue line), BMRF1 (red line) and no peptide (green line) for ELISA format 2. ELISA analysis was run at MHCI concentrations ranging from 0.005 to 3.33 μg/mL. (c) ELISA S/N values for ELISA Format 2 with MHCI complexes assembled with CMV pp65 and BMFR1 peptides and HLA‐A*02:01 at an MHCI concentration of 1 μg/mL
FIGURE 2
FIGURE 2
Identification of candidate conditional MHCI ligands for A*02:03, B*35:03 and C*02:02. (a) OD values for the five peptides screened with A*02:03 at various concentrations (0.1–3 μg/mL). S/N ELISA values for (b) A*02:03, (c) B*35:03 and (d) C*02:02 MHC complexes with selected peptides at 1 μg/mL. (e) OD values for the four conditional MHCI ligands derived from peptide A02:03‐02 screened with HLA‐A*02:03 at various concentrations. S/N values for (f) HLA A*02:03, (g) B*35:03‐05 and (h) C*02:02‐03 MHC complexes with the selected conditional MHCI ligands derived from the peptides identified in (b), (c), and (d). Peptides not containing the engineered J amino acids (parent peptide) were used as internal controls (gray bars). For all assays, the no peptide (NP) was used as a negative control
FIGURE 3
FIGURE 3
Schematic of scaled‐up production of A*02:01 MHCI monomer. The first step in the protocol developed for scaled‐up production of MHCI complexes is to mix all refold components and allow the refold to occur. The second step is in‐process biotinylation, followed by anion exchange chromatography in the third step
FIGURE 4
FIGURE 4
Biotinylation analysis, purification, and characterization of scaled‐up, refolded A*02:01 MHCI monomer. (a) LC/MS analysis of the HLA allele in the refolded MHCI reaction mixture before (black line) and after (gray line) biotinylation. The two peaks correspond to the full‐length HLA and truncated HLA with N‐terminal cleavage of the methionine. The shift in both peaks after biotinylation corresponds to the MW of biotin. (b) Anion exchange chromatogram of the biotinylated MHCI complex after refold and SDS‐PAGE analysis of the fractions collected in the red highlighted box. The MW of the SDS‐PAGE bands correspond to B2M (13 kDa) and HLA (37 kDa). (c) LC/MS TIC chromatogram of the purified MHCI complex. The peaks at 1.625 and 1.74 min correspond to the UV‐peptide and the peaks at 1.8 and 2.2 min correspond to B2M and HLA, respectively. (d) SEC‐MALS analysis of the purified MHCI complex. The black line corresponds to the A280 chromatogram (left y axis) and the red line corresponds to the MW analysis (right y axis). (e) MHCI % yields (mg purified MHCI/mg MHCI in refold*100) ± standard deviation (N = 3) after purification at the 1, 5, and 15 L scale
FIGURE 5
FIGURE 5
Scale up production, purification and characterization of conditional MHCI complexes. (a) SDS‐PAGE analysis, (b) Average refold % yield (mg purified MHCI/mg MHCI in refold*100) ± standard deviation (N = 3), (c) Average B2M to HLA ratio ± standard deviation (N = 3) and (d) Average SEC‐MALS MW analysis ± standard deviation (N = 3) of purified refolded MHCI complexes generated with the conditional MHCI ligands identified in the small scale screen
FIGURE 6
FIGURE 6
2D LC/MS analysis of peptide exchange. (a) Schematic of the 2D LC/MS workflow. (b) A280 nm SEC chromatogram of the first dimension in the 2D LC/MS analysis of HLA‐A*02:01 MHCI complex after exchange with CMV pp65. The blue dotted line defines the region that was collected and injected into the second column. (c) A280 nm SEC chromatogram of the second dimension in the 2D LC/MS analysis of HLA‐A*02:01 MHCI complex after exchange with CMV pp65. (d) EIC chromatogram of the exchange peptide (black line) and conditional MHCI ligand (blue line) in the second dimension in the 2D LC/MS analysis of HLA‐A*02:01 MHCI complex after exchange with CMV pp65. (e) A280 nm SEC chromatogram of the first dimension in the 2D LC/MS analysis of A*02:03 MHCI complex after exchange with A0203‐05 peptide. The blue dotted line defines the region that was collected and injected into the second column. (f) A280 nm SEC chromatogram of the second dimension in the 2D LC/MS analysis of A*02:03 MHCI complex after exchange with A0203‐05 peptide. (g) EIC chromatogram of the exchange peptide (black line) and conditional MHCI ligand (blue line) in the second dimension in the 2D LC/MS analysis of HLA‐A*02:03 MHCI complex after exchange with A0203‐05 peptide. (h) A280 nm SEC chromatogram of the first dimension in the 2D LC/MS analysis of A0*02:03 MHCI complex after exchange with a known nonbinding peptide. The blue dotted line defines the region that was collected and injected into the second column. (i) A280 nm SEC chromatogram of the second dimension in the 2D LC/MS analysis of A*02:03 MHCI complex after exchange with nonbinding peptide. (g) EIC chromatogram of the exchange peptide (black line) and conditional MHCI ligand (blue line) in the second dimension in the 2D LC/MS analysis of HLA‐A*02:03 MHCI complex after exchange with irrelevant peptide
FIGURE 7
FIGURE 7
Quantification of the first dimension A280 MHCI peak after peptide exchange in the 2D LC/MS analysis. Fraction of MHCI peak area after peptide exchange relative to the peak area before peptide exchange for (a) A*02:03, (b) A*26:01, (c) B*18:01, (d) B*35:03, (e) C*02:02, and (f) C*14:02 for positive control peptides (known binders, black bars) and non binder peptide (gray bar). The positive symbol indicates the exchange peptide was observed in the EIC analysis of the second dimension and a negative symbol indicates the exchange peptide was not observed in the EIC analysis

References

    1. Chen DS, Mellman I. Oncology meets immunology: The cancer‐immunity cycle. Immunity. 2013;39:1–10. - PubMed
    1. van Rooij N, van Buuren MM, Philips D, et al. Tumor exome analysis reveals neoantigen‐specific T‐cell reactivity in an ipilimumab‐responsive melanoma. J Clin Oncol. 2013;31:e439–e442. - PMC - PubMed
    1. Slaney CY, Kershaw MH, Darcy PK. Trafficking of T cells into tumors. Cancer Res. 2014;74:7168–7174. - PubMed
    1. Melero I, Rouzaut A, Motz GT, Coukos G. T‐cell and NK‐cell infiltration into solid tumors: A key limiting factor for efficacious cancer immunotherapy. Cancer Discov. 2014;4:522–526. - PMC - PubMed
    1. Zamora AE, Crawford JC. Thomas PG (2018) hitting the target: How T cells detect and eliminate tumors. J Immunol. 2018;200:392–399. - PMC - PubMed