

Impact of lockdown during the COVID-19 outbreak on multi-scale air quality
- PMID: 33841025
- PMCID: PMC8018787
- DOI: 10.1016/j.atmosenv.2021.118386
Impact of lockdown during the COVID-19 outbreak on multi-scale air quality
Abstract
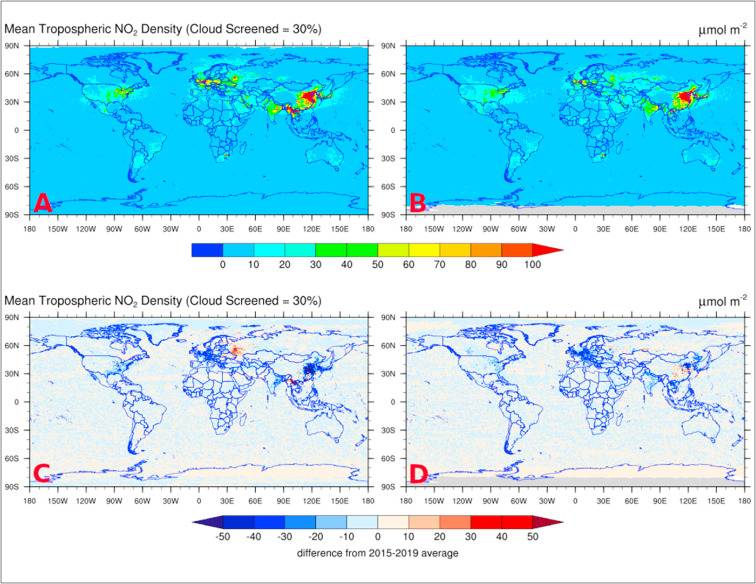
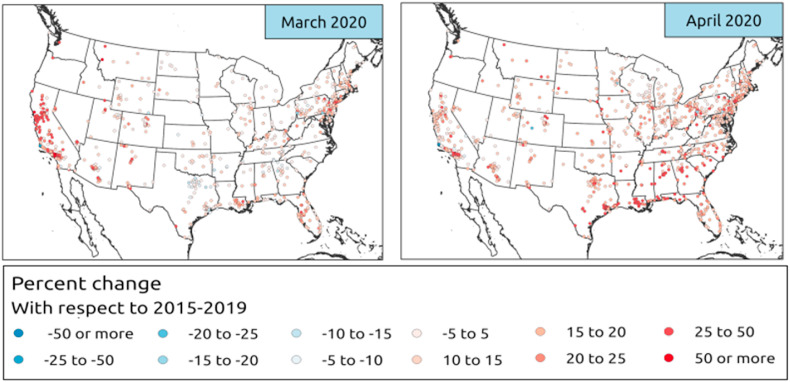
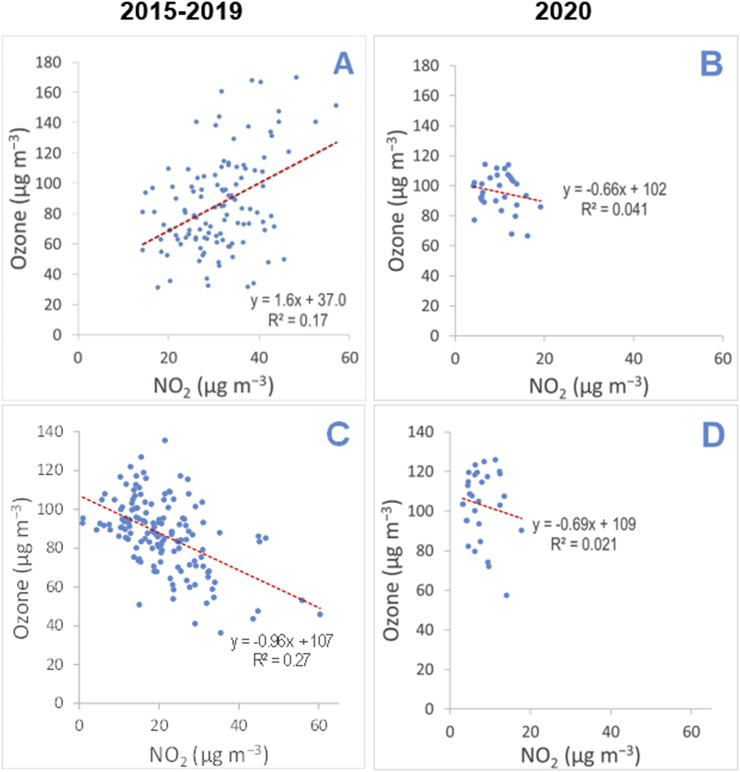
One of the multi-facet impacts of lockdowns during the unprecedented COVID-19 pandemic was restricted economic and transport activities. This has resulted in the reduction of air pollution concentrations observed globally. This study is aimed at examining the concentration changes in air pollutants (i.e., carbon monoxide (CO), nitrogen dioxide (NO2), sulfur dioxide (SO2), ozone (O3), and particulate matters (PM2.5 and PM10) during the period March-April 2020. Data from both satellite observations (for NO2) and ground-based measurements (for all other pollutants) were utilized to analyze the changes when compared against the same months between 2015 and 2019. Globally, space borne NO2 column observations observed by satellite (OMI on Aura) were reduced by approximately 9.19% and 9.57%, in March and April 2020, respectively because of public health measures enforced to contain the coronavirus disease outbreak (COVID-19). On a regional scale and after accounting for the effects of meteorological variability, most monitoring sites in Europe, USA, China, and India showed declines in CO, NO2, SO2, PM2.5, and PM10 concentrations during the period of analysis. An increase in O3 concentrations occurred during the same period. Meanwhile, four major cities case studies i.e. in New York City (USA), Milan (Italy), Wuhan (China), and New Delhi (India) have also shown a similar reduction trends as observed on the regional scale, and an increase in ozone concentration. This study highlights that the reductions in air pollutant concentrations have overall improved global air quality likely driven in part by economic slowdowns resulting from the global pandemic.
Keywords: Air pollution; COVID-19; Global analysis; Ground-based measurements; Satellite measurements.
© 2021 Elsevier Ltd. All rights reserved.
Conflict of interest statement
The authors declare that they have no known competing financial interests or personal relationships that could have appeared to influence the work reported in this paper.
Figures


Similar articles
-
Unexpected rise of ozone in urban and rural areas, and sulfur dioxide in rural areas during the coronavirus city lockdown in Hangzhou, China: implications for air quality.Environ Chem Lett. 2020;18(5):1713-1723. doi: 10.1007/s10311-020-01028-3. Epub 2020 Jun 12. Environ Chem Lett. 2020. PMID: 32837481 Free PMC article.
-
A global observational analysis to understand changes in air quality during exceptionally low anthropogenic emission conditions.Environ Int. 2021 Dec;157:106818. doi: 10.1016/j.envint.2021.106818. Epub 2021 Aug 20. Environ Int. 2021. PMID: 34425482
-
Unprecedented reduction in air pollution and corresponding short-term premature mortality associated with COVID-19 lockdown in Delhi, India.J Air Waste Manag Assoc. 2021 Sep;71(9):1085-1101. doi: 10.1080/10962247.2021.1905104. Epub 2021 Apr 15. J Air Waste Manag Assoc. 2021. PMID: 33764280
-
The impact of COVID-19 lockdown on air pollution in Europe and North America: a systematic review.Eur J Public Health. 2022 Nov 29;32(6):962-968. doi: 10.1093/eurpub/ckac118. Eur J Public Health. 2022. PMID: 36074061 Free PMC article.
-
Association between exposure to ambient air pollution and hospital admission, incidence, and mortality of stroke: an updated systematic review and meta-analysis of more than 23 million participants.Environ Health Prev Med. 2021 Jan 26;26(1):15. doi: 10.1186/s12199-021-00937-1. Environ Health Prev Med. 2021. PMID: 33499804 Free PMC article.
Cited by
-
Unraveling the O3-NOX-VOCs relationships induced by anomalous ozone in industrial regions during COVID-19 in Shanghai.Atmos Environ (1994). 2023 Sep 1;308:119864. doi: 10.1016/j.atmosenv.2023.119864. Epub 2023 May 23. Atmos Environ (1994). 2023. PMID: 37250918 Free PMC article.
-
NASA Satellite Measurements Show Global-Scale Reductions in Free Tropospheric Ozone in 2020 and Again in 2021 During COVID-19.Geophys Res Lett. 2022 Aug 16;49(15):e2022GL098712. doi: 10.1029/2022GL098712. Epub 2022 Aug 12. Geophys Res Lett. 2022. PMID: 36247521 Free PMC article.
-
COVID-19 pandemic: What can we learn for better air quality and human health?J Infect Public Health. 2022 Feb;15(2):187-198. doi: 10.1016/j.jiph.2021.12.001. Epub 2021 Dec 4. J Infect Public Health. 2022. PMID: 34979337 Free PMC article. Review.
-
Understanding Air Quality Changes after Implementation of Mitigation Measures during a Pandemic: A Scoping Review of Literature in the United States.Aerosol Air Qual Res. 2022 Nov;22(11):10.4209/aaqr.220047. doi: 10.4209/aaqr.220047. Aerosol Air Qual Res. 2022. PMID: 39100887 Free PMC article.
-
Dramatic Lockdown Fossil Fuel CO2 Decrease Detected by Citizen Science-Supported Atmospheric Radiocarbon Observations.Environ Sci Technol. 2022 Jul 19;56(14):9882-9890. doi: 10.1021/acs.est.1c07994. Epub 2022 Jun 27. Environ Sci Technol. 2022. PMID: 35759540 Free PMC article.
References
-
- Allu S.K., Reddy A., Srinivasan S., Maddala R.K., Anupoju G.R. Environmental Processes; 2021. Surface Ozone and its Precursor Gases Concentrations during COVID-19 Lockdown and Pre-lockdown Periods in Hyderabad City, India. - DOI
-
- Battye W., Aneja V.P., Schlesinger W.H. Is nitrogen the next carbon? Earth’s Future. 2017;5:894–904. doi: 10.1002/2017EF000592. - DOI
-
- Battye W.H., Bray C.D., Uttamang P., Aneja V.P. University Press of Florida; Gainesville, FL 32609: 2020. “Ozone in Urban North Carolina: A Sustainability Case Study,” Chapter 9, Case Studies in Suburban Sustainability; pp. 167–184. - DOI
LinkOut - more resources
Full Text Sources
Other Literature Sources
Miscellaneous