. 2021;19(3):769-783.
doi: 10.1007/s11150-021-09560-z. Epub 2021 Apr 7.

Unequal consequences of Covid 19: representative evidence from six countries

Affiliations

Unequal consequences of Covid 19: representative evidence from six countries

Michèle Belot et al. Rev Econ Househ. 2021.

Abstract

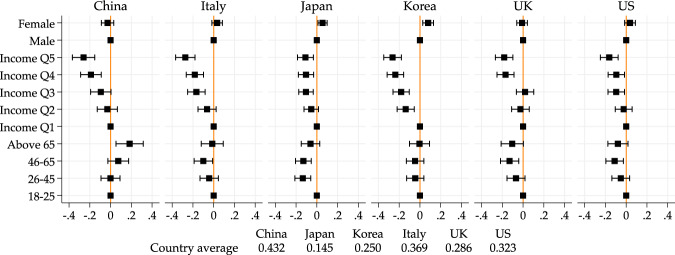
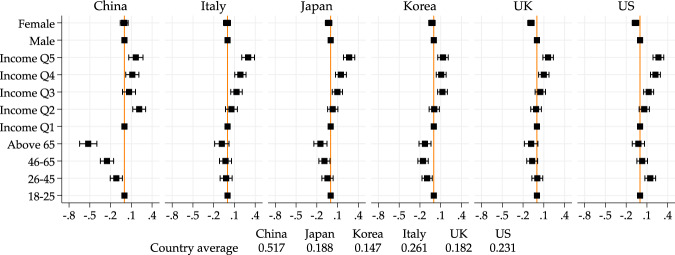
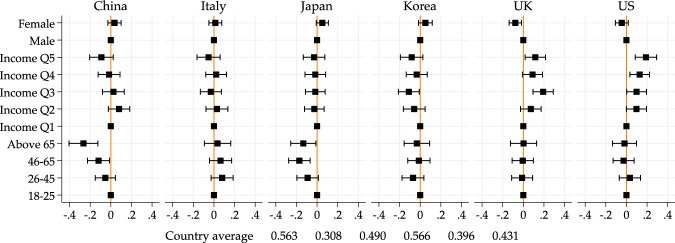
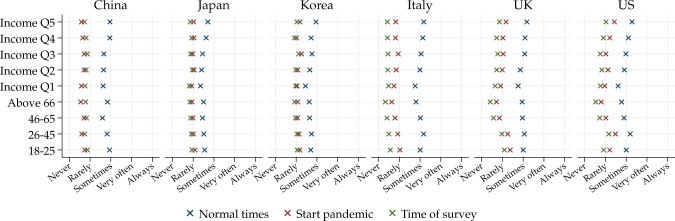
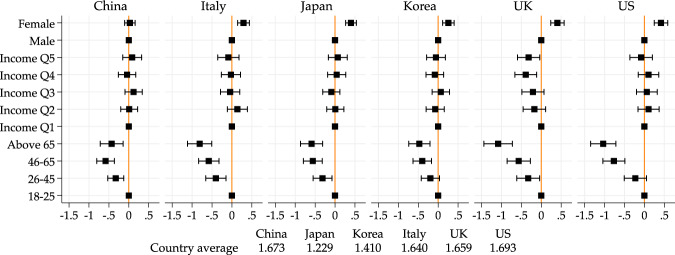
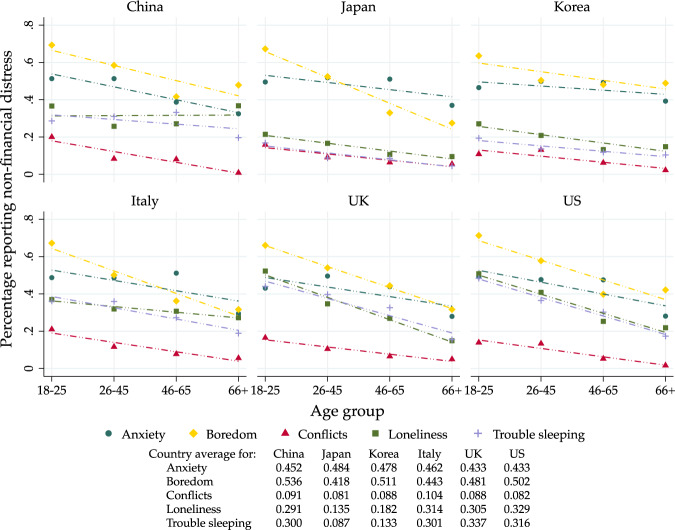
Covid-19 and the measures taken to contain it have led to unprecedented constraints on work and leisure activities, across the world. This paper uses nationally representative surveys to document how people of different ages and incomes have been affected in the early phase of the pandemic. The data was collected in six countries (China, South Korea, Japan, Italy, UK, and US) in the third week of April 2020. First, we document changes in job circumstances and social activities. Second, we document self-reported negative and positive consequences of the crisis on well-being. We find that young people have experienced more drastic changes to their life and have been most affected economically and psychologically. There is less of a systematic pattern across income groups. While lower income groups have been more affected economically, higher income groups have experienced more changes in their social life and spending. A large fraction of people of low and high income groups report negative effects on well-being.

Keywords: H0; H3; I1; I3; J0.


Conflict of interest statement

Conflict of interestThe authors declare no competing interests.

Figures

Fig. 1
Fig. 1
Age and income gradients on losing job at least temporarily. Note: Point estimates and 95% confidence intervals from a linear regression model of job loss (permanent or temporary) on income quintile, age group, gender, geographical controls, and employment status pre-pandemic. Figure based on regression results in Table A1. Male, 18–25 and Income Q1 are baseline categories for gender, age and income quintile groups, respectively. Country averages of the outcome variables used for the regression are reported below the figure
Fig. 2
Fig. 2
Age and income gradients on teleworking. Note: Point estimates and 95% confidence intervals from a linear regression model of government support on income quintile, age group, gender, geographical controls, and employment status pre-pandemic. Figure based on regression results in Table A2. Male, 18–25 and Income Q1 are baseline categories for gender, age and income quintile groups, respectively. Country averages of the outcome variables used for the regression are reported below the figure
Fig. 3
Fig. 3
Age and income gradients on drop in household spending. Note: Point estimates and 95% confidence intervals from a linear probability model of an indicator variable. This indicator denotes whether respondents reports a drop in household consumption. Covariates include income quintile, age group, gender, geographical controls and employment status pre-pandemic. Figure based on regression results in Table A3. Male, 18–25 and Income Q1 are baseline categories for gender, age and income quintile groups, respectively. Country average of the outcome variables used for the regression are reported below the figure
Fig. 4
Fig. 4
Social interactions over time, by age and income groups. Note: We report group averages of an index that includes frequency of (i) participation in large social gatherings, (ii) visit to large open spaces, (iii) large close spaces, and (iv) visits to friends or family. The index is constructed by averaging (i)–(iv) frequencies on a 1–5 scale, where “1” is “Never” and “5” is “Always”
Fig. 5
Fig. 5
Age and income gradients on negative well-being. Note: Point estimates and 95% confidence intervals from a linear regression model of number of negative well-being consequences of the pandemic (which include: (i) boredom, (ii) loneliness, (iii) trouble sleeping, (iv) general anxiety and stress, and (v) increased conflicts with friends/family/neighbors) on income quintile, age group, gender and geographical controls. Figure based on regression results in Table A4. Male, 18–25 and Income Q1 are baseline categories for gender, age and income quintile groups, respectively. Country averages of the outcome variable used for the regression are reported below the figure
Fig. 6
Fig. 6
Age gradients on negative well-being. Note: We report group averages for the probability of experiencing each one of the negative well-being effects we asked about: Anxiety, Boredom, Conflict with friends/family/neighbors, Loneliness and Trouble sleeping. Dashed lines represent linear fits. Country averages of the outcome variable are reported below the figure

References

    1. Acemoglu, D., Chernozhukov, V., Werning, I., & Whinston, M.D. (2020). A multi-risk SIR model with optimally targeted lockdown. NBER Working Paper Series No 27102, 1–38.
    1. Adams, A., Boneva, T., Rauh, C., & Golin, M. (2020). Inequality in the Impact of the Coronavirus Shock: New Survey Evidence for the UK. Cambridge Working Papers in Economics 2023, 1–14.
    1. Ainoa Aparicio F, Grossbard S. Intergenerational residence patterns and COVID-19 fatalities in the EU and the US. Economics & Human Biology. 2020;39:100934. doi: 10.1016/j.ehb.2020.100934. - DOI - PMC - PubMed
    1. Alon, T. M., Doepke, M., Olmstead-Rumsey, J., & Tertilt, M. (2020). The Impact of COVID-19 on Gender Equality. NBER Working Paper Series No 26947, 1–37.
    1. Belot M, Choi S, Jamison JC, Papageorge NW, Tripodi E, van den Broek-Altenburg E. Six-Country Survey on Covid-19. Covid Economics. 2020;17:205–219.

LinkOut - more resources