

IRE1α-XBP1 Affects the Mitochondrial Function of Aβ25-35-Treated SH-SY5Y Cells by Regulating Mitochondria-Associated Endoplasmic Reticulum Membranes
- PMID: 33841100
- PMCID: PMC8027129
- DOI: 10.3389/fncel.2021.614556
IRE1α-XBP1 Affects the Mitochondrial Function of Aβ25-35-Treated SH-SY5Y Cells by Regulating Mitochondria-Associated Endoplasmic Reticulum Membranes
Abstract
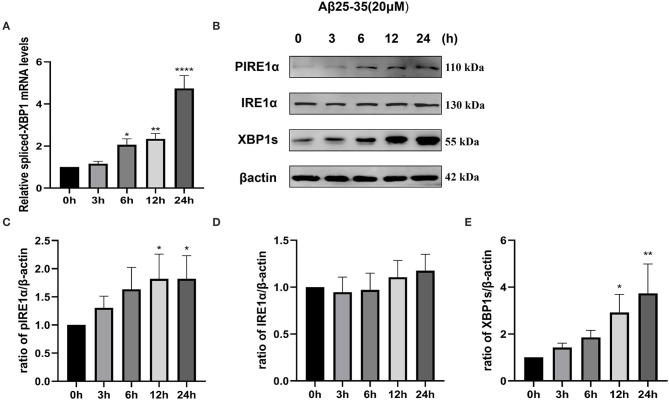
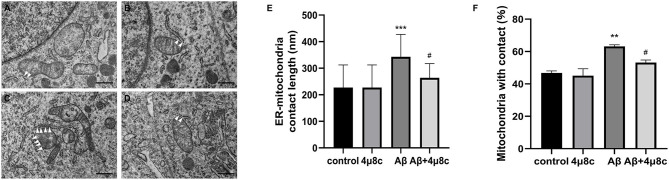
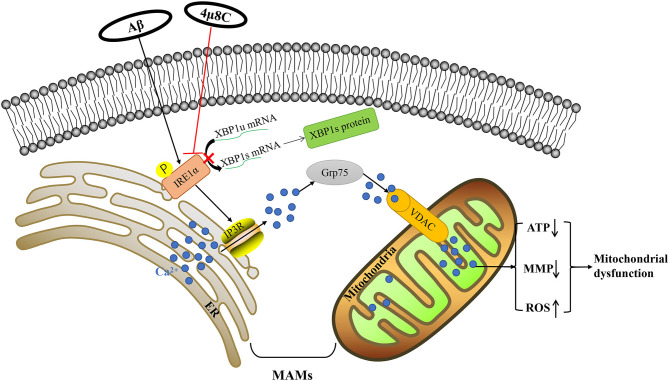
Background: Neurotoxicity induced by the amyloid beta (Aβ) peptide is one of the most important pathological mechanisms of Alzheimer's disease (AD). Activation of the adaptive IRE1α-XBP1 pathway contributes to the pathogenesis of AD, making it a potential target for AD therapeutics. However, the mechanism of IRE1α-XBP1 pathway involvement in AD is unclear. We, therefore, investigated the effect of the IRE1α-XBP1 axis in an in vitro AD model and explored its potential mechanism. Methods: The human neuroblastoma cell line, SH-SY5Y, was used. Cells were treated with Aβ25-35, with or without 4μ8c, an inhibitor of IRE1α. Cells were collected and analyzed by Western blotting, quantitative real-time PCR, electron microscopy, fluorescence microscopy, calcium imaging, and other biochemical assays. Results: Aβ-exposed SH-SY5Y cells showed an increased expression of XBP1s and p-IRE1α. 3-(4,5-dimethylthiazol-2-yl)-2,5-diphenyltetrazolium bromide (MTT) and calcium imaging analysis showed that the IRE1α inhibitor, 4μ8c, reduced Aβ-induced cytotoxicity. Increased levels of ATP, restoration of mitochondrial membrane potential, and decreased production of mitochondrial reactive oxygen species after Aβ treatment in the presence of 4μ8c showed that inhibiting the IRE1α-XBP1 axis effectively mitigated Aβ-induced mitochondrial dysfunction in SH-SY5Y cells. Furthermore, Aβ treatment increased the expression and interaction of IP3R, Grp75, and vdac1 and led to an increased endoplasmic reticulum (ER)-mitochondria association, malfunction of mitochondria-associated ER-membranes (MAMs), and mitochondrial dysfunction. These deficits were rescued by inhibiting the IRE1α-XBP1 axis. Conclusion: These findings demonstrate that Aβ peptide induces the activation of the IRE1α-XBP1 axis, which may aggravate cytotoxicity and mitochondrial impairment in SH-SY5Y cells by targeting MAMs. Inhibition of the IRE1α-XBP1 axis provides the protection against Aβ-induced injury in SH-SY5Y cells and may, therefore, be a new treatment strategy.
Keywords: Alzheheimer's disease; IRE1α-XBP1; amyloid-beta-protein; cytotoxicity; mitochondria associated ER membranes; mitochondria impairment.
Copyright © 2021 Chu, Li, Cao, Li, Jin, Yang, Xu, Wang and Bi.
Conflict of interest statement
The authors declare that the research was conducted in the absence of any commercial or financial relationships that could be construed as a potential conflict of interest.
Figures


Similar articles
-
The contribution of mitochondria-associated endoplasmic reticulum membranes (MAMs) dysfunction in Alzheimer's disease and the potential countermeasure.Front Neurosci. 2023 Mar 7;17:1158204. doi: 10.3389/fnins.2023.1158204. eCollection 2023. Front Neurosci. 2023. PMID: 36960176 Free PMC article. Review.
-
Upregulation of miR-34a by Inhibition of IRE1α Has Protective Effect against Aβ-Induced Injury in SH-SY5Y Cells by Targeting Caspase-2.Oxid Med Cell Longev. 2019 Jun 2;2019:2140427. doi: 10.1155/2019/2140427. eCollection 2019. Oxid Med Cell Longev. 2019. PMID: 31281568 Free PMC article.
-
Differential impact of imipramine on thapsigargin- and tunicamycin-induced endoplasmic reticulum stress and mitochondrial dysfunction in neuroblastoma SH-SY5Y cells.Eur J Pharmacol. 2021 Jul 5;902:174073. doi: 10.1016/j.ejphar.2021.174073. Epub 2021 Mar 31. Eur J Pharmacol. 2021. PMID: 33798597
-
Neural stem cell-conditioned medium ameliorates Aβ25-35-induced damage in SH-SY5Y cells by protecting mitochondrial function.Bosn J Basic Med Sci. 2021 Apr 1;21(2):179-186. doi: 10.17305/bjbms.2020.4570. Bosn J Basic Med Sci. 2021. PMID: 32156251 Free PMC article.
-
SIRT3 ameliorates diabetes-associated cognitive dysfunction via regulating mitochondria-associated ER membranes.J Transl Med. 2023 Jul 22;21(1):494. doi: 10.1186/s12967-023-04246-9. J Transl Med. 2023. PMID: 37481555 Free PMC article.
Cited by
-
ATF4-dependent increase in mitochondrial-endoplasmic reticulum tethering following OPA1 deletion in skeletal muscle.J Cell Physiol. 2024 Apr;239(4):e31204. doi: 10.1002/jcp.31204. Epub 2024 Feb 28. J Cell Physiol. 2024. PMID: 38419397 Free PMC article.
-
Endoplasmic reticulum stress induces mitochondrial dysfunction but not mitochondrial unfolded protein response in SH-SY5Y cells.Mol Cell Biochem. 2022 Mar;477(3):965-975. doi: 10.1007/s11010-021-04344-6. Epub 2022 Jan 31. Mol Cell Biochem. 2022. PMID: 35098438
-
The contribution of mitochondria-associated endoplasmic reticulum membranes (MAMs) dysfunction in Alzheimer's disease and the potential countermeasure.Front Neurosci. 2023 Mar 7;17:1158204. doi: 10.3389/fnins.2023.1158204. eCollection 2023. Front Neurosci. 2023. PMID: 36960176 Free PMC article. Review.
-
MAMs and Mitochondrial Quality Control: Overview and Their Role in Alzheimer's Disease.Neurochem Res. 2024 Oct;49(10):2682-2698. doi: 10.1007/s11064-024-04205-w. Epub 2024 Jul 13. Neurochem Res. 2024. PMID: 39002091 Review.
-
A novel biomimetic nanovesicle containing caffeic acid-coupled carbon quantum dots for the the treatment of Alzheimer's disease via nasal administration.J Nanobiotechnology. 2024 Oct 19;22(1):642. doi: 10.1186/s12951-024-02912-8. J Nanobiotechnology. 2024. PMID: 39425199 Free PMC article.
References
LinkOut - more resources
Full Text Sources
Other Literature Sources