. 2021 Mar 26:15:661412.
doi: 10.3389/fncel.2021.661412. eCollection 2021.

The Effect of GLT-1 Upregulation on Extracellular Glutamate Dynamics

Affiliations

The Effect of GLT-1 Upregulation on Extracellular Glutamate Dynamics

Crystal M Wilkie et al. Front Cell Neurosci. .

Abstract

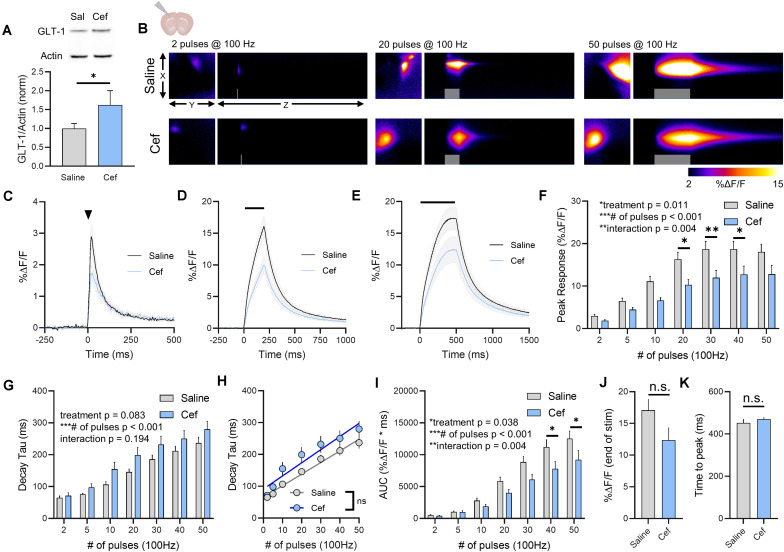
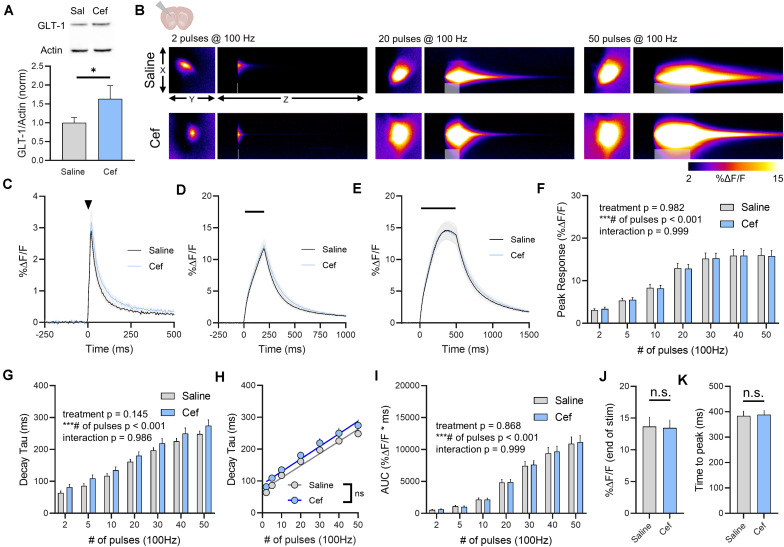
Pharmacological upregulation of glutamate transporter-1 (GLT-1), commonly achieved using the beta-lactam antibiotic ceftriaxone, represents a promising therapeutic strategy to accelerate glutamate uptake and prevent excitotoxic damage in neurological conditions. While excitotoxicity is indeed implicated in numerous brain diseases, it is typically restricted to select vulnerable brain regions, particularly in early disease stages. In healthy brain tissue, the speed of glutamate uptake is not constant and rather varies in both an activity- and region-dependent manner. Despite the widespread use of ceftriaxone in disease models, very little is known about how such treatments impact functional measures of glutamate uptake in healthy tissue, and whether GLT-1 upregulation can mask the naturally occurring activity-dependent and regional heterogeneities in uptake. Here, we used two different compounds, ceftriaxone and LDN/OSU-0212320 (LDN), to upregulate GLT-1 in healthy wild-type mice. We then used real-time imaging of the glutamate biosensor iGluSnFR to investigate functional consequences of GLT-1 upregulation on activity- and regional-dependent variations in glutamate uptake capacity. We found that while both ceftriaxone and LDN increased GLT-1 expression in multiple brain regions, they did not prevent activity-dependent slowing of glutamate clearance nor did they speed basal clearance rates, even in areas characterized by slow uptake (e.g., striatum). Unexpectedly, ceftriaxone but not LDN decreased glutamate release in the cortex, suggesting that ceftriaxone may alter release properties independent of its effects on GLT-1 expression. In sum, our data demonstrate the complexities of glutamate uptake by showing that GLT-1 expression does not necessarily translate to accelerated uptake. Furthermore, these data suggest that the mechanisms underlying activity- and regional-dependent differences in glutamate dynamics are independent of GLT-1 expression levels.

Keywords: ceftriaxone; glutamate transporter; iGluSnFR; neurotransmission; uptake.


Conflict of interest statement

The authors declare that the research was conducted in the absence of any commercial or financial relationships that could be construed as a potential conflict of interest.

Figures

FIGURE 1
FIGURE 1
The effect of ceftriaxone on glutamate dynamics in the hippocampus. (A) GLT-1 expression in hippocampal tissue from saline and ceftriaxone (Cef)-treated mice. (B) Representative images depicting the iGluSnFR response evoked by 2 (left), 20 (middle), and 50 (right) pulses of electrical stimulation at 100 Hz in saline- (top) and Cef-treated (bottom) mice. X–Y images (2048 × 2048 μm) depict the maximal projection image of the iGluSnFR response, while the X–Z image (2048 μm vertically x 1945 ms horizontally) depicts the iGluSnFR response over time (z-axis). Gray shading indicates the onset and duration of electrical stimulation at 100 Hz. (C–E) Mean (± S.E.M in gray) iGluSnFR responses to 2 (C), 20 (D), and 50 (E) pulses at 100 Hz in saline- and Cef-treated mice. Electrical stimulation is denoted by the arrowhead in (C) and the horizontal lines in (D) and (E). (F) Mean (± S.E.M) iGluSnFR response peaks. (G) Mean (± S.E.M) iGluSnFR decay tau values. (H) Linear regression to assess the magnitude of the activity-dependent increase in iGluSnFR decay tau. (I) Mean (± S.E.M) iGluSnFR area under the curve (AUC). (J) Mean (± S.E.M) of the iGluSnFR response size (%ΔF/F) at the termination of the 50-pulse stimulation paradigm (50 pulses at 100 Hz). (K) Mean (± S.E.M) of the time required for the iGluSnFR response to reach a peak during the 50-pulse stimulation paradigm. ∗∗p < 0.01, ∗∗∗p < 0.001. n.s. not significant. Brain slice schematic in (B) was created using Biorender.com.
FIGURE 2
FIGURE 2
The effect of ceftriaxone on glutamate dynamics in the cortex. (A) GLT-1 expression in cortical tissue from saline and ceftriaxone (Cef)-treated mice. (B) Representative images depicting the iGluSnFR response evoked by 2 (left), 20 (middle), and 50 (right) pulses of electrical stimulation at 100 Hz in saline- (top) and Cef-treated (bottom) mice. X–Y images (2048 × 2048 μm) depict the maximal projection image of the iGluSnFR response, while the X–Z image (2048 μm vertically x 1945 ms horizontally) depicts the iGluSnFR response over time (z-axis). Gray shading indicates the onset and duration of electrical stimulation at 100 Hz. (C–E) Mean (± S.E.M in gray) iGluSnFR responses to 2 (C), 20 (D), and 50 (E) pulses at 100 Hz in saline- and Cef-treated mice. Electrical stimulation is denoted by the arrowhead in (C) and the horizontal lines in (D) and (E). (F) Mean (± S.E.M) iGluSnFR response peaks. (G) Mean (± S.E.M) iGluSnFR decay tau values. (H) Linear regression to assess the magnitude of the activity-dependent increase in iGluSnFR decay tau. (I) Mean (± S.E.M) iGluSnFR area under the curve (AUC). (J) Mean (± S.E.M) of the iGluSnFR response size (%ΔF/F) at the termination of the 50-pulse stimulation paradigm (50 pulses at 100 Hz). (K) Mean (± S.E.M) of the time required for the iGluSnFR response to reach a peak during the 50-pulse stimulation paradigm. Sidak’s multiple comparisons post hoc test was used in (F) and (I). p < 0.05, ∗∗p < 0.01, ∗∗∗p < 0.001. n.s. not significant. Brain slice schematic in (B) was created using Biorender.com.
FIGURE 3
FIGURE 3
The effect of ceftriaxone on glutamate dynamics in the striatum. (A) GLT-1 expression in striatal tissue from saline and ceftriaxone (Cef)-treated mice. (B) Representative images depicting the iGluSnFR response evoked by 2 (left), 20 (middle) and 50 (right) pulses of electrical stimulation at 100 Hz in saline- (top) and Cef-treated (bottom) mice. X–Y images (2048 × 2048 μm) depict the maximal projection image of the iGluSnFR response while the X–Z image (2048 μm vertically x 1945 ms horizontally) depicts the iGluSnFR response over time (z-axis). Gray shading indicates the onset and duration of electrical stimulation at 100 Hz. (C–E) Mean (± S.E.M in gray) iGluSnFR responses to 2 (C), 20 (D), and 50 (E) pulses at 100 Hz in saline- and Cef-treated mice. Electrical stimulation is denoted by the arrowhead in (C) and the horizontal lines in (D) and (E). (F) Mean (± S.E.M) iGluSnFR response peaks. (G) Mean (± S.E.M) iGluSnFR decay tau values. (H) Linear regression to assess the magnitude of the activity-dependent increase in iGluSnFR decay tau. (I) Mean (± S.E.M) iGluSnFR area under the curve (AUC). (J) Mean (± S.E.M) of the iGluSnFR response size (%ΔF/F) at the termination of the 50-pulse stimulation paradigm (50 pulses at 100 Hz). (K) Mean (± S.E.M) of the time required for the iGluSnFR response to reach a peak during the 50-pulse stimulation paradigm. p < 0.05, ∗∗∗p < 0.001. n.s. not significant. Brain slice schematic in (B) was created using Biorender.com.
FIGURE 4
FIGURE 4
The effect of ceftriaxone on regional differences in glutamate clearance. (A) Mean (± S.E.M) iGluSnFR decay tau values to compare regional differences in glutamate clearance in saline-treated mice. (B) Mean (± S.E.M) iGluSnFR decay tau values to compare regional differences in glutamate clearance in ceftriaxone-treated mice. ***p < 0.001.
FIGURE 5
FIGURE 5
The effect of LDN on glutamate dynamics in the hippocampus. (A) GLT-1 expression in hippocampal tissue from vehicle (Veh)- and LDN-treated mice. (B) Representative images depicting the iGluSnFR response evoked by 2 (left), 20 (middle), and 50 (right) pulses of electrical stimulation at 100 Hz in Veh- (top) and LDN-treated (bottom) mice. X–Y images (2048 × 2048 μm) depict the maximal projection image of the iGluSnFR response, while the X–Z image (2048 μm vertically x 1945 ms horizontally) depicts the iGluSnFR response over time (z-axis). Gray shading indicates the onset and duration of electrical stimulation at 100 Hz. (C–E) Mean (± S.E.M in gray) iGluSnFR responses to 2 (C), 20 (D), and 50 (E) pulses at 100 Hz in Veh- and LDN-treated mice. Electrical stimulation is denoted by the arrowhead in (C) and the horizontal lines in (D) and (E). (F) Mean (± S.E.M) iGluSnFR response peaks. (G) Mean (± S.E.M) iGluSnFR decay tau values. (H) Linear regression to assess the magnitude of the activity-dependent increase in iGluSnFR decay tau. (I) Mean (± S.E.M) iGluSnFR area under the curve (AUC). (J) Mean (± S.E.M) of the iGluSnFR response size (%ΔF/F) at the termination of the 50-pulse stimulation paradigm (50 pulses at 100 Hz). (K) Mean (± S.E.M) of the time required for the iGluSnFR response to reach a peak during the 50-pulse stimulation paradigm. p < 0.05, ∗∗∗p < 0.001. n.s. not significant. Brain slice schematic in (B) was created using Biorender.com.
FIGURE 6
FIGURE 6
The effect of LDN on glutamate dynamics in the cortex. (A) GLT-1 expression in cortical tissue from vehicle (Veh)- and LDN-treated mice. (B) Representative images depicting the iGluSnFR response evoked by 2 (left), 20 (middle), and 50 (right) pulses of electrical stimulation at 100 Hz in Veh- (top) and LDN-treated (bottom) mice. X–Y images (2048 × 2048 μm) depict the maximal projection image of the iGluSnFR response while the X–Z image (2048 μm vertically x 1945 ms horizontally) depicts the iGluSnFR response over time (z-axis). Gray shading indicates the onset and duration of electrical stimulation at 100 Hz. (C–E) Mean (± S.E.M in gray) iGluSnFR responses to 2 (C), 20 (D), and 50 (E) pulses at 100 Hz in Veh- and LDN-treated mice. Electrical stimulation is denoted by the arrowhead in (C) and the horizontal lines in (D) and (E). (F) Mean (± S.E.M) iGluSnFR response peaks. (G) Mean (± S.E.M) iGluSnFR decay tau values. (H) Linear regression to assess the magnitude of the activity-dependent increase in iGluSnFR decay tau. (I) Mean (± S.E.M) iGluSnFR area under the curve (AUC). (J) Mean (± S.E.M) of the iGluSnFR response size (%ΔF/F) at the termination of the 50-pulse stimulation paradigm (50 pulses at 100 Hz). (K) Mean (± S.E.M) of the time required for the iGluSnFR response to reach a peak during the 50-pulse stimulation paradigm. p < 0.05, ∗∗∗p < 0.001. n.s. not significant. Brain slice schematic in (B) was created using Biorender.com.
FIGURE 7
FIGURE 7
The effect of LDN on glutamate dynamics in the striatum. (A) GLT-1 expression in striatal tissue from vehicle (Veh)- and LDN-treated mice. (B) Representative images depicting the iGluSnFR response evoked by 2 (left), 20 (middle), and 50 (right) pulses of electrical stimulation at 100 Hz in Veh- (top) and LDN-treated (bottom) mice. X–Y images (2048 × 2048 μm) depict the maximal projection image of the iGluSnFR response, while the X–Z image (2048 μm vertically x 1945 ms horizontally) depicts the iGluSnFR response over time (z-axis). Gray shading indicates the onset and duration of electrical stimulation at 100 Hz. (C–E) Mean (± S.E.M in gray) iGluSnFR responses to 2 (C), 20 (D), and 50 (E) pulses at 100 Hz in Veh- and LDN-treated mice. Electrical stimulation is denoted by the arrowhead in (C) and the horizontal lines in (D) and (E). (F) Mean (± S.E.M) iGluSnFR response peaks. (G) Mean (± S.E.M) iGluSnFR decay tau values. (H) Linear regression to assess the magnitude of the activity-dependent increase in iGluSnFR decay tau. (I) Mean (± S.E.M) iGluSnFR area under the curve (AUC). (J) Mean (± S.E.M) of the iGluSnFR response size (%ΔF/F) at the termination of the 50-pulse stimulation paradigm (50 pulses at 100 Hz). (K) Mean (± S.E.M) of the time required for the iGluSnFR response to reach a peak during the 50-pulse stimulation paradigm. p < 0.05, ∗∗∗p < 0.001. n.s. not significant. Brain slice schematic in (B) was created using Biorender.com.
FIGURE 8
FIGURE 8
The effect of LDN on regional differences in glutamate clearance. (A) Mean (± S.E.M) iGluSnFR decay tau values to compare regional differences in glutamate clearance in vehicle-treated mice. (B) Mean (± S.E.M) iGluSnFR decay tau values to compare regional differences in glutamate clearance in LDN-treated mice. ***p < 0.001.

Similar articles

Cited by

References

    1. Agostini J. F., Costa N. L. F., Bernardo H. T., Baldin S. L., Mendes N. V., de Pieri Pickler K., et al. (2020). Ceftriaxone attenuated anxiety-like behavior and enhanced brain glutamate transport in zebrafish subjected to alcohol withdrawal. Neurochem. Res. 45 1526–1535. 10.1007/s11064-020-03008-z - DOI - PubMed
    1. Armbruster M., Hanson E., Dulla C. G. (2016). Glutamate clearance is locally modulated by presynaptic neuronal activity in the cerebral cortex. J. Neurosci. 36 10404–10415. 10.1523/JNEUROSCI.2066-16.2016 - DOI - PMC - PubMed
    1. Baker D. A., Xi Z. X., Shen H., Swanson C. J., Kalivas P. W. (2002). The origin and neuronal function of in vivo nonsynaptic glutamate. J. Neurosci. 22 9134–9141. 10.1523/jneurosci.22-20-09134.2002 - DOI - PMC - PubMed
    1. Barnes J. R., Mukherjee B., Rogers B. C., Nafar F., Gosse M., Parsons M. P. (2020). The relationship between glutamate dynamics and activity-dependent synaptic plasticity. J. Neurosci. 40 2793–2807. 10.1523/JNEUROSCI.1655-19.2020 - DOI - PMC - PubMed
    1. Baskys A., Malenka R. C. (1991). Agonists at metabotropic glutamate receptors presynaptically inhibit EPSCs in neonatal rat hippocampus. J. Physiol. 444 687–701. 10.1113/jphysiol.1991.sp018901 - DOI - PMC - PubMed

LinkOut - more resources