

Effects of Nrf-2 expression in trophoblast cells and vascular endothelial cells in preeclampsia
- PMID: 33841636
- PMCID: PMC8014400
Effects of Nrf-2 expression in trophoblast cells and vascular endothelial cells in preeclampsia
Abstract
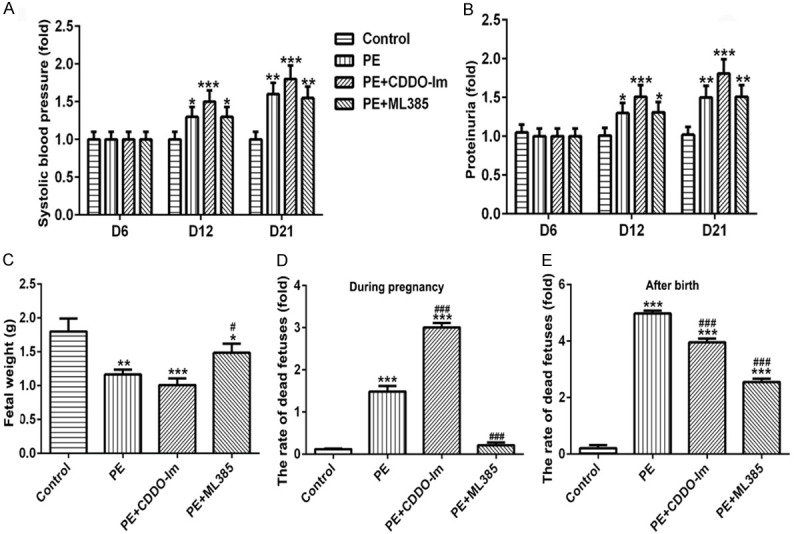
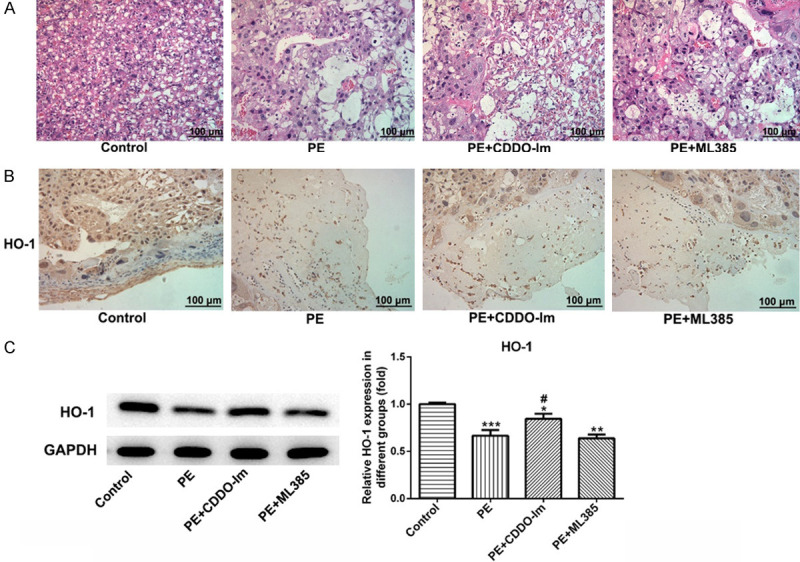
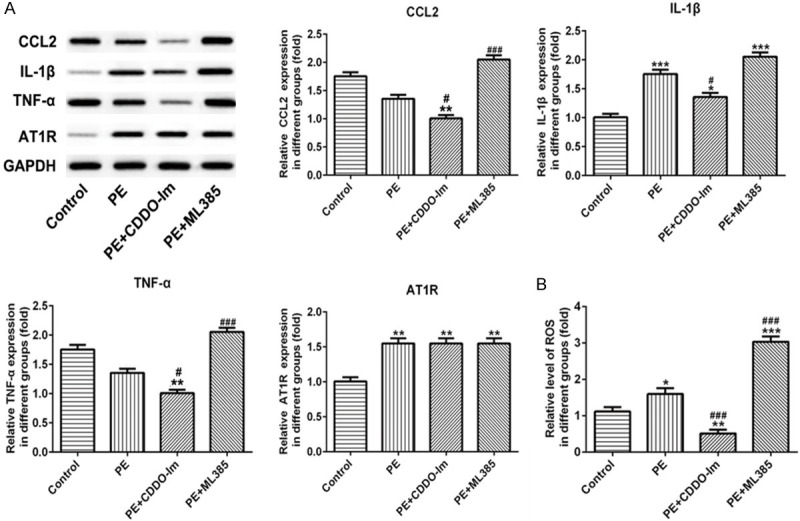
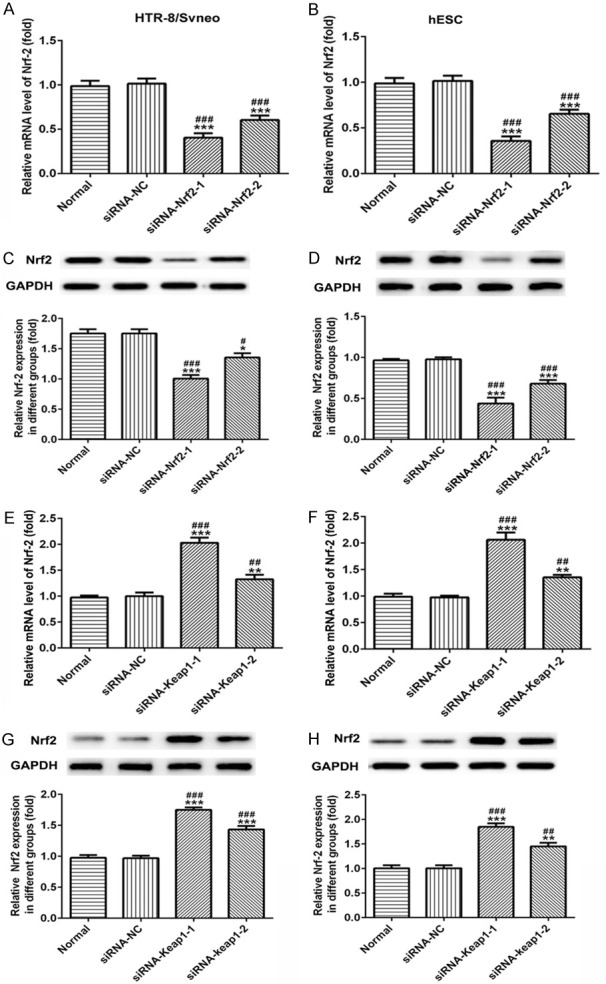
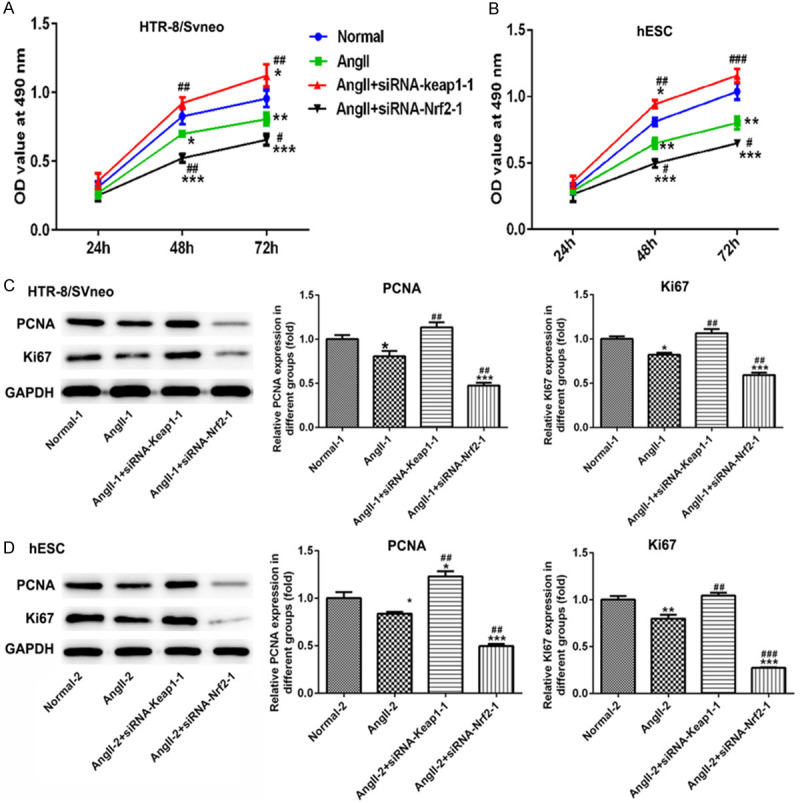
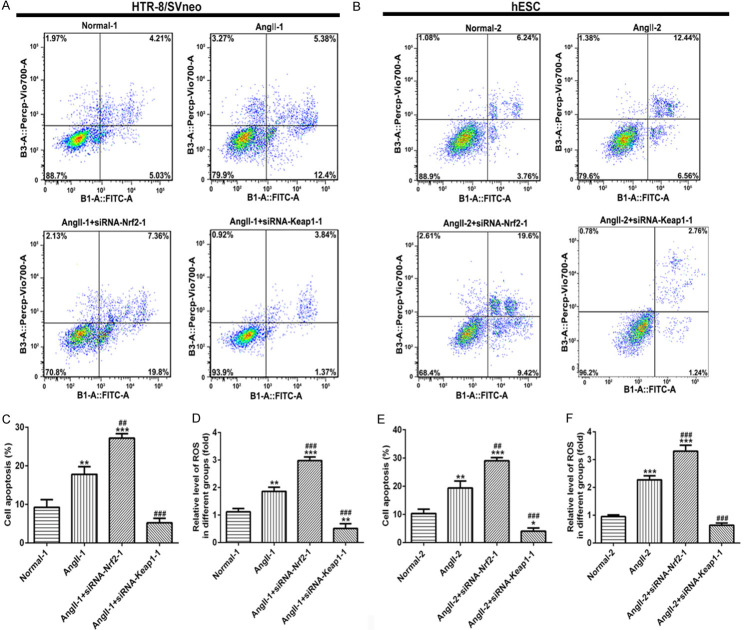
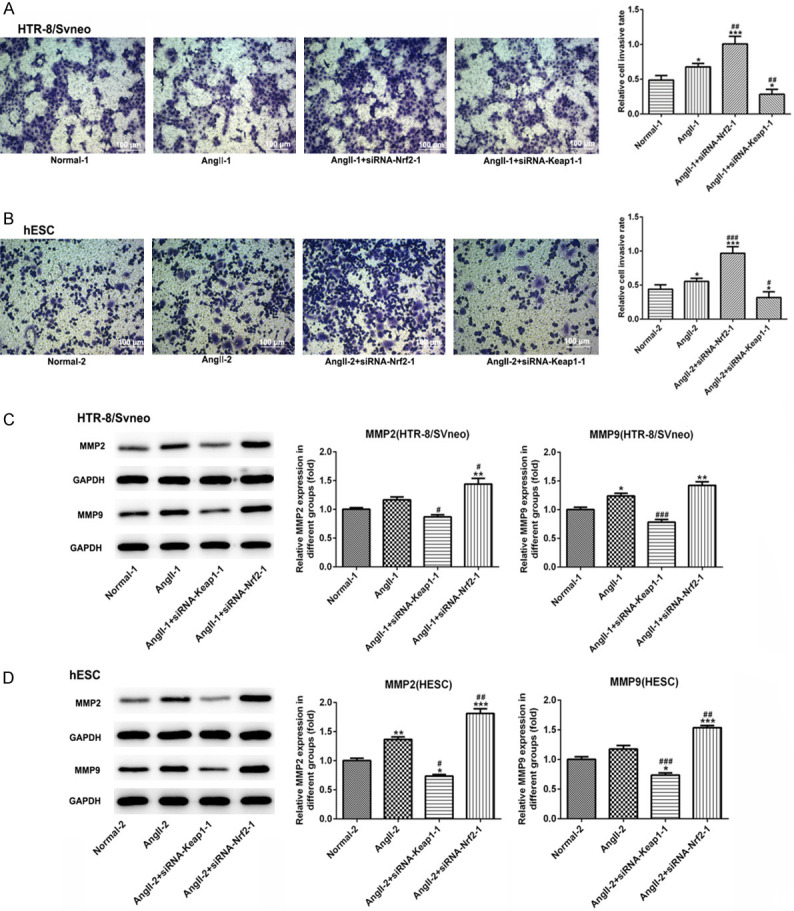
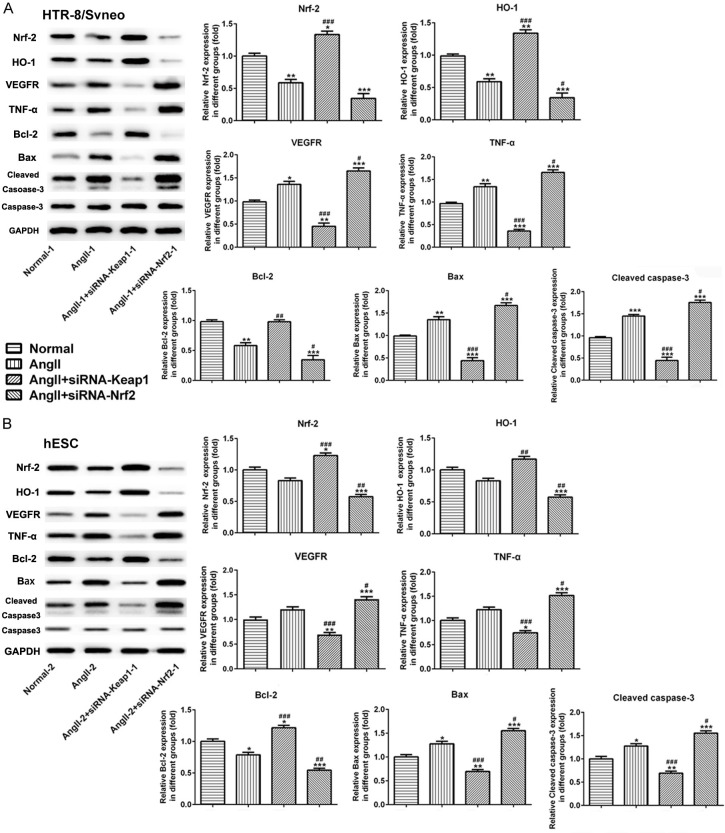
The present study aimed to explore the role of kelch-like ECH-associated protein-1 (Keap1)/Nuclear factor erythroid 2-related factor 2 (Nrf-2) signaling pathway in regulating heme oxygenase-1 (HO-1) expression in adverse outcomes of preeclampsia (PE). Adult Wistar rats, HTR-8/SVneo and hESC cells were used for models in vitro and in vivo, respectively. Inhibition of Nrf-2 could slightly reduce the elevation of systolic blood pressure (SBP) and urinary protein in PE rats. The percentages of dead fetuses during pregnancy and within seven days of birth were decreased by Nrf-2 inhibitor. There was no significant effect on the pathology and HO-1 expression of Nrf-2 in placental tissue. Deficiency of Nrf-2 increased significantly the levels of chemokine 2 (CCL2), interleukin-1β (IL-1β), tumor necrosis factor-alpha (TNF-α), angiotensin II receptor type 1 (AT1R) and reactive oxygen species (ROS) in the embryonic tissues. Knockdown of Nrf-2 suppressed cell proliferation, improved cell apoptosis and invasion with an increase of ROS and HO-1, but the effect on cells apoptosis was greater. Activation of Nrf-2 pathway could reduce oxidative stress in PE rats and trophoblast cells induced by Ang II, and enhance the adverse outcome of PE via increasing HO-1. Nrf-2 silence reshaped blood vessels and achieved the effect of treating PE. Our results might provide theoretical guidance for the application of Nrf-2 in the treatment of PE.
Keywords: Preeclampsia; apoptosis; heme oxygenase-1; nuclear factor erythroid 2-related factor 2; oxidative stress.
AJTR Copyright © 2021.
Conflict of interest statement
None.
Figures
Similar articles
-
AOPPs induce HTR-8/SVneo cell apoptosis by downregulating the Nrf-2/ARE/HO-1 anti-oxidative pathway: Potential implications for preeclampsia.Placenta. 2021 Sep 1;112:1-8. doi: 10.1016/j.placenta.2021.06.008. Epub 2021 Jun 17. Placenta. 2021. PMID: 34237527
-
Crocin exhibits an antihypertensive effect in a rat model of gestational hypertension and activates the Nrf-2/HO-1 signaling pathway.Hypertens Res. 2021 Jun;44(6):642-650. doi: 10.1038/s41440-020-00609-7. Epub 2021 Jan 13. Hypertens Res. 2021. PMID: 33442028
-
Sofalcone upregulates the nuclear factor (erythroid-derived 2)-like 2/heme oxygenase-1 pathway, reduces soluble fms-like tyrosine kinase-1, and quenches endothelial dysfunction: potential therapeutic for preeclampsia.Hypertension. 2015 Apr;65(4):855-62. doi: 10.1161/HYPERTENSIONAHA.114.04781. Epub 2015 Feb 9. Hypertension. 2015. PMID: 25667213
-
Inhibition of PDE4 protects neurons against oxygen-glucose deprivation-induced endoplasmic reticulum stress through activation of the Nrf-2/HO-1 pathway.Redox Biol. 2020 Jan;28:101342. doi: 10.1016/j.redox.2019.101342. Epub 2019 Oct 13. Redox Biol. 2020. PMID: 31639651 Free PMC article.
-
Supraphysiological Role of Melatonin Over Vascular Dysfunction of Pregnancy, a New Therapeutic Agent?Front Physiol. 2021 Nov 16;12:767684. doi: 10.3389/fphys.2021.767684. eCollection 2021. Front Physiol. 2021. PMID: 34867473 Free PMC article. Review.
Cited by
-
Physiological and pathological roles of Ang II and Ang- (1-7) in the female reproductive system.Front Endocrinol (Lausanne). 2022 Dec 23;13:1080285. doi: 10.3389/fendo.2022.1080285. eCollection 2022. Front Endocrinol (Lausanne). 2022. PMID: 36619582 Free PMC article. Review.
-
Nrf2 Promotes Inflammation in Early Myocardial Ischemia-Reperfusion via Recruitment and Activation of Macrophages.Front Immunol. 2021 Nov 30;12:763760. doi: 10.3389/fimmu.2021.763760. eCollection 2021. Front Immunol. 2021. PMID: 34917083 Free PMC article.
-
Divergent Regulation of Decidual Oxidative-Stress Response by NRF2 and KEAP1 in Preeclampsia with and without Fetal Growth Restriction.Int J Mol Sci. 2022 Feb 10;23(4):1966. doi: 10.3390/ijms23041966. Int J Mol Sci. 2022. PMID: 35216082 Free PMC article.
-
CCL2: An important cytokine in normal and pathological pregnancies: A review.Front Immunol. 2023 Jan 6;13:1053457. doi: 10.3389/fimmu.2022.1053457. eCollection 2022. Front Immunol. 2023. PMID: 36685497 Free PMC article. Review.
-
Modulation of NRF2/KEAP1 Signaling in Preeclampsia.Cells. 2023 Jun 4;12(11):1545. doi: 10.3390/cells12111545. Cells. 2023. PMID: 37296665 Free PMC article. Review.
References
-
- Wu P, Haththotuwa R, Kwok CS, Babu A, Kotronias RA, Rushton C, Zaman A, Fryer AA, Kadam U, Chew-Graham CA, Mamas MA. Preeclampsia and future cardiovascular health: a systematic review and meta-analysis. Circ Cardiovasc Qual Outcomes. 2017;10:e003497. - PubMed
-
- Redman CW, Sargent IL. Placental stress and pre-eclampsia: a revised view. Placenta. 2009;30(Suppl A):S38–42. - PubMed
-
- Rao H, Bai Y, Zhang F, Li Q, Zhuang B, Luo X, Qi H. The role of SATB1 in HTR8/SVneo cells and pathological mechanism of preeclampsia. J Matern Fetal Neonatal Med. 2019;32:2069–2078. - PubMed
LinkOut - more resources
Full Text Sources
Research Materials
Miscellaneous