Stiffness of aortic arch and carotid arteries increases in ApoE-knockout mice with high-fat diet: evidence from echocardiography
- PMID: 33841661
- PMCID: PMC8014403
Stiffness of aortic arch and carotid arteries increases in ApoE-knockout mice with high-fat diet: evidence from echocardiography
Abstract
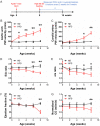
Arterial stiffness is an effective predictor of atherosclerosis. Measurement of pulse-wave velocity (PWV) is a gold-standard approach to study arterial stiffness. This study aims to examine arterial stiffness and heart functions via echocardiography at an early stage of atherosclerosis. A model of atherosclerosis in ApoE-knockout (ApoE-/- ) mice fed on high-fat diet (HFD) was used, with normal chow diet (ND) as a control. Stiffness of aortic arch and carotid arteries and left ventricular (LV) systolic/diastolic functions were measured by echocardiography. The plasma cholesterol levels and atherosclerotic plaque areas in the aortas were measured. The PWV values of aortic arch and carotid arteries were compared at 2, 4, 6 and 8 weeks with different diets. Compared with ND mice, PWV values in aortic arch and carotid arteries were significantly increased in HFD mice after 8 weeks (Aortic arch: 516.65 ± 216.89 cm/s vs. 192.53 ± 71.71 cm/s; Carotid arteries: 514.26 ± 211.01 cm/s vs. 188.03 ± 75.14 cm/s, respectively; both P < 0.01) accompanied by the decrease in LV systolic/diastolic functions. These were well correlated with the increase in plasma cholesterol levels. Echo-based PWV measurement in the aortic arch was found more sensitive to predict atherosclerosis than in the carotid arteries in ApoE-/- mice. Measuring aortic arch PWV via echocardiography could represent a new diagnostic strategy for early detection of atherosclerosis.
Keywords: Arterial stiffness; atherosclerosis; echocardiography; pulse wave velocity.
AJTR Copyright © 2021.
Conflict of interest statement
None.
Figures


Similar articles
-
Anatomic correlates of aortic pulse wave velocity and carotid artery elasticity during atherosclerosis progression and regression in monkeys.Circulation. 1991 May;83(5):1754-63. doi: 10.1161/01.cir.83.5.1754. Circulation. 1991. PMID: 2022028
-
Echo-Doppler assessment of arterial stiffness in pediatric patients with Kawasaki disease.J Am Soc Echocardiogr. 2013 Sep;26(9):1084-9. doi: 10.1016/j.echo.2013.05.015. Epub 2013 Jun 22. J Am Soc Echocardiogr. 2013. PMID: 23800509
-
Local versus global aortic pulse wave velocity in early atherosclerosis: An animal study in ApoE-/--mice using ultrahigh field MRI.PLoS One. 2017 Feb 16;12(2):e0171603. doi: 10.1371/journal.pone.0171603. eCollection 2017. PLoS One. 2017. PMID: 28207773 Free PMC article.
-
Clinical measurement of arterial stiffness obtained from noninvasive pressure waveforms.Am J Hypertens. 2005 Jan;18(1 Pt 2):3S-10S. doi: 10.1016/j.amjhyper.2004.10.009. Am J Hypertens. 2005. PMID: 15683725 Review.
-
Role of arterial stiffness in cardiovascular disease.JRSM Cardiovasc Dis. 2012 Jul 31;1(4):cvd.2012.012016. doi: 10.1258/cvd.2012.012016. JRSM Cardiovasc Dis. 2012. PMID: 24175067 Free PMC article. Review.
Cited by
-
AFM-based nanoindentation indicates an impaired cortical stiffness in the AAV-PCSK9DY atherosclerosis mouse model.Pflugers Arch. 2022 Sep;474(9):993-1002. doi: 10.1007/s00424-022-02710-x. Epub 2022 Jun 1. Pflugers Arch. 2022. PMID: 35648220 Free PMC article.
-
C/EBPβ activation in vascular smooth muscle cells promotes hyperlipidemia-induced phenotypic transition and arterial stiffness.Signal Transduct Target Ther. 2025 Apr 2;10(1):105. doi: 10.1038/s41392-025-02196-w. Signal Transduct Target Ther. 2025. PMID: 40169541 Free PMC article.
-
LARP7 overexpression alleviates aortic senescence and atherosclerosis.J Cell Mol Med. 2024 Jun;28(11):e18388. doi: 10.1111/jcmm.18388. J Cell Mol Med. 2024. PMID: 38818612 Free PMC article.
-
Endothelial Stiffening Induced by CD36-Mediated Lipid Uptake Leads to Endothelial Barrier Disruption and Contributes to Atherosclerotic Lesions.Arterioscler Thromb Vasc Biol. 2025 Jun;45(6):e201-e216. doi: 10.1161/ATVBAHA.124.322244. Epub 2025 Apr 10. Arterioscler Thromb Vasc Biol. 2025. PMID: 40207364
-
The role of macrophage ion channels in the progression of atherosclerosis.Front Immunol. 2023 Jul 31;14:1225178. doi: 10.3389/fimmu.2023.1225178. eCollection 2023. Front Immunol. 2023. PMID: 37588590 Free PMC article. Review.
References
-
- Spence JD, Pilote L. Importance of sex and gender in atherosclerosis and cardiovascular disease. Atherosclerosis. 2015;241:208–210. - PubMed
-
- Virani SS, Alonso A, Benjamin EJ, Bittencourt MS, Callaway CW, Carson AP, Chamberlain AM, Chang AR, Cheng S, Delling FN, Djousse L, Elkind MSV, Ferguson JF, Fornage M, Khan SS, Kissela BM, Knutson KL, Kwan TW, Lackland DT, Lewis TT, Lichtman JH, Longenecker CT, Loop MS, Lutsey PL, Martin SS, Matsushita K, Moran AE, Mussolino ME, Perak AM, Rosamond WD, Roth GA, Sampson UKA, Satou GM, Schroeder EB, Shah SH, Shay CM, Spartano NL, Stokes A, Tirschwell DL, VanWagner LB, Tsao CW American Heart Association Council on Epidemiology and Prevention Statistics Committee and Stroke Statistics Subcommittee. Heart disease and stroke statistics-2020 update: a report from the american heart association. Circulation. 2020;141:e139–e596. - PubMed
-
- Benjamin EJ, Muntner P, Alonso A, Bittencourt MS, Callaway CW, Carson AP, Chamberlain AM, Chang AR, Cheng S, Das SR, Delling FN, Djousse L, Elkind MSV, Ferguson JF, Fornage M, Jordan LC, Khan SS, Kissela BM, Knutson KL, Kwan TW, Lackland DT, Lewis TT, Lichtman JH, Longenecker CT, Loop MS, Lutsey PL, Martin SS, Matsushita K, Moran AE, Mussolino ME, O’Flaherty M, Pandey A, Perak AM, Rosamond WD, Roth GA, Sampson UKA, Satou GM, Schroeder EB, Shah SH, Spartano NL, Stokes A, Tirschwell DL, Tsao CW, Turakhia MP, VanWagner LB, Wilkins JT, Wong SS, Virani SS American Heart Association Council on Epidemiology and Prevention Statistics Committee and Stroke Statistics Subcommittee. Heart disease and stroke statistics-2019 update: a report from the American Heart Association. Circulation. 2019;139:e56–e528. - PubMed
Grants and funding
LinkOut - more resources
Full Text Sources
Miscellaneous
