

Integrating omics to characterize eco-physiological adaptations: How moose diet and metabolism differ across biogeographic zones
- PMID: 33841775
- PMCID: PMC8019042
- DOI: 10.1002/ece3.7265
Integrating omics to characterize eco-physiological adaptations: How moose diet and metabolism differ across biogeographic zones
Abstract
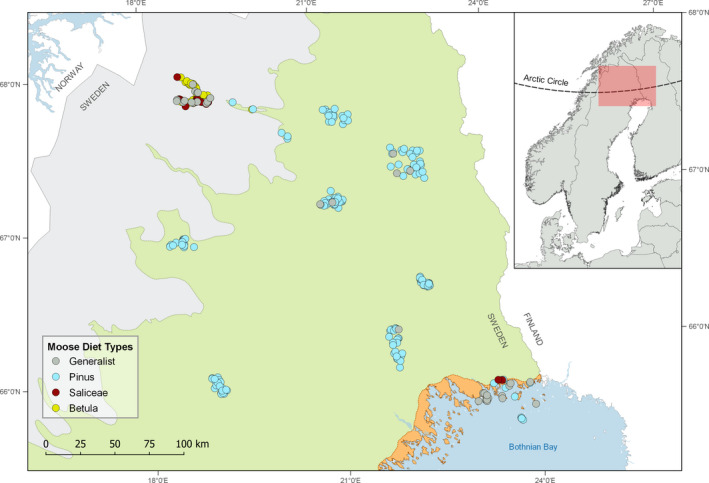
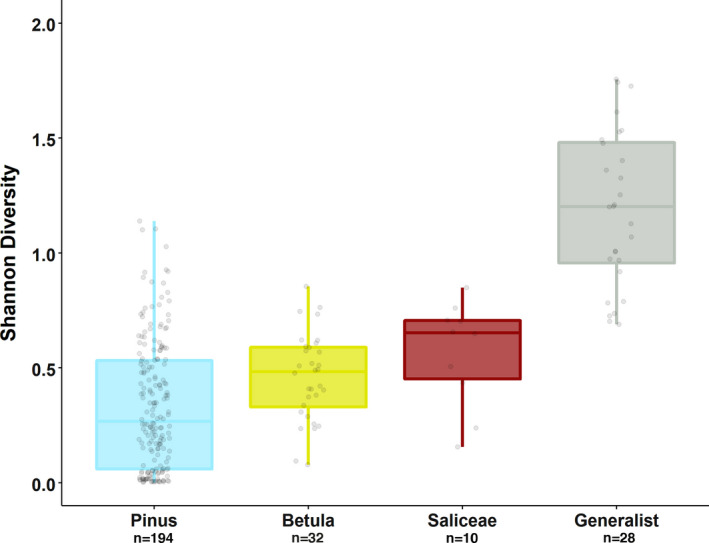
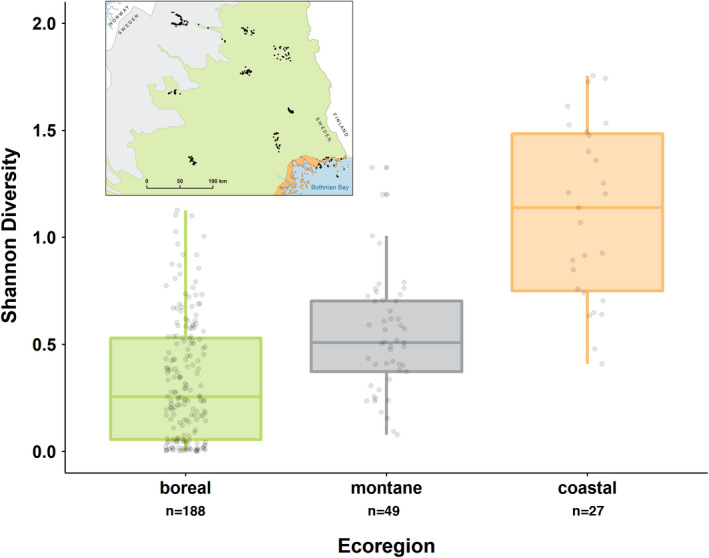
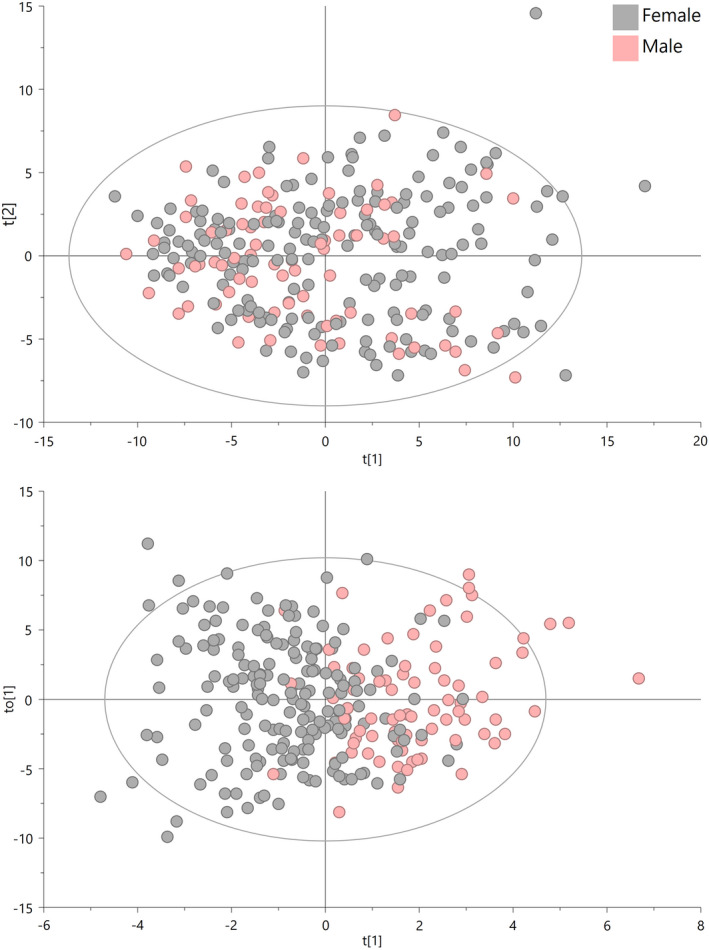
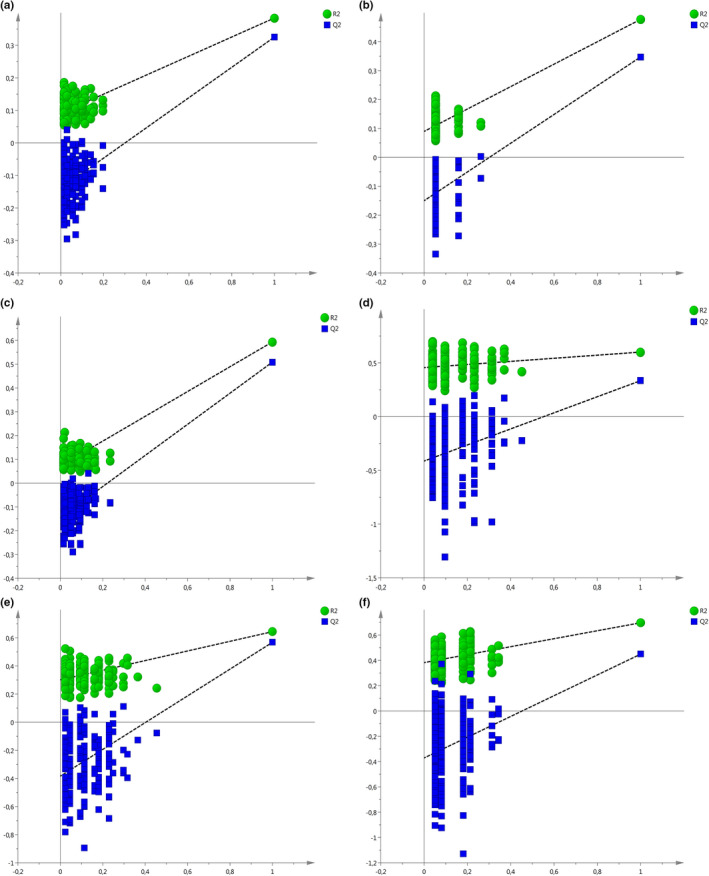
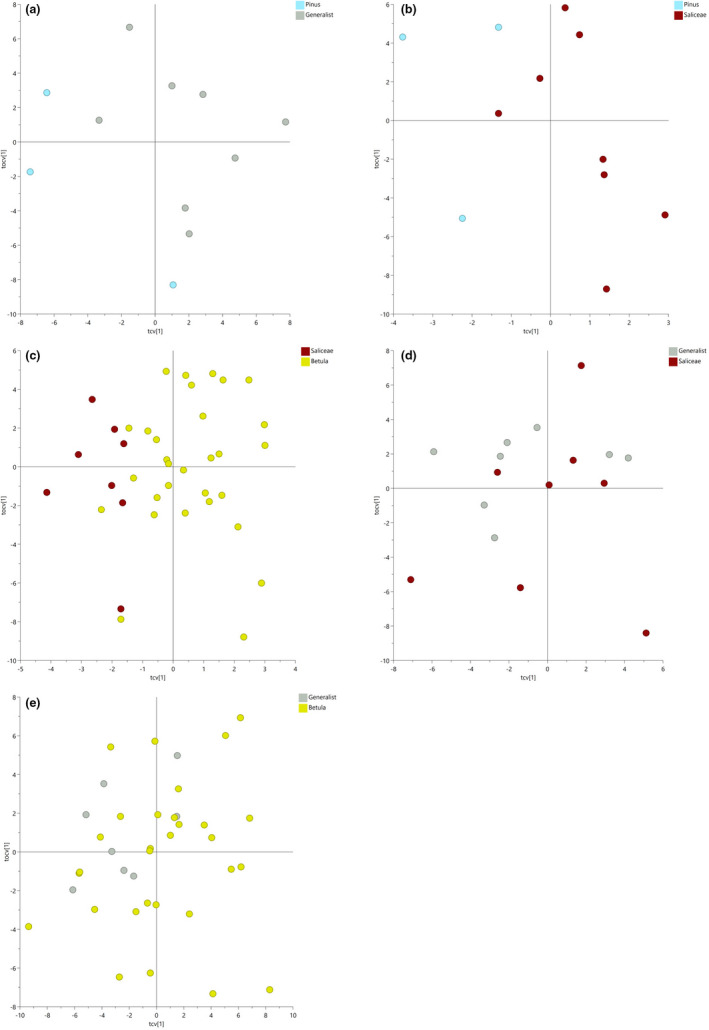
With accelerated land conversion and global heating at northern latitudes, it becomes crucial to understand, how life histories of animals in extreme environments adapt to these changes. Animals may either adapt by adjusting foraging behavior or through physiological responses, including adjusting their energy metabolism or both. Until now, it has been difficult to study such adaptations in free-ranging animals due to methodological constraints that prevent extensive spatiotemporal coverage of ecological and physiological data.Through a novel approach of combining DNA-metabarcoding and nuclear magnetic resonance (NMR)-based metabolomics, we aim to elucidate the links between diets and metabolism in Scandinavian moose Alces alces over three biogeographic zones using a unique dataset of 265 marked individuals.Based on 17 diet items, we identified four different classes of diet types that match browse species availability in respective ecoregions in northern Sweden. Individuals in the boreal zone consumed predominantly pine and had the least diverse diets, while individuals with highest diet diversity occurred in the coastal areas. Males exhibited lower average diet diversity than females.We identified several molecular markers indicating metabolic constraints linked to diet constraints in terms of food availability during winter. While animals consuming pine had higher lipid, phospocholine, and glycerophosphocholine concentrations in their serum than other diet types, birch- and willow/aspen-rich diets exhibit elevated concentrations of several amino acids. The individuals with highest diet diversity had increased levels of ketone bodies, indicating extensive periods of starvation for these individuals.Our results show how the adaptive capacity of moose at the eco-physiological level varies over a large eco-geographic scale and how it responds to land use pressures. In light of extensive ongoing climate and land use changes, these findings pave the way for future scenario building for animal adaptive capacity.
Keywords: DNA‐metabarcoding; biomarker; energy metabolism; metabolomics; nutritional ecology; starvation; ungulate.
© 2021 The Authors. Ecology and Evolution published by John Wiley & Sons Ltd.
Conflict of interest statement
None declared.
Figures


Similar articles
-
Camera collars reveal macronutrient balancing in free-ranging male moose during summer.Ecol Evol. 2024 Aug 16;14(8):e70192. doi: 10.1002/ece3.70192. eCollection 2024 Aug. Ecol Evol. 2024. PMID: 39157671 Free PMC article.
-
Short-term digestible energy intake in captive moose (Alces alces) on different diets.Zoo Biol. 2013 Sep-Oct;32(5):484-9. doi: 10.1002/zoo.21080. Epub 2013 Jun 25. Zoo Biol. 2013. PMID: 23801273
-
Forage quantity, quality and depletion as scale-dependent mechanisms driving habitat selection of a large browsing herbivore.J Anim Ecol. 2010 Jul;79(4):910-22. doi: 10.1111/j.1365-2656.2010.01701.x. Epub 2010 Apr 27. J Anim Ecol. 2010. PMID: 20443990
-
The Nutritional Balancing Act of a Large Herbivore: An Experiment with Captive Moose (Alces alces L).PLoS One. 2016 Mar 17;11(3):e0150870. doi: 10.1371/journal.pone.0150870. eCollection 2016. PLoS One. 2016. PMID: 26986618 Free PMC article.
-
A review of the "mysterious" wasting disease in Swedish moose (Alces alces L.) related to molybdenosis and disturbances in copper metabolism.Biol Trace Elem Res. 2004 Winter;102(1-3):143-59. doi: 10.1385/BTER:102:1-3:143. Biol Trace Elem Res. 2004. PMID: 15621935 Review.
References
-
- Allen, A. M. , Månsson, J. , Sand, H. , Malmsten, J. , Ericsson, G. , & Singh, N. J. (2016). Scaling up movements: From individual space use to population patterns. Ecosphere, 7(10), e01524. 10.1002/ecs2.1524 - DOI
-
- Beckonert, O. , Keun, H. , Ebbels, T. , Bundy, J. , Holmes, E. , Lindon, J. C. , & Nicholson, J. K. (2007). Metabolic profiling, metabolomic and metabonomic procedures for NMR spectroscopy of urine, plasma, serum and tissue extracts. Nature Protocols, 2, 2692–2703. 10.1038/nprot.2007.376 - DOI - PubMed
-
- Berglöv, G. , Asp, M. , Berggreen‐Clausen, S. , Björck, E. , Mårtensson, J. A. , Nylén, L. , Sjökvist, E. (2015). Framtidsklimat i Norrbottens län − enligt RCP‐scenarier. Report 32. Swedish Meteorological and Hydrological Institute.
-
- Bergqvist, G. , Wallgren, M. , Jernelid, H. , & Bergström, R. (2018). Forage availability and moose winter browsing in forest landscapes. Forest Ecology and Management, 419–420, 170–178. 10.1016/j.foreco.2018.03.049 - DOI
Associated data
LinkOut - more resources
Full Text Sources
Other Literature Sources
