. 2020 Oct 15:9:1248.
doi: 10.12688/f1000research.26872.2. eCollection 2020.

Fiji plugins for qualitative image annotations: routine analysis and application to image classification

Affiliations

Fiji plugins for qualitative image annotations: routine analysis and application to image classification

Laurent S V Thomas et al. F1000Res. .

Abstract

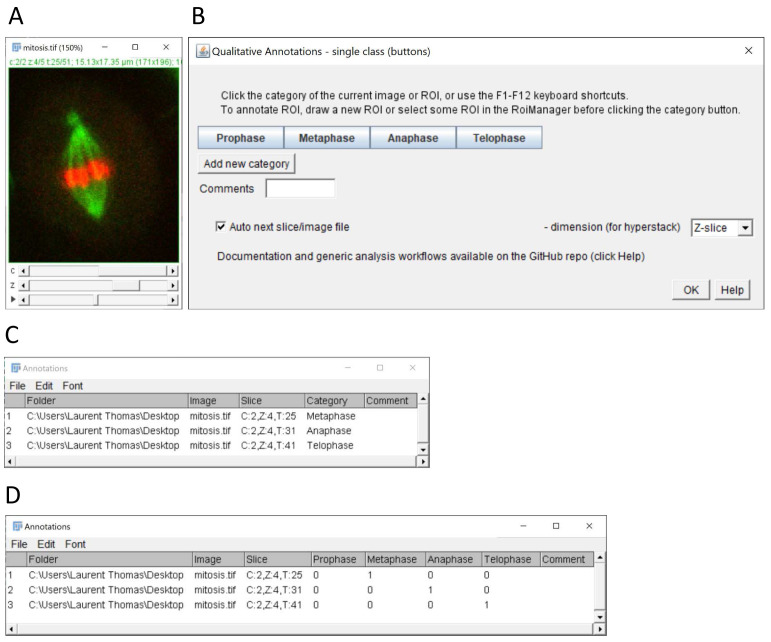
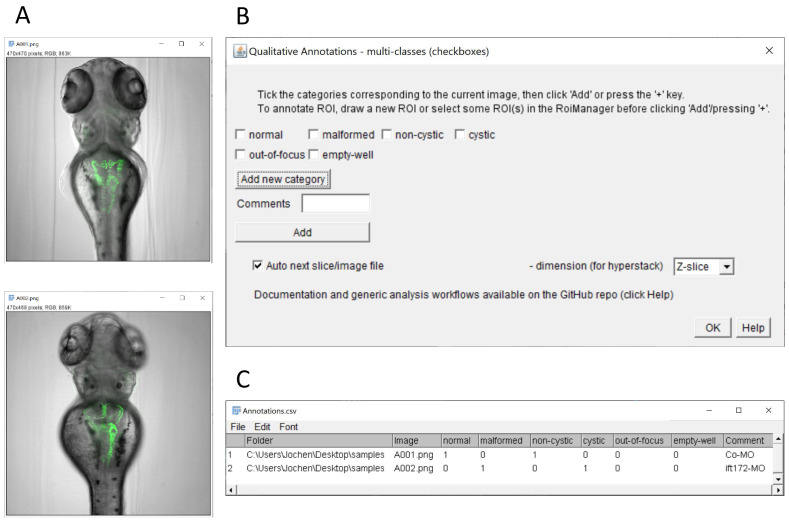
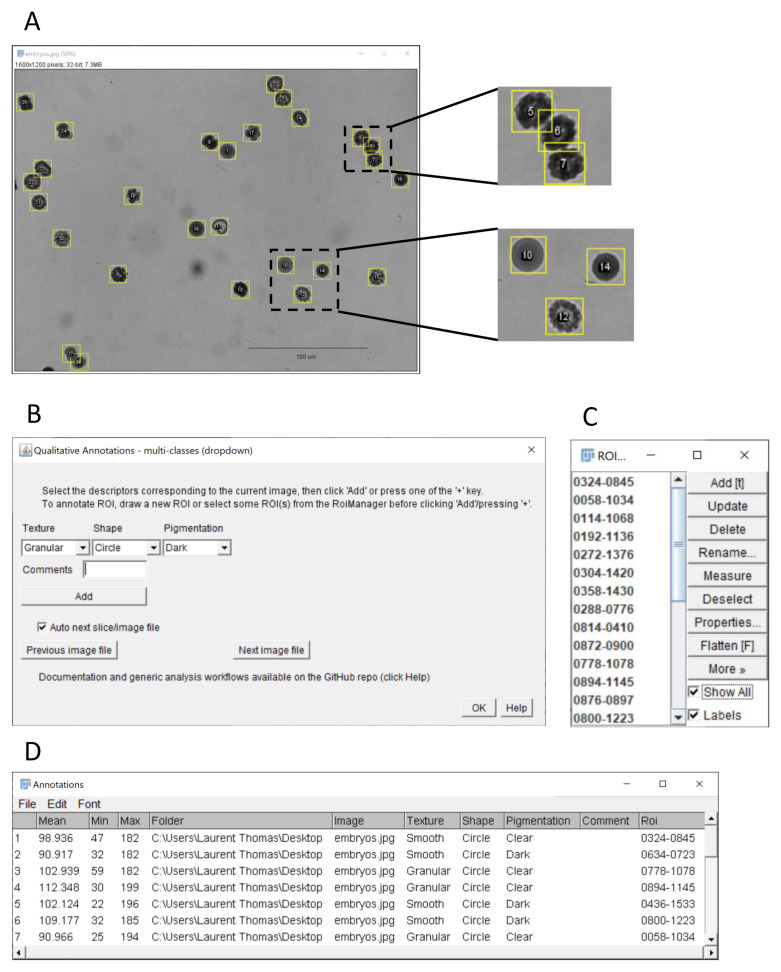
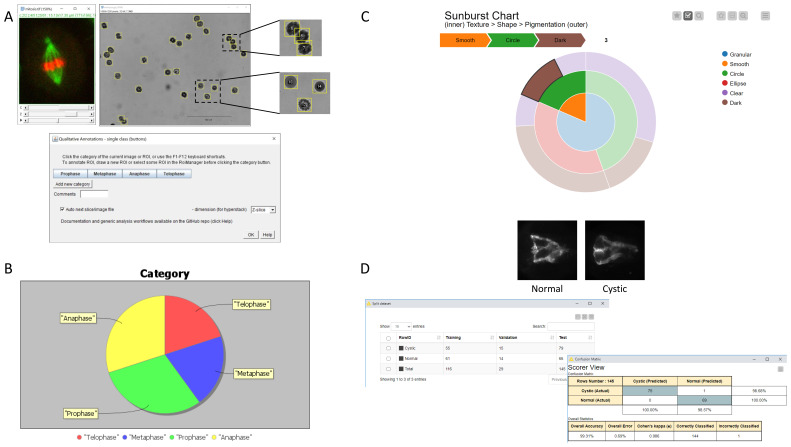
Quantitative measurements and qualitative description of scientific images are both important to describe the complexity of digital image data. While various software solutions for quantitative measurements in images exist, there is a lack of simple tools for the qualitative description of images in common user-oriented image analysis software. To address this issue, we developed a set of Fiji plugins that facilitate the systematic manual annotation of images or image-regions. From a list of user-defined keywords, these plugins generate an easy-to-use graphical interface with buttons or checkboxes for the assignment of single or multiple pre-defined categories to full images or individual regions of interest. In addition to qualitative annotations, any quantitative measurement from the standard Fiji options can also be automatically reported. Besides the interactive user interface, keyboard shortcuts are available to speed-up the annotation process for larger datasets. The annotations are reported in a Fiji result table that can be exported as a pre-formatted csv file, for further analysis with common spreadsheet software or custom automated pipelines. To illustrate possible use case of the annotations, and facilitate the analysis of the generated annotations, we provide examples of such pipelines, including data-visualization solutions in Fiji and KNIME, as well as a complete workflow for training and application of a deep learning model for image classification in KNIME. Ultimately, the plugins enable standardized routine sample evaluation, classification, or ground-truth category annotation of any digital image data compatible with Fiji.

Keywords: Fiji; ImageJ; KNIME; bioimage analysis; ground-truth labelling; image annotation; image classification; qualitative analysis.


Conflict of interest statement

Competing interests: Laurent Thomas and Jochen Gehrig are employees of ACQUIFER Imaging GmbH, Heidelberg, Germany

Figures

Figure 1.
Figure 1.. Single-category annotation of images in multi-dimensional stacks.
( A) Example of multi-dimensional image stack used to annotate mitotic stages in time-lapse data (source: ImageJ example image “Mitosis” – image credit NIH). ( B) Graphical interface of the single class (buttons) plugin configured for annotation of 4 mitotic stages. ( C) Results table with annotated categories (column category) generated by the plugin after selecting the single category column option in the plugin configuration window (not shown). ( D) Alternative results table output using 1-hot encoding after selecting the option 1 column per category. The resulting 1-hot encoding of categories can be used for the training of classification algorithms.
Figure 2.
Figure 2.. Annotation of multiple categories using the multi-class (checkboxes) plugin.
( A) Example images of transgenic zebrafish larvae of the Tg(wt1b:egfp) transgenic line after injection with control morpholino (upper panel) or with ift172 morpholino (lower panel) inducing pronephric cysts. In this illustration, the plugin is used to score overall morphology and cyst formation. It could also be used to mark erroneous images (such as out-of-focus or empty wells). Images are from ( Pandey et al., 2019). ( B) Graphical interface of the checkbox annotation plugin configured with 2 checkboxes for overall morphology, 2 checkboxes for presence of pronephric cysts, and checkboxes to report out-of-focus and empty wells. Contrary to the single class (button) plugin, multiple categories can be assigned to a given image. ( C) Resulting multi-category classification table with binary encoding of the annotations (True/False).
Figure 3.
Figure 3.. Qualitative and quantitative annotations of image regions using the multi-class (dropdown) plugin.
( A) ImageJ’s sample image “ embryos” after conversion to grayscale using the command Image > Type > 32-bit (image credit: NIH). The embryos outlined with yellow regions of interest were annotated using the “ multi-class (dropdown)” plugin. The insets at the top shows the annotation of overlapping ROIs, here corresponding to embryos with phenotype granular texture, dark pigmentation and elliptic shape. The inset at the bottom shows other embryos with different phenotypes (10: smooth/clear/circular, 12: granular/clear/elliptic, 14: smooth/dark/circular). ( B) Graphical interface of the multi-class (dropdown) plugin. Three exemplary features are scored for each embryo: texture (granular, smooth), shape (circle, ellipse) and pigmentation (dark, clear). Quantitative measurements as selected in the Analyze > set Measurements menu (here Mean, Min and Max grey level) are also reported for each embryo, when the run Measure option is ticked. ( C) ROI Manager with ROIs corresponding to annotated regions. ( D) Resulting classification table with the selected features, qualitative measurement and associated ROI identifier for the outlined embryos.
Figure 4.
Figure 4.. Overview of the annotation tools and possible use cases of the annotations.
( A) The qualitative annotation plugins provide simple graphical user interfaces for the annotations of images or image regions outlined by ROIs (see Figure 1– Figure 3). ( B) Pie chart visualization of the data-distribution from a single table column, here illustrated with the distribution of the mitotic stage in a population of cells (fictive distribution). The plot is generated in Fiji by the plugin “Pie chart from table column”, provided with the annotation plugins (see Supplementary Figure 2). ( C) Interactive sunburst chart visualization in KNIME, illustrated with the distribution of morphological phenotypes of multi-cellular embryos (as in Figure 3). Distinct data-columns are represented as successive levels of the chart (see Supplementary Figure 3). ( D) Training of a deep-learning model for image-classification in KNIME with representative images of the custom categories (kidney morphology in zebrafish larvae, left: normal, right: cystic), distribution of the annotated images between training, validation and test fraction, and result of the classification shown as a confusion matrix (see Supplementary Figure 4,5).

Similar articles

Cited by

References

    1. Bankhead P, Loughrey MB, Fernández JA, et al. : QuPath: Open source software for digital pathology image analysis. Sci Rep. 2017;7(1):16878. 10.1038/s41598-017-17204-5 - DOI - PMC - PubMed
    1. Berg S, Kutra D, Kroeger T, et al. : ilastik: interactive machine learning for (bio)image analysis. Nat Methods. 2019;16(12):1226–1232. 10.1038/s41592-019-0582-9 - DOI - PubMed
    1. Berthold MR, Cebron N, Dill F, et al. : KNIME - the Konstanz information miner: version 2.0 and beyond. ACM SIGKDD Explor Newsl. 2009;11(1):26–31. 10.1145/1656274.1656280 - DOI
    1. de Chaumont F, Dallongeville S, Chenouard N, et al. : Icy: an open bioimage informatics platform for extended reproducible research.Focus on bioimage informatics. Nat Methods. 2012;9(7):690–696. 10.1038/nmeth.2075 - DOI - PubMed
    1. Hollandi R, Diósdi A, Hollandi G, et al. : AnnotatorJ: an ImageJ plugin to ease hand annotation of cellular compartments.Ed. Lippincott-Schwartz, J. Mol Biol Cell. 2020;31(20):2179–2186. 10.1091/mbc.E20-02-0156 - DOI - PMC - PubMed

Publication types

LinkOut - more resources