. 2021 Apr 5;10(4):e1269.
doi: 10.1002/cti2.1269. eCollection 2021.

Preclinical development of a molecular clamp-stabilised subunit vaccine for severe acute respiratory syndrome coronavirus 2

Affiliations

Preclinical development of a molecular clamp-stabilised subunit vaccine for severe acute respiratory syndrome coronavirus 2

Daniel Watterson et al. Clin Transl Immunology. .

Abstract

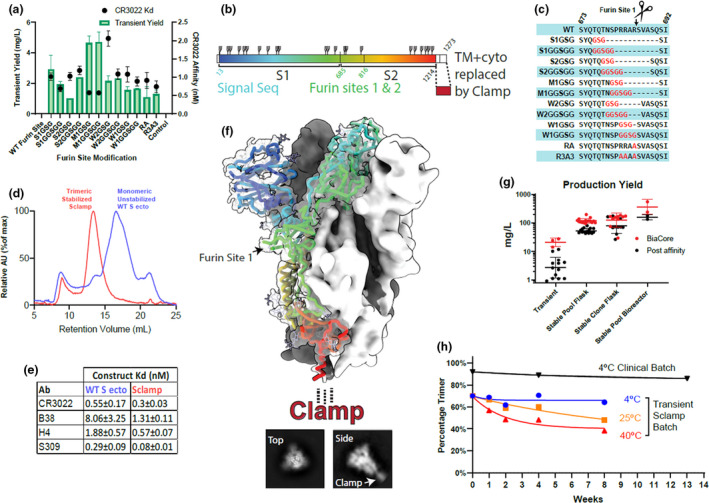
Objectives: Efforts to develop and deploy effective vaccines against severe acute respiratory syndrome coronavirus 2 (SARS-CoV-2) continue at pace. Here, we describe rational antigen design through to manufacturability and vaccine efficacy of a prefusion-stabilised spike (S) protein, Sclamp, in combination with the licensed adjuvant MF59 'MF59C.1' (Seqirus, Parkville, Australia).

Methods: A panel recombinant Sclamp proteins were produced in Chinese hamster ovary and screened in vitro to select a lead vaccine candidate. The structure of this antigen was determined by cryo-electron microscopy and assessed in mouse immunogenicity studies, hamster challenge studies and safety and toxicology studies in rat.

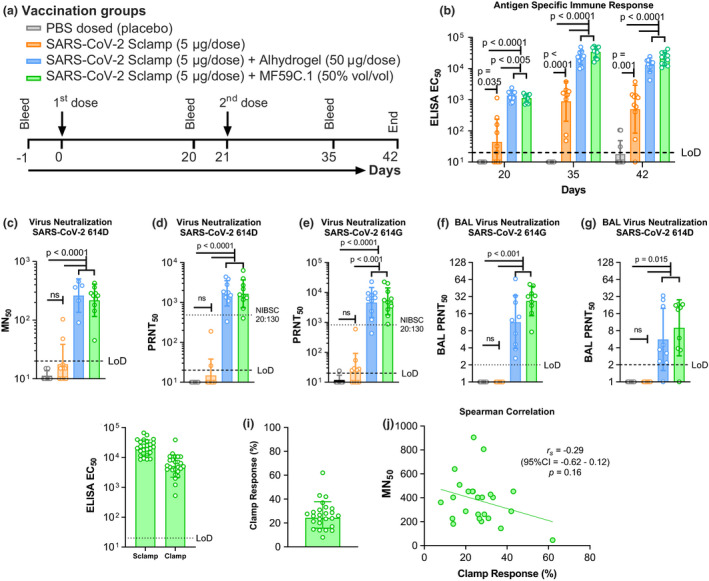
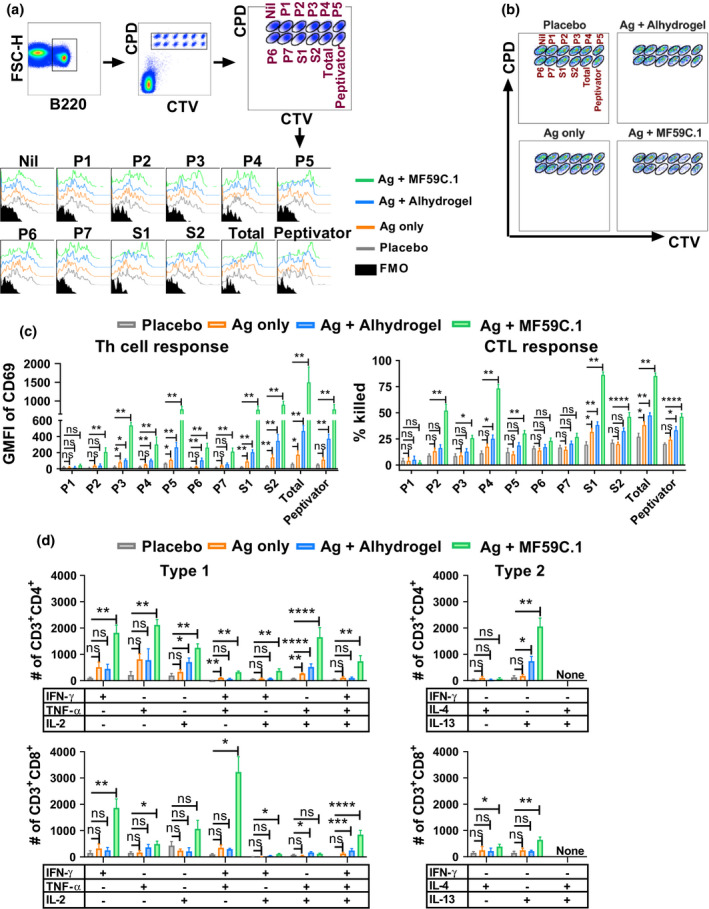
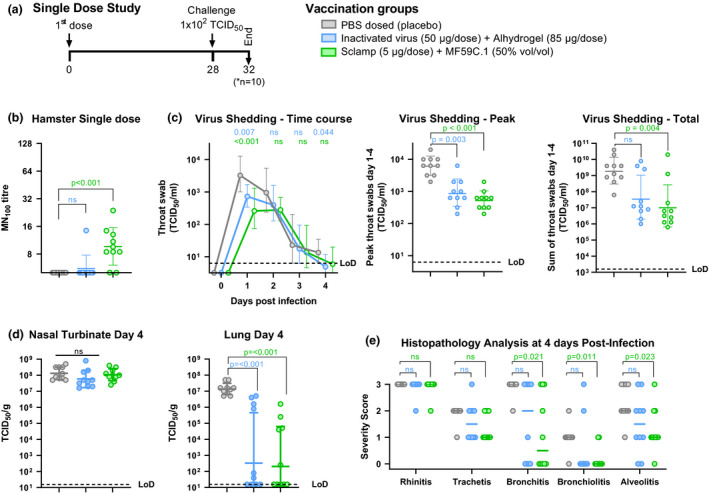
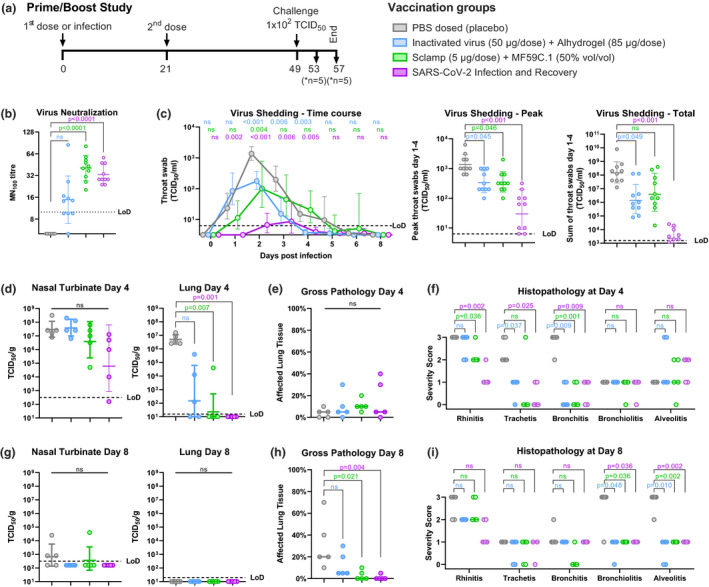
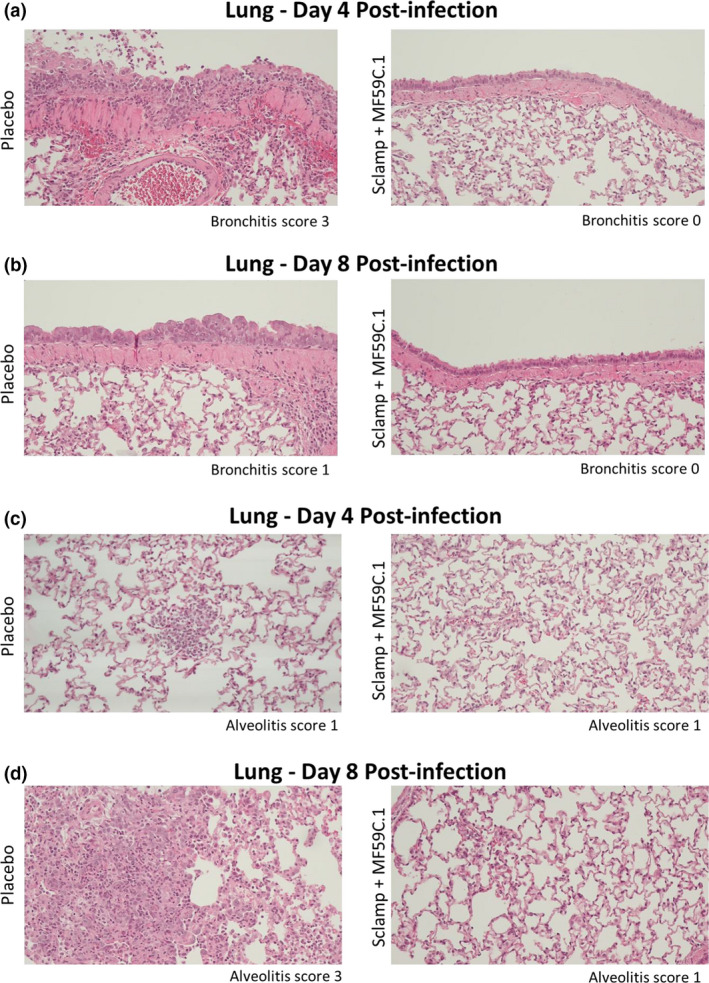
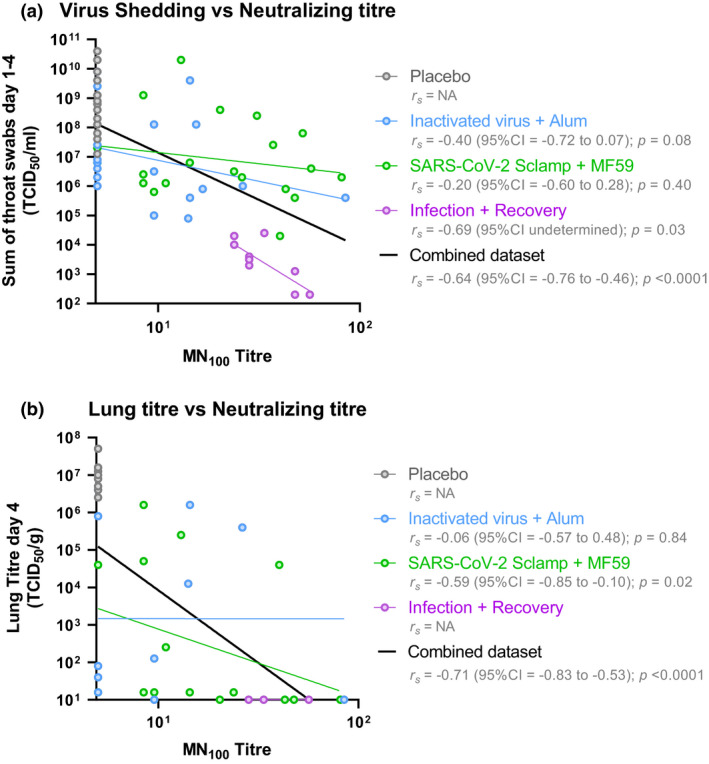
Results: In mice, the Sclamp vaccine elicits high levels of neutralising antibodies, as well as broadly reactive and polyfunctional S-specific CD4+ and cytotoxic CD8+ T cells in vivo. In the Syrian hamster challenge model (n = 70), vaccination results in reduced viral load within the lung, protection from pulmonary disease and decreased viral shedding in daily throat swabs which correlated strongly with the neutralising antibody level.

Conclusion: The SARS-CoV-2 Sclamp vaccine candidate is compatible with large-scale commercial manufacture, stable at 2-8°C. When formulated with MF59 adjuvant, it elicits neutralising antibodies and T-cell responses and provides protection in animal challenge models.

Keywords: Molecular Clamp; SARS‐CoV‐2; neutralising antibodies; polyfunctional T cells; rapid response; subunit vaccine.


Conflict of interest statement

KJC, DW and PRY are inventors of the ‘Molecular Clamp’ patent, US 2020/0040042.

Figures

Figure 1
Figure 1
Antigen design and analysis. (a) In vitro screening of S1/S2 linker modifications for yield and CR3022 affinity (K D), untransfected cell supernatant included as control. (b) Linear representation of recombinant spike antigen. (c) Sequence details for the furin site‐modified constructs assayed in a. (d) Size‐exclusion chromatography analysis of non‐stabilised wild‐type spike and Sclamp. (e) Antibody binding affinities (K D) for unstabilised vs Sclamp. (f) Cryo‐TEM reconstruction of antigen structure, fitted with prefusion spike structure PDB:6VXX 10 shown in rainbow cartoon for one S monomer. Representative top and side‐on 2D classes shown below, with a density for clamp indicated. (g) Production yield from CHO cell culture transient expression, stable pools and clones in flasks or bioreactors. Red—antigen concentration in cell culture supernatant estimated by BiaCore. Black—protein recovery following immunoaffinity purification as measured by absorbance at 280 nm. (h) Percentage trimer analysis of stability assessed using SE‐HPLC for the development batch and clinical trial batch of Sclamp following incubation of the protein at 4, 25 or 40°C for up to 13 weeks.
Figure 2
Figure 2
The antibody response following SARS‐CoV‐2 Sclamp vaccination in BALB/c mice (data from two of five repeat experiments shown). (a) Prime/boost vaccination and bleed schedule for the study. (b) SARS‐CoV‐2 Sclamp‐specific IgG EC50 titre (reciprocal EC50) in vaccinated mice (n = 10) 20, 35 and 42 days following IM injection of the first dose. (c) Day 42 serum MN titre against infectious SARS‐CoV‐2 614D as evaluated by MN50 assay (n = 10). (d) Day 42 serum MN titre against SARS‐CoV‐2 614D as evaluated by PRNT50 assay (n = 10). (e) Day 42 serum MN titre against SARS‐CoV‐2 614G as evaluated by PRNT50 assay (n = 10). (f) Day 42 BAL MN titre against SARS‐CoV‐2 614D as evaluated by PRNT50 assay (n = 10). (g) Day 42 BAL MN titre against SARS‐CoV‐2 614G as evaluated by PRNT50 assay. (h) Day 42 serum total Sclamp‐specific IgG EC50 titre and clamp‐specific IgG EC50 titre (n = 25). (i) Relative percentage of total IgG response directed to the clamp domain, and spike epitopes, calculated based on EC50 titres in h. (j) Spearman correlation between relative percentage clamp‐specific IgG and MN50 titre. P‐values were calculated following transformation of the neutralisation titres to log10 using (1) one‐way ANOVA with Tukey's multiple comparison post hoc test for normally distributed and homoscedastic data, (2) Welch's ANOVA with Games–Howell post hoc analysis for all heteroscedastic data and (3) the Kruskal–Wallis H‐test for non‐normally distributed and homoscedastic data sets.
Figure 3
Figure 3
MF59‐adjuvanted SARS‐CoV‐2 Sclamp vaccination elicits potent T‐cell responses in mice (data from two separate experiments shown). (a) Representative flow cytometry plots show the gating strategy for analysis of S‐specific Th cell responses based on the up‐regulation of CD69 on peptide‐pulsed B220+ single cells in the FTA. BALB/c mice vaccinated as in Figure 2a were challenged 19 days after boost with the FTA comprising S peptide‐pulsed, CPD and CTV‐labelled targets. FMO—fluorescent minus one control. (b) Dot plots showing all targets recovered from a representative FTA‐challenged mouse which were used to analyse the S‐specific CTL responses as described in the Methods. (c) Bar graphs show the mean (n = 5) and SEM of the geometric mean fluorescent intensity (GMFI) of CD69 on gated B220+ cells and the percentage of peptide‐pulsed targets that were killed in the FTA. (d) Mean (n = 5) and SEM of the number of the indicated cytokine‐producing S1–1226‐specific CD4+ or CD8+ T cells. For the ICS analysis, splenocytes recovered 24 days following boost from mice prime/boost vaccinated at 2‐weekly intervals were stimulated for 16 h with the total pool. P‐values for all the comparisons are shown in Supplementary tables 2–5 and the P‐values shown indicate significance relative to placebo (*P < 0.05; **P < 0.01; ***P < 0.001; ****P < 0.0001).
Figure 4
Figure 4
Protection of hamsters following a single dose of MF59‐adjuvanted Sclamp. (data from a single experiment shown). (a) Single‐dose study schedule. Syrian hamsters (n = 10/group) were vaccinated with a single dose of either a placebo, 50 μg inactivated virus with Alhydrogel or 5 μg SARS‐CoV‐2 Sclamp with MF59 prior to IN challenge with 100 TCID50 of SARS‐CoV‐2. (b) Average SARS‐CoV‐2 MN100 titre measured using hamster serum collected at day 21 and 28. (c) Kinetics of infectious viral load in daily throat swabs on days 1–4 post‐challenge (left panel), the peak virus titre from the kinetics analysis (middle panel), and the sum of virus titre for swabs collected on days 1–4 post‐challenge (right panel). (d) Viral loads in nasal turbinates and lung tissue at day 4 post‐challenge. (e) Severity score of inflammatory response based on histology at day 4 post‐challenge: 0 = no inflammatory cells, 1 = few inflammatory cells, 2 = moderate number of inflammatory cells and 3 = many inflammatory cells. P‐values were calculated using a Kruskal–Wallis ANOVA with Dunn's multiple comparison tests or a two‐way ANOVA with Dunnett's multiple comparison tests. Error bars show SD.
Figure 5
Figure 5
Protective outcomes following prime/boost vaccination (data from a single experiment shown). (a) Prime/boost study schedule. Syrian hamsters (n = 10/group) were vaccinated with two doses of either a placebo, 50 μg inactivated virus with Alhydrogel or 5 μg of SARS‐CoV‐2 Sclamp with MF59, or were infected with 102 TCID50 SARS‐CoV‐2 via IN administration and allowed to recover prior to challenge. (b) Average SARS‐CoV‐2 MN100 titre measured using serum collected at day 42 and 49. (c) Kinetics of infectious viral load in daily throat swabs on days 1–8 post‐challenge (left panel), the peak virus titre from the kinetics analysis (middle panel) and the sum of virus titre for swabs collected on days 1–4 post‐challenge (right panel). (d, g) Viral loads in nasal turbinate and lung tissue at day 4 and day 8 post‐challenge. (e, h) Extent of affected lung tissue damage as assessed by gross pathology at day 4 and day 8 post‐challenge. (f, i) Severity score of inflammatory response based on histology at day 4 and day 8 post‐challenge: 0 = no inflammatory cells, 1 = few inflammatory cells, 2 = moderate number of inflammatory cells and 3 = many inflammatory cells. P‐values were calculated using a Kruskal–Wallis ANOVA with Dunn's multiple comparison tests or a two‐way ANOVA with Dunnett's multiple comparison tests. Error bars show SD.
Figure 6
Figure 6
Representative histopathology images from the lungs of placebo and Sclamp + MF59‐vaccinated hamsters in the prime/boost study (10× objective; data from a single experiment are shown). (a, b) Representative images used for bronchitis scoring on day 4 and day 8 post‐challenge. (c, d) Representative images used for alveolitis scoring on day 4 and day 8 post‐challenge.
Figure 7
Figure 7
Correlation between neutralising antibodies and protection in hamster (data from two experiments shown). (a) Log‐transformed MN100 titre was compared against the log‐transformed measure of total virus shedding (sum of throat swabs day 1–4 TCID50 mL−1) for all 70 animals included in the single‐dose and prime/boost challenge studies. (b) Log‐transformed MN100 titre was compared against the log‐transformed measure of virus in lung tissue at day 4 post‐challenge for 50 animals sacrificed at day 4 included in the single‐dose and prime/boost challenge studies. Spearman non‐parametric correlation and associated values were calculated for each treatment and the combined dataset using GraphPad Prism 8.4.3.

References

    1. Amanat F, Krammer F. SARS‐CoV‐2 vaccines: status report. Immunity 2020; 52: 583–589. - PMC - PubMed
    1. WHO(WHO) . DRAFT landscape of COVID‐19 candidate vaccines; 2021. https://www.who.int/publications/m/item/draft‐landscape‐of‐covid‐19‐cand...
    1. Keech C, Albert G, Cho I et al. Phase 1–2 trial of a SARS‐CoV‐2 recombinant spike protein nanoparticle vaccine. N Engl J Med 2020; 383: 2320–2332. - PMC - PubMed
    1. Chappell K, Watterson D, Young P. Chimeric Molecules and Uses Thereof US Patent 2020/0040042; 2018.
    1. Ekiert DC, Kashyap AK, Steel J et al. Cross‐neutralization of influenza A viruses mediated by a single antibody loop. Nature 2012; 489: 526–532. - PMC - PubMed