. 2021 Mar 24:11:637604.
doi: 10.3389/fcimb.2021.637604. eCollection 2021.

Sickle Cell Trait Modulates the Proteome and Phosphoproteome of Plasmodium falciparum-Infected Erythrocytes

Affiliations

Sickle Cell Trait Modulates the Proteome and Phosphoproteome of Plasmodium falciparum-Infected Erythrocytes

Margaux Chauvet et al. Front Cell Infect Microbiol. .

Abstract

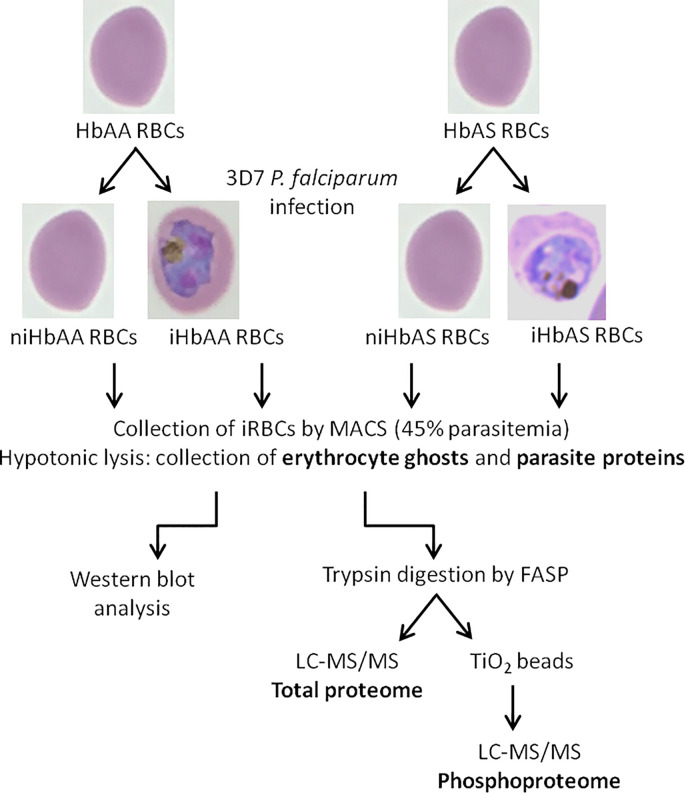
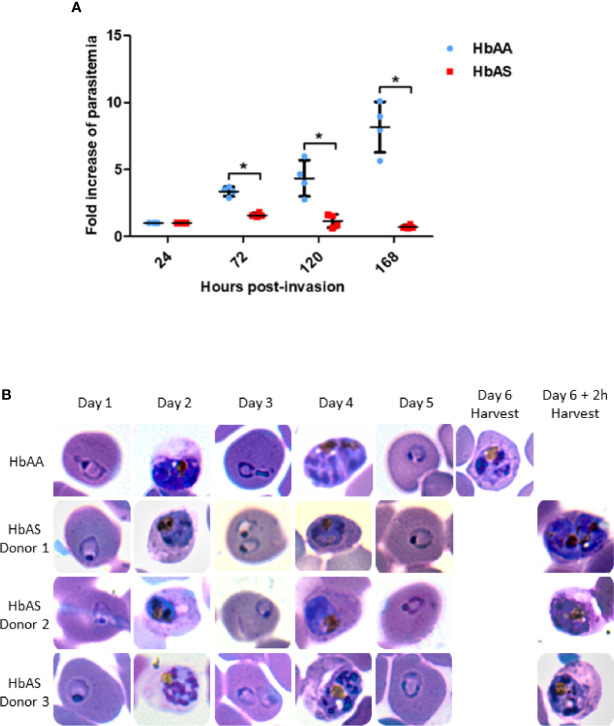
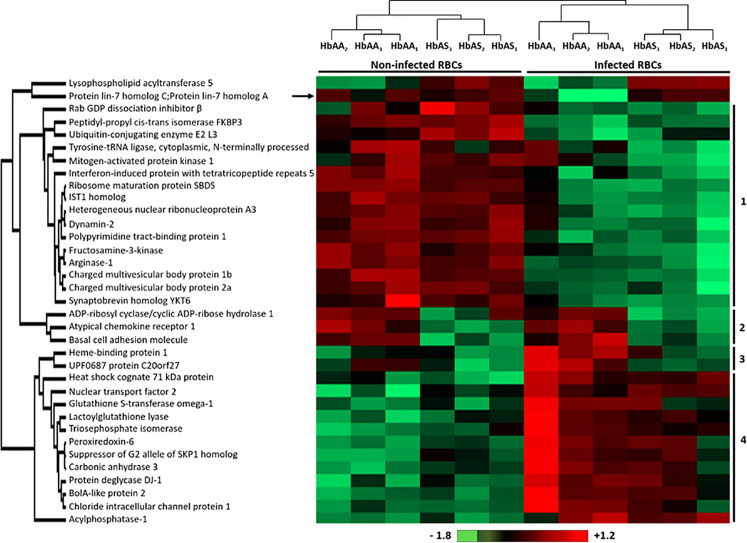
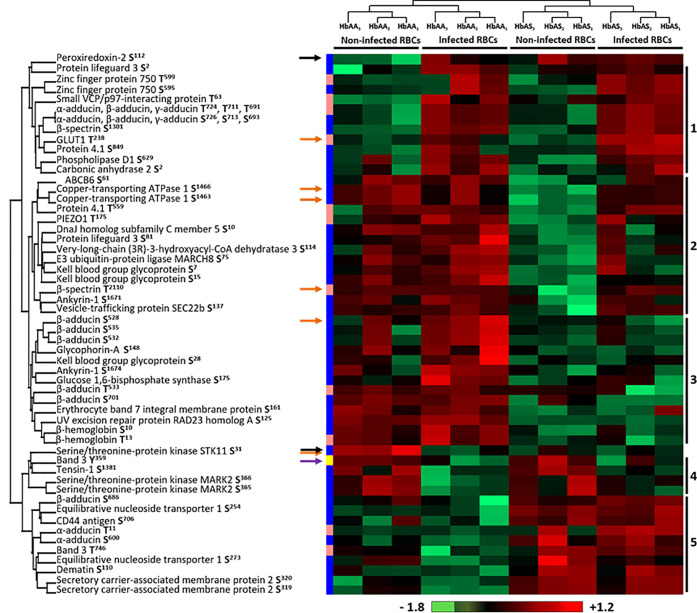
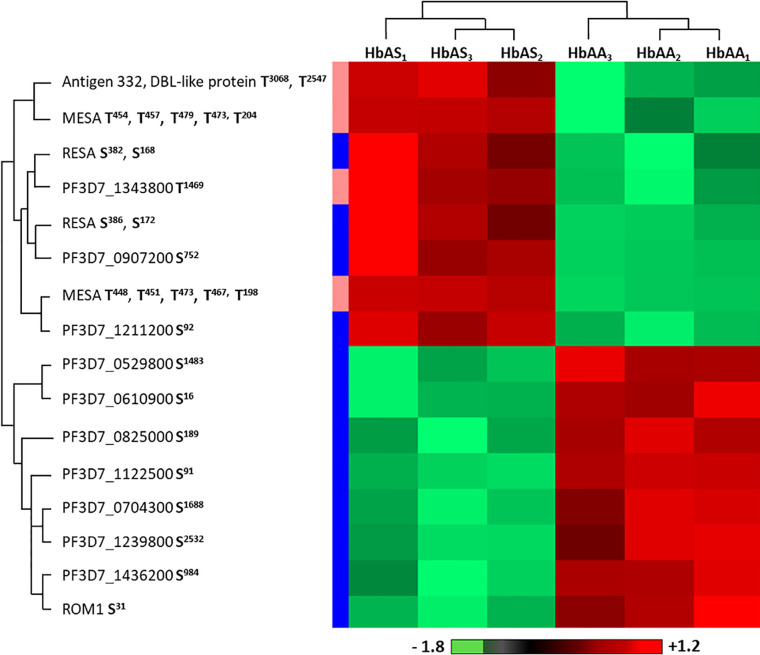
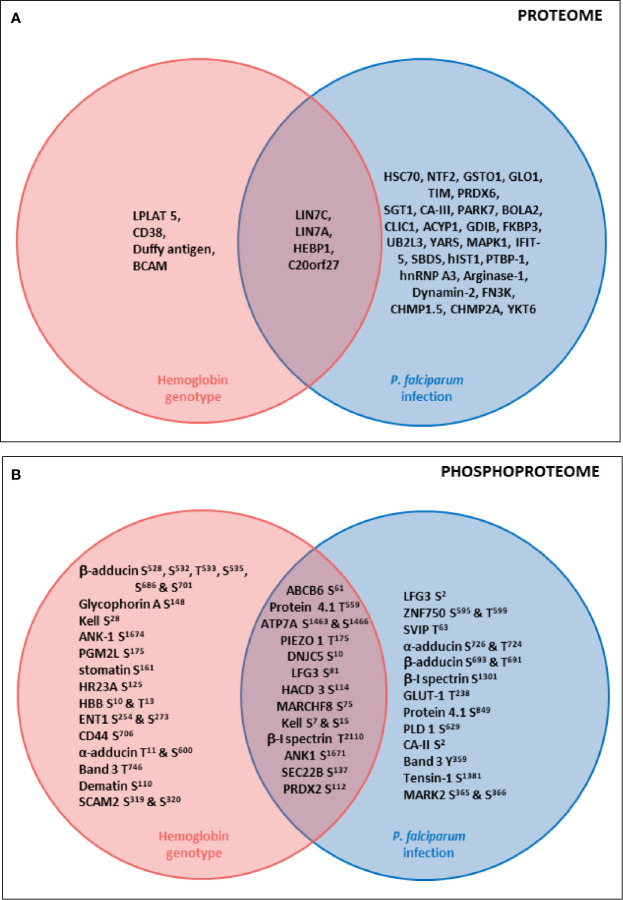
The high prevalence of sickle cell disease in some human populations likely results from the protection afforded against severe Plasmodium falciparum malaria and death by heterozygous carriage of HbS. P. falciparum remodels the erythrocyte membrane and skeleton, displaying parasite proteins at the erythrocyte surface that interact with key human proteins in the Ankyrin R and 4.1R complexes. Oxidative stress generated by HbS, as well as by parasite invasion, disrupts the kinase/phosphatase balance, potentially interfering with the molecular interactions between human and parasite proteins. HbS is known to be associated with abnormal membrane display of parasite antigens. Studying the proteome and the phosphoproteome of red cell membrane extracts from P. falciparum infected and non-infected erythrocytes, we show here that HbS heterozygous carriage, combined with infection, modulates the phosphorylation of erythrocyte membrane transporters and skeletal proteins as well as of parasite proteins. Our results highlight modifications of Ser-/Thr- and/or Tyr- phosphorylation in key human proteins, such as ankyrin, β-adducin, β-spectrin and Band 3, and key parasite proteins, such as RESA or MESA. Altered phosphorylation patterns could disturb the interactions within membrane protein complexes, affect nutrient uptake and the infected erythrocyte cytoadherence phenomenon, thus lessening the severity of malaria symptoms.

Keywords: Plasmodium falciparum; erythrocyte; hemoglobin S; membrane phosphorylation; proteomics.


Conflict of interest statement

The authors declare that the research was conducted in the absence of any commercial or financial relationships that could be construed as a potential conflict of interest.

Figures

Figure 1
Figure 1
Schematic workflow of infected and non-infected HbAA and HbAS erythrocytes proteome and phosphoproteome experimental procedures – HbAA and HbAS erythrocytes were collected and infected in vitro with the 3D7 P. falciparum strain. Mature trophozoite/schizont-infected RBCs were collected by MACS (45% parasitemia) and lysed to produce ghosts and collect parasites. Membrane erythrocyte lysates were analyzed by western blot. For mass spectrometry, after trypsin digestion of proteins, phosphopeptides were enriched on TiO2 columns and analyzed by LC-MS/MS. Total proteomes of erythrocyte and parasite proteins were also generated. i, infected; ni, non-infected.
Figure 2
Figure 2
Parasite replication in HbAA and HbAS RBCs assessed by flow cytometry (A) and by blood smears (B). Invasion of 2 HbAA (HbAA1 and HbAA2) and 2 HbAS (HbAS1 and HbAS2) blood samples from the cryobank of the the French National Immunohematology Reference Laboratory (CNRGS), was realized at t = 0h. Parasitemia was assessed every 24h. To visualize the fold increase of parasitemia, all parasitemia values were divided by the initial parasitemia measured 24h post-infection. Technical duplicates were performed for each donor, and replicate values for each point were loaded on the graph. Unpaired Mann-Whitney t-test (p-value<0.05) was used to compare values from HbAA and HbAS groups at 24h, 72h, 120h and 168 h., asterisks (*) indicate significantly different values (A). Parasite development in one HbAA (HbAA1 as a reference) and 3 HbAS (HbAS1, HbAS2 and HbAS3) blood donors erythrocytes. Invasion of fresh blood samples was realized at t = 0h. Blood smears were performed every 24h for six days. At day 6, blood smears were realized right before MACS collection (B).
Figure 3
Figure 3
Differentially detected human erythrocyte proteins as a function of P. falciparum infection and/or HbAS genotype. Six HbAA (non-infected and infected HbAA1, HbAA2, and HbAA3) and six HbAS (non-infected and infected HbAS1, HbAS2, and HbAS3) erythrocyte ghost samples were analyzed by hierarchical clustering based on the detected quantity of RBC proteins (ANOVA test, p-value < 0.05). Samples are displayed horizontally (columns) and proteins are shown vertically (rows). The more the protein is represented in light red, the more it is detected in the corresponding sample, and the more it is colored in light green, the less it is detected. The color bar represents log2 Z score fold-change. Proteins are clustered according to their quantity profile, represented by dendograms. Black arrow: protein profile that cannot be associated with a cluster.
Figure 4
Figure 4
Differentially phosphorylated sites of human erythrocyte proteins as a function of P. falciparum infection and/or HbAS genotype. Six HbAA (non-infected and infected HbAA1, HbAA2, and HbAA3) and six HbAS (non-infected and infected HbAS1, HbAS2 and HbAS3) were analyzed by hierarchical clustering based on the phosphorylation rate of a specific site of RBC proteins (ANOVA test, p-value < 0.05). Samples are displayed horizontally (columns) and proteins are shown vertically (rows). Sites are specified next to the protein name. The more the site is represented in light red, the more it is phosphorylated in the corresponding sample, and the more it is colored in light green, the less it is phosphorylated. The color bar represents log2 Z score fold-change. On the left, threonine (T) residues are in pink, serines (S) in blue and tyrosine (Y) in yellow. Proteins are clustered according to their phosphorylation profile, represented by dendograms. Black arrows: protein profiles that cannot be associated with a cluster, orange arrows: phosphosites differentially phosphorylated according to both P. falciparum infection and abnormal heterozygous HbS carriage.
Figure 5
Figure 5
Differences of Band 3 Y21 (A, C) and Y359 (B, D) phosphorylation according to P. falciparum infection and abnormal hemoglobin S carriage. 4-12% gradient gels were loaded with 20 µg/lane of ghost protein extracts from 2 HbAA (HbAA1 and HbAA2) and 2 HbAS (HbAS1 and HbAS2) donors. After separation of erythrocyte ghost lysate proteins by SDS-PAGE and transfer on nitrocellulose, tyrosine (Y)-phosphorylation was analyzed using anti-phosphoY21 (A) and anti-phosphoY359 (B) Band 3 antibodies. Tyrosine phosphorylation intensities were measured with Image Lab software, and these intensities were normalized to Band 3 quantity detected on the same membrane by western blot. For each sample, the phosphorylation intensity value of infected condition was reported to the non-infected condition intensity value (C, D). Independent western blots were realized twice, and technical replicate values for each point were loaded on the graph. Phosphorylation fold intensities for HbAA and HbAS samples were represented in blue and red respectively, with non-infected (circles) and infected (square) ghosts. Paired t-test (*p-value < 0.05; **p-value < 0.01, and ***p-value < 0.001) were performed to compare intensities from the same genotype group (HbAA or HbAS) donors. Unpaired Mann-Whitney t-test (*p-value < 0.05; **p-value < 0.01, and ***p-value < 0.001) was used to compare intensities from infected HbAA and infected HbAS donors. i, infected; ni, non-infected; ns, not significant.
Figure 6
Figure 6
Differentially phosphorylated sites of parasite proteins according to hemoglobin genotype. Parasites from three HbAA (infected HbAA1, HbAA2, and HbAA3) and three HbAS (infected HbAS1, HbAS2, and HbAS3) extracts were analyzed by hierarchical clustering based on the phosphorylation’s rate of a specific site of RBC proteins (Student’s t-test, p-value < 0.05). Samples are displayed horizontally (columns) and proteins are shown vertically (rows). Phosphosites are specified next to the protein name. The more the site is represented in dark red, the more it is phosphorylated in the corresponding sample, and the more it is colored in light green, the less it is phosphorylated. The color bar represents log2 Z score fold-change. On the left, threonine (T) residues are in pink and serines (S) in blue. Proteins are clustered according to their phosphorylation profile, represented by dendograms.
Figure 7
Figure 7
Summary diagrams of proteome (A) and phosphoproteome (B) modulations of erythrocyte proteins according to P. falciparum infection and HbS carriage. Venn diagrams describing proteins whose quantity (A) or phosphorylation intensity (B) are varying according to hemoglobin genotype, P. falciparum infection or both parameters. Uniprot short names of proteins were represented, and phosphosites indicated. Erythrocyte proteins whose quantity (A) or phosphorylation intensity (B) was varying according to only hemoglobin genotype (ANOVA test) were presented in the pink circle. Erythrocyte proteins whose quantity (A) or phosphorylation intensity (B) was varying according to only P. falciparum infection (ANOVA test) were presented in the blue circle. Erythrocyte proteins whose quantity (A) or phosphorylation intensity (B) was varying according to both hemoglobin genotype and P. falciparum infection (ANOVA test) were presented in the junction between the pink and the blue circle.

References

    1. Abdi A. I., Carvalho T. G., Wilkes J. M., Doerig C. (2013). A secreted Plasmodium falciparum kinase reveals a signature motif for classification of tyrosine kinase-like kinases. Microbiol. Read. Engl. 159, 2533–2547. 10.1099/mic.0.070409-0 - DOI - PubMed
    1. Archer N. M., Petersen N., Clark M. A., Buckee C. O., Childs L. M., Duraisingh M. T. (2018). Resistance to Plasmodium falciparum in sickle cell trait erythrocytes is driven by oxygen-dependent growth inhibition. Proc. Natl. Acad. Sci. U. S. A. 115, 7350–7355. 10.1073/pnas.1804388115 - DOI - PMC - PubMed
    1. Azouzi S., Collec E., Mohandas N., An X., Colin Y., Le Van Kim C. (2015). The human Kell blood group binds the erythroid 4.1R protein: new insights into the 4.1R-dependent red cell membrane complex. Br. J. Haematol. 171, 862–871. 10.1111/bjh.13778 - DOI - PMC - PubMed
    1. Azouzi S., Romana M., Arashiki N., Takakuwa Y., El Nemer W., Peyrard T., et al. . (2018). Band 3 phosphorylation induces irreversible alterations of stored red blood cells. Am. J. Hematol. 93, E110–E112. 10.1002/ajh.25044 - DOI - PubMed
    1. Badaut C., Guyonnet L., Milet J., Renard E., Durand R., Viwami F., et al. . (2015). Immunoglobulin response to Plasmodium falciparum RESA proteins in uncomplicated and severe malaria. Malar. J. 14, 278. 10.1186/s12936-015-0799-8 - DOI - PMC - PubMed

Publication types