. 2021 Mar 25:9:642724.
doi: 10.3389/fcell.2021.642724. eCollection 2021.

Identification of Stemness-Related Genes for Cervical Squamous Cell Carcinoma and Endocervical Adenocarcinoma by Integrated Bioinformatics Analysis

Affiliations

Identification of Stemness-Related Genes for Cervical Squamous Cell Carcinoma and Endocervical Adenocarcinoma by Integrated Bioinformatics Analysis

Hongjun Guo et al. Front Cell Dev Biol. .

Abstract

Background: Invasion and metastasis of cervical cancer are the main factors affecting the prognosis of patients with cervical squamous cell carcinoma (CESC). Therefore, it is of vital importance to find novel biomarkers that are associated with CESC invasion and metastasis, which will aid in the amelioration of individualized therapeutic methods for advanced patients.

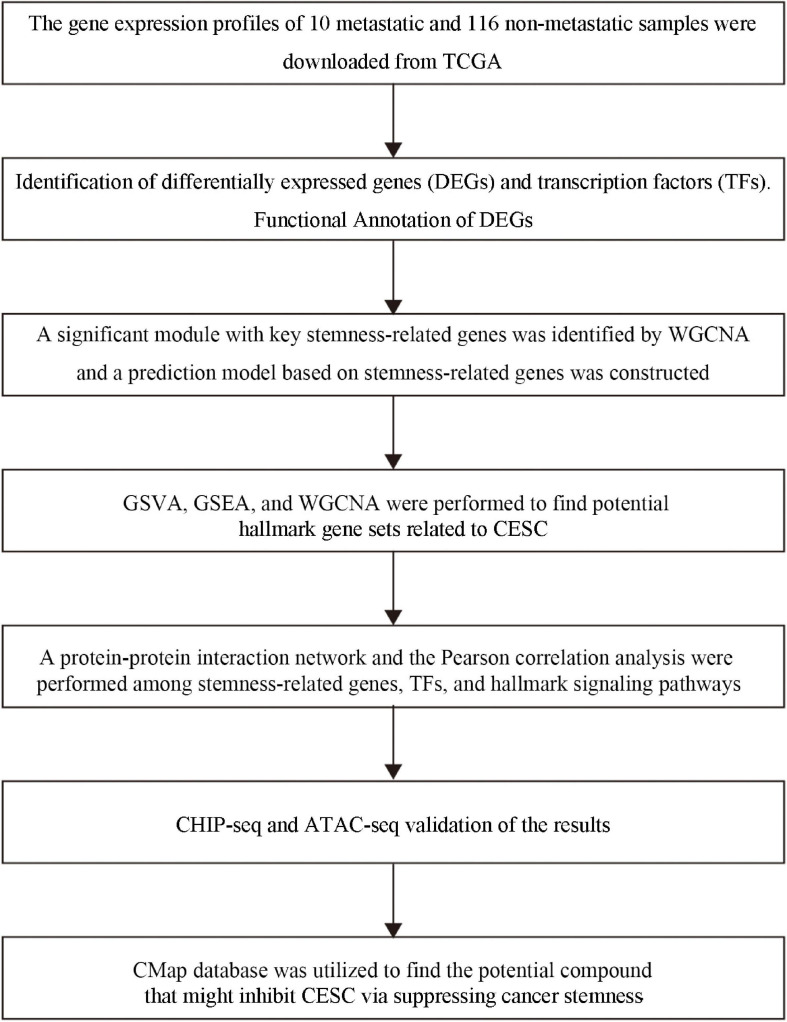
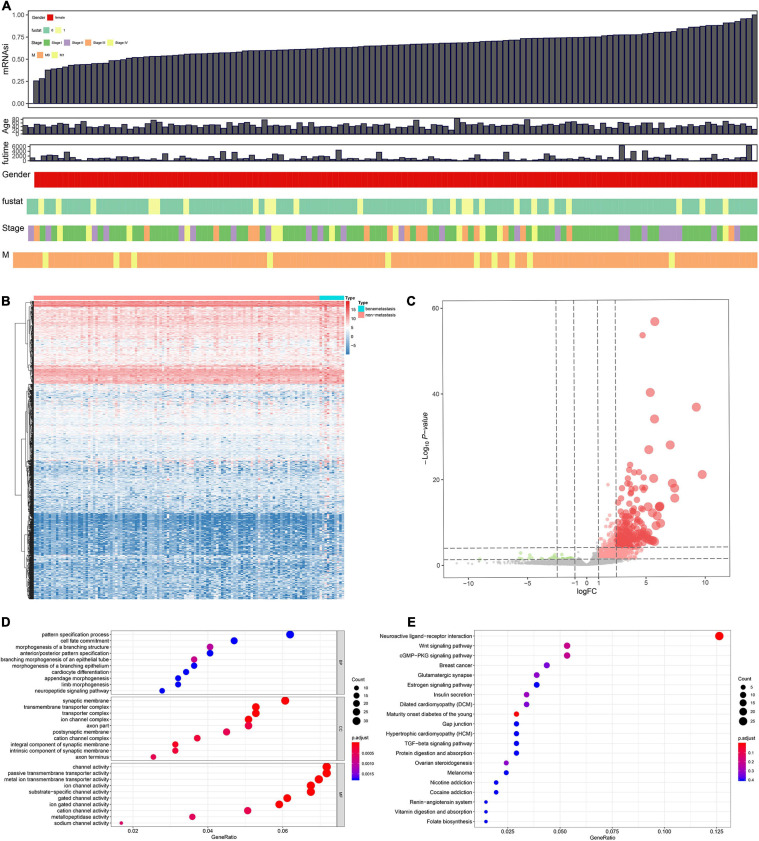
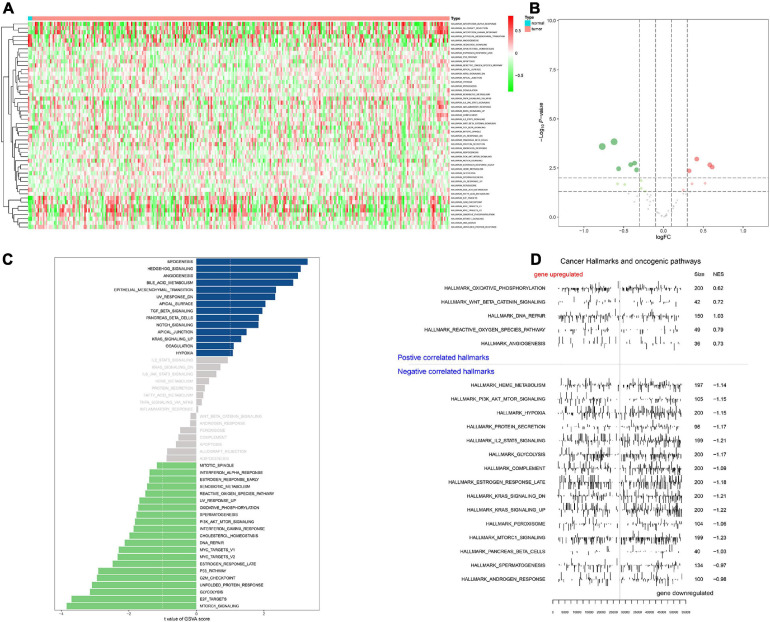
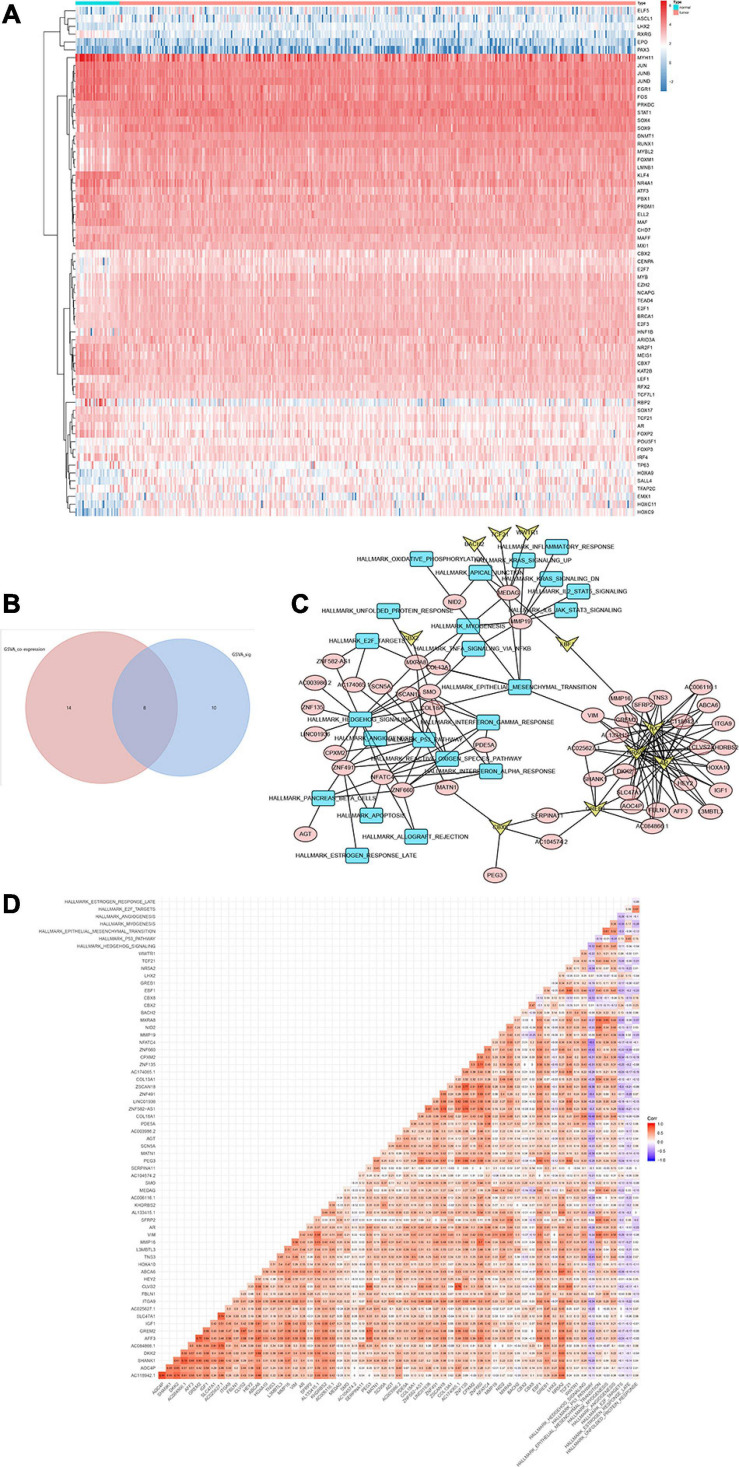
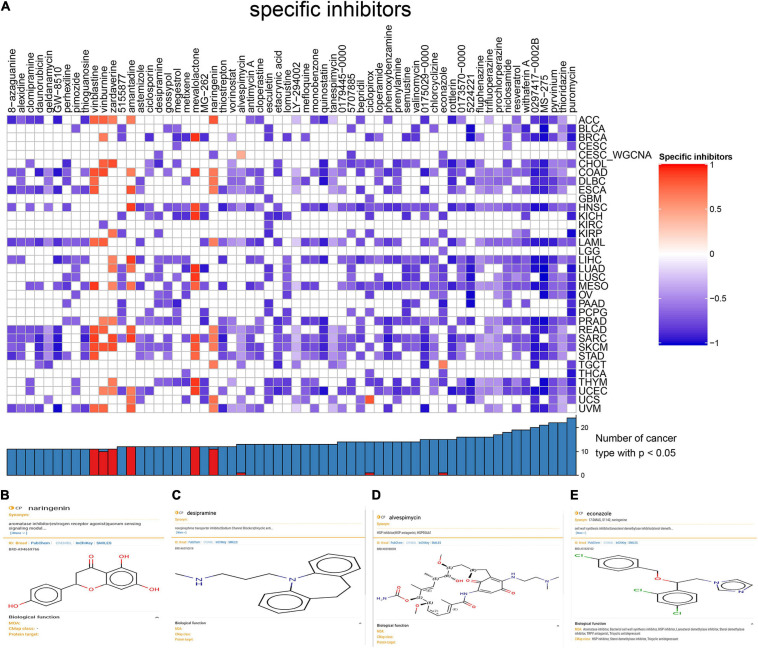
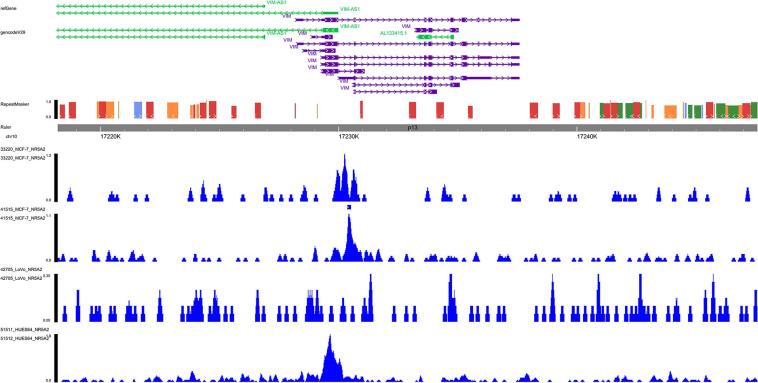
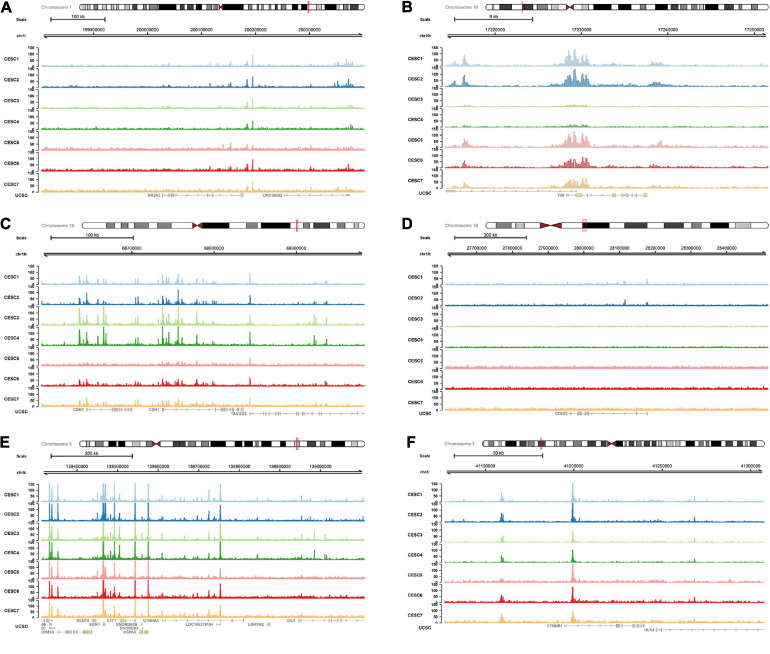
Methods: The gene expression profiles of 10 metastatic and 116 non-metastatic samples were downloaded from The Cancer Genome Atlas (TCGA), where differentially expressed genes (DEGs) were defined. Weighted gene correlation network analysis (WGCNA) was employed to identify the stemness-related genes (SRGs). Univariate and multivariate regression analyses were used to identify the most significant prognostic key genes. Differential expression analysis of transcription factor (TF) and Gene Set Variation Analysis (GSVA) were utilized to explore the potential upstream regulation of TFs and downstream signaling pathways, respectively. Co-expression analysis was performed among significantly enriched TFs, key SRGs, and signaling pathways to construct a metastasis-specific regulation network in CESC. Connectivity Map (CMap) analysis was performed to identify bioactive small molecules which might be potential inhibitors for the network. Additionally, direct regulatory patterns of key genes were validated by ChIP-seq and ATAC-seq data.

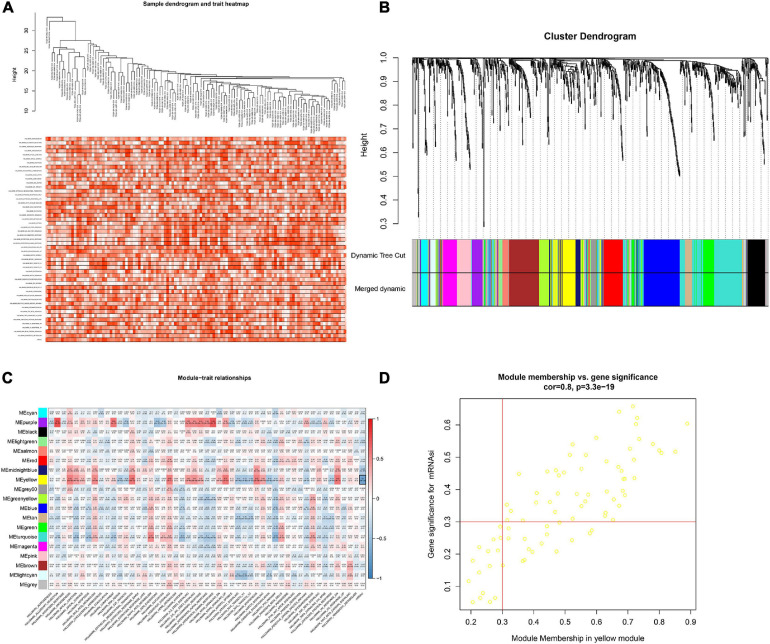
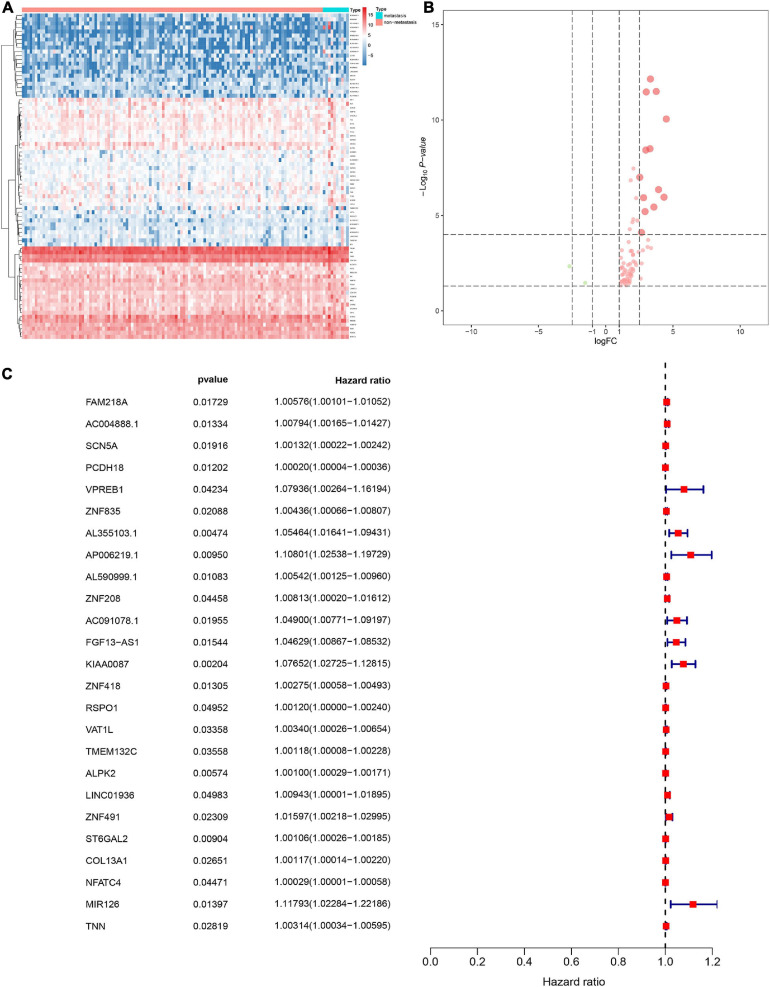
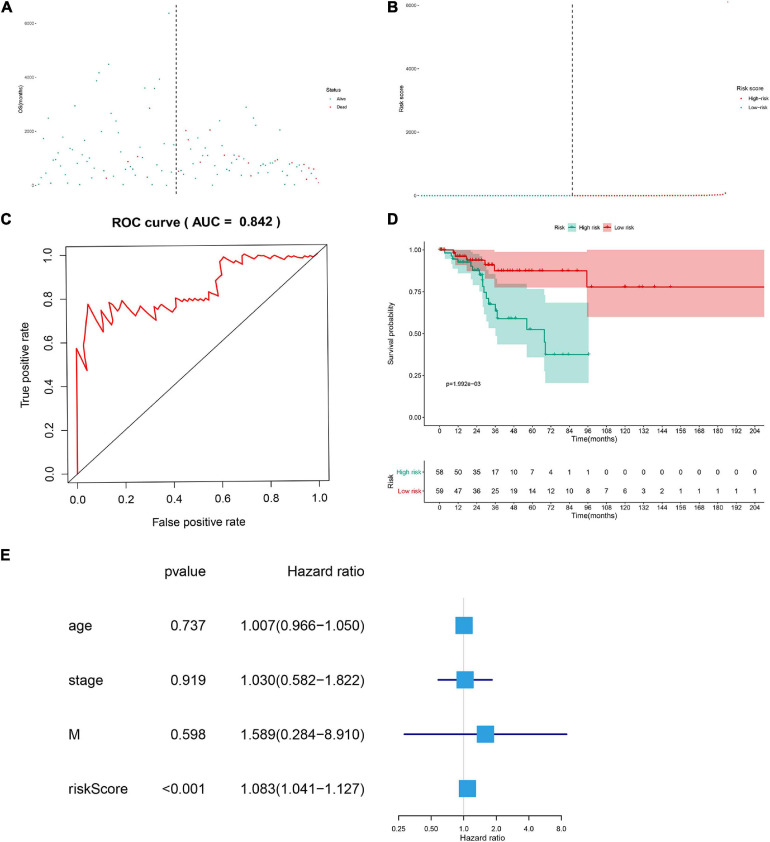
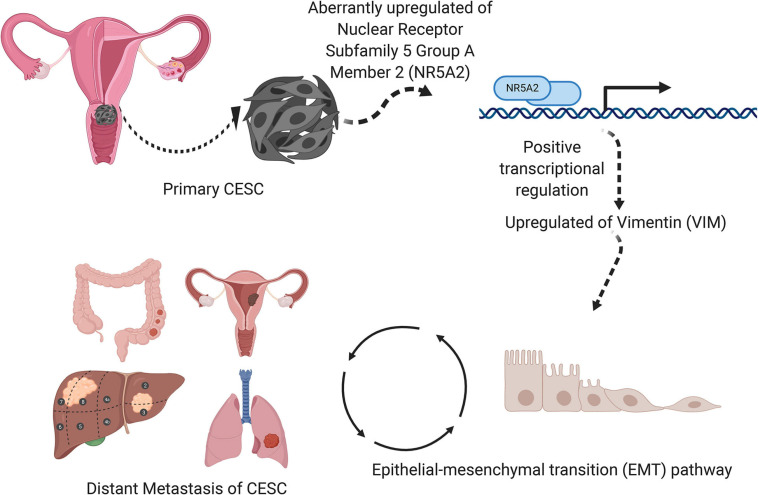
Results: DEGs in yellow module acquired via WGCNA were defined as key genes which were most significantly related to mRNAsi. A multivariate Cox regression model was constructed and then utilized to explore the prognostic value of key SRGs by risk score. Area under curve (AUC) of the receiver operating characteristic (ROC) curve was 0.842. There was an obvious co expression pattern between the TF NR5A2 and the key gene VIM (R = 0.843, p < 0.001), while VIM was also significantly co-expressed with hallmark epithelial mesenchymal transition (EMT) signaling pathway (R = 0.318, p < 0.001). Naringenin was selected as the potential bioactive small molecule inhibitor for metastatic CESC based on CMap analysis.

Conclusions: VIM positively regulated by NR5A2 affected EMT signaling pathways in metastatic CESC, and naringenin was the inhibitor for the treatment of metastatic CESC via suppressing cancer stemness. This hypothetical signaling axis and potential inhibitors provide biomarkers and novel therapeutic targets for metastatic CESC.

Keywords: cancer stemness; cervical cancer; epithelial mesenchymal transition; metastasis; naringenin; prognosis.


Conflict of interest statement

The authors declare that the research was conducted in the absence of any commercial or financial relationships that could be construed as a potential conflict of interest.

Figures

FIGURE 1
FIGURE 1
The flow chart of the analysis process. TCGA, the Cancer Genome Atlas; MsigDB, Molecular Signatures Database; KEGG, Kyoto Encyclopedia of Genes and Genomes; WGCNA, Weighted Gene Correlation Network Analysis; GSVA, Gene Set Variation Analysis; GSEA, Gene-Set Enrichment Analysis.
FIGURE 2
FIGURE 2
Combinative analyses based on gene expression stemness indices (A). Heat map for the differentially expressed genes (DEGs) between 10 metastatic and 116 non-metastatic patients with the cervical squamous cell carcinoma and endocervical adenocarcinoma (CESC) (B). Volcano plot for DEGs between 10 metastatic and 116 non-metastatic patients with CESC (C). The functional enrichment analysis for these DEGs in Gene Ontology (GO) terms (D) and Kyoto Encyclopedia of Genes and Genomes (KEGG) pathways (E).
FIGURE 3
FIGURE 3
Clustering based on the transcriptional level of 50 hallmark gene sets in chordoma samples (A). Hierarchical clustering tree developed by the weighted correlation coefficients. Each branch represents a co-expression module in different colors (B). Heatmap showing the correlation between modules and hallmark gene sets. The framed yellow module was the key module which was most relevant to mRNAsi. Gene Significance (GS) and its corresponding p value were computed and shown in the heatmap (C). Scatter diagram showing the correlation between gene significance for hallmarks of cancer and Module Membership in yellow module (D).
FIGURE 4
FIGURE 4
Heat map for the differentially expressed stemness-related genes (DESRGs) between 10 metastatic and 116 non-metastatic patients with CESC (A). Volcano plot for DESRGs between 10 metastatic and 116 non-metastatic patients with CESC (B). The proportional hazards model based on 25 key DEMRGs (C).
FIGURE 5
FIGURE 5
The scatter plot of the samples (A), the risk curve of each sample reordered by risk score (B), green and red represent low risk and high risk groups, respectively. ROC curve (AUC = 0.921) for prognostic DESRGs (C). Overall survival Kaplan–Meier curve for prognostic DEMRGs (p < 0.001) (D). Univariate Cox regression models indicated the risk score was an independent prognostic factor (E).
FIGURE 6
FIGURE 6
Heat map for Gene set variation analysis (GSVA) showing the co-expression level of 50 hallmark gene sets in CESC samples (A). Volcano plot for hallmark signaling pathways, green and red dots represented significant differential expression in PBMC samples (B). Bar plot revealing the t value of GSVA score (C). Positive correlated hallmarks and Negative correlated hallmarks acquired by GSEA (D).
FIGURE 7
FIGURE 7
Heat map showing the expression level of 65 differential expressed transcriptional factors (TFs) between 10 metastatic and 116 non-metastatic patients with CESC (A). Venn plot for hallmarks of cancer via GSVA. Eight downstream mechanism were extracted from the intersection (B). Regulatory network of TFs, DESRGs, and hallmark signaling pathways. Arrows represented TFs. Ellipses represented DESRGs. Rectangles represented hallmark signaling pathways (C). Heat map for the correlation analysis (Pearson analysis) of DESRGs, TFs, and hallmark signaling pathways (D).
FIGURE 8
FIGURE 8
Heat map for small-molecule compounds from the CMap which might be capable of inhibiting CESC via suppressing cancer stemness (A). Structural formulas and biological functions of naringenin (B), desipramine (C), alvespimycin (D), and econazole (E).
FIGURE 9
FIGURE 9
ChIP-seq data validation. In NR5A2 ChIP-seq data, multiple binding peaks were found in VIM sequences. ChIP-seq, Chromatin immunoprecipitation sequence.
FIGURE 10
FIGURE 10
ATAC-seq data validation. In ATAC-seq data of CESC, multiple peaks were identified in NR5A2 (A), VIM (B), CDH1 (C), CDH2 (D), CTNNA1 (E), and CTNNB1 (F) sequences. ATAC-seq, assay for transposase-accessible Chromatin with high-throughput sequencing.
FIGURE 11
FIGURE 11
A speculatively schematic diagram of the scientific hypothesis including the most significant DESRG (VIM), TF (NR5A2), and downstream pathway (Hallmark epithelial mesenchymal transition).

References

    1. Afify S. M., Seno M. (2019). Conversion of Stem Cells to Cancer Stem Cells: Undercurrent of Cancer Initiation. Cancers 11:345. 10.3390/cancers11030345 - DOI - PMC - PubMed
    1. Ahamad M. S., Siddiqui S., Jafri A., Ahmad S., Afzal M., Arshad M. (2014). Induction of Apoptosis and Antiproliferative Activity of Naringenin in Human Epidermoid Carcinoma Cell through ROS Generation and Cell Cycle Arrest. PLoS One 9:e110003. 10.1371/journal.pone.0110003 - DOI - PMC - PubMed
    1. Ayob A. Z., Ramasamy T. S. (2018). Cancer stem cells as key drivers of tumour progression. J. Biomed. Sci. 25:20. - PMC - PubMed
    1. Barth M. J. (2020). NCCN Clinical Practice Guidelines in Oncology (NCCN Guidelines (R)). J. Natl. Comprehens. Cancer Netw. 18 Xliv–Xliv.
    1. Buenrostro J. D., Giresi P. G., Zaba L. C., Chang H. Y., Greenleaf W. J. (2013). Transposition of native chromatin for fast and sensitive epigenomic profiling of open chromatin, DNA-binding proteins and nucleosome position. Nat. Methods 10 1213–1218. 10.1038/nmeth.2688 - DOI - PMC - PubMed

LinkOut - more resources