

The Impact of COVID-19 on Primary Care General Practice Consultations in a Teaching Hospital in Shanghai, China
- PMID: 33842504
- PMCID: PMC8033033
- DOI: 10.3389/fmed.2021.642496
The Impact of COVID-19 on Primary Care General Practice Consultations in a Teaching Hospital in Shanghai, China
Abstract
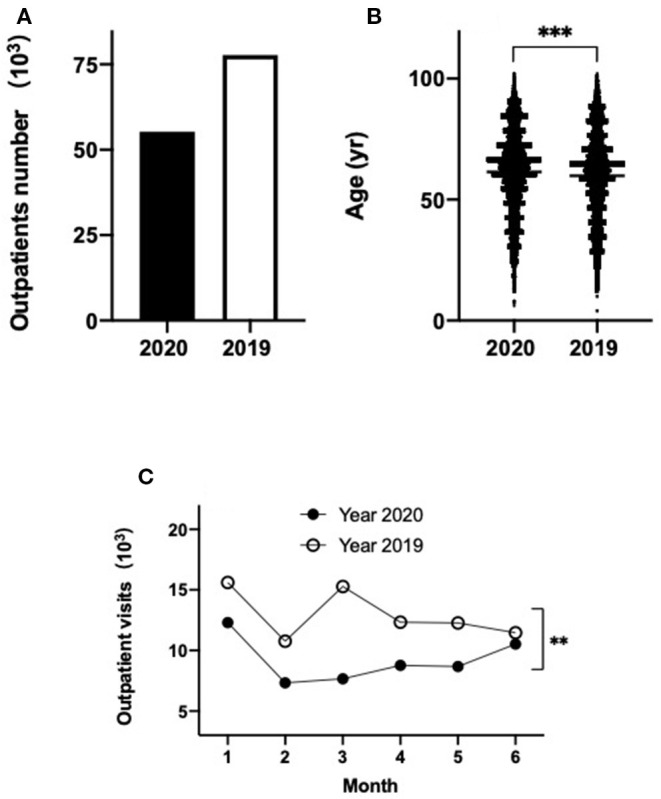
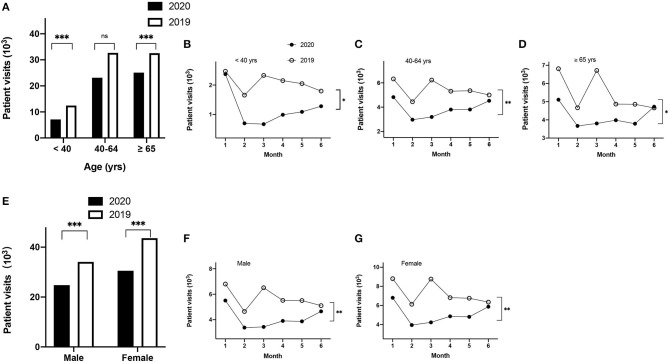
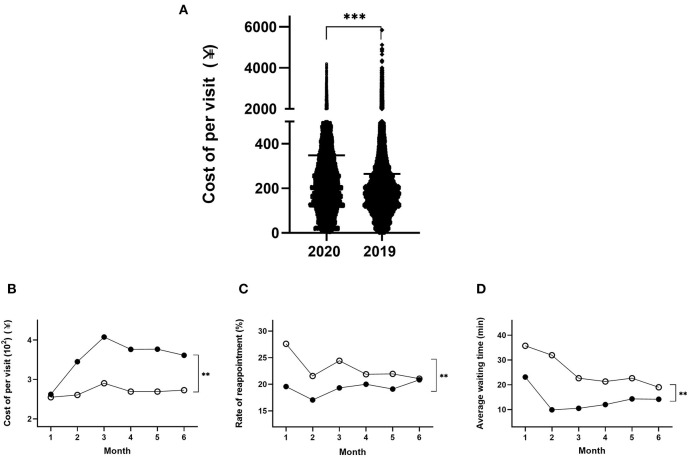
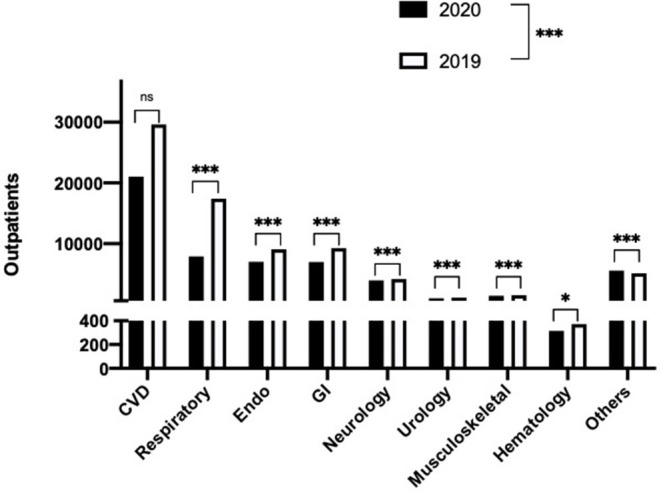
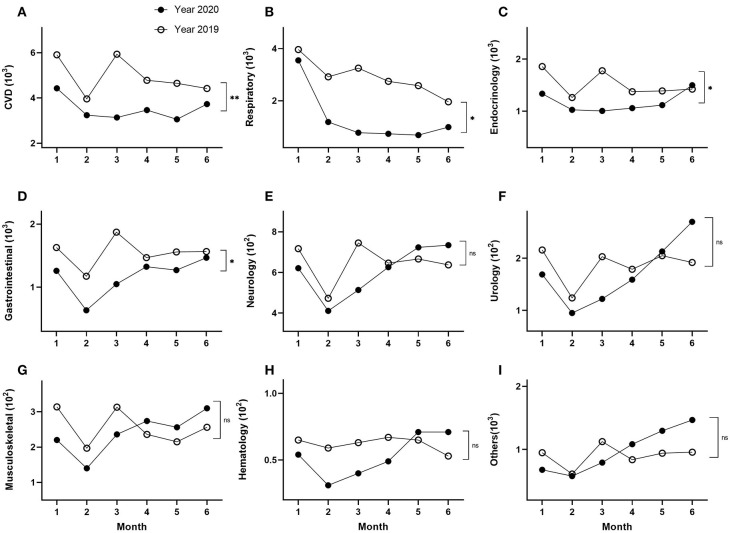
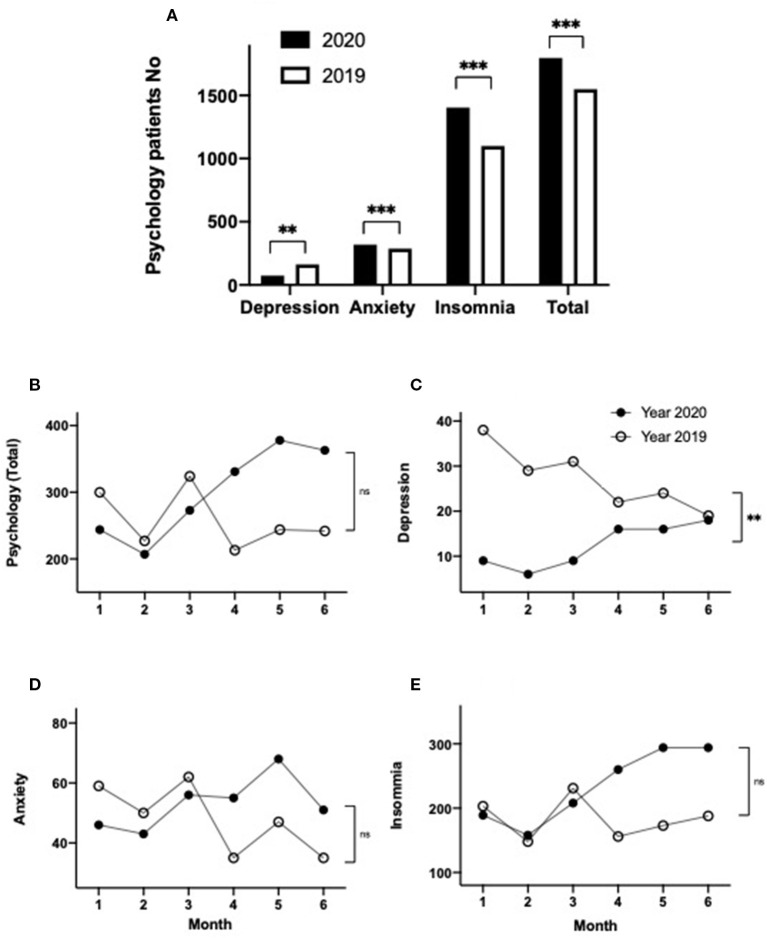
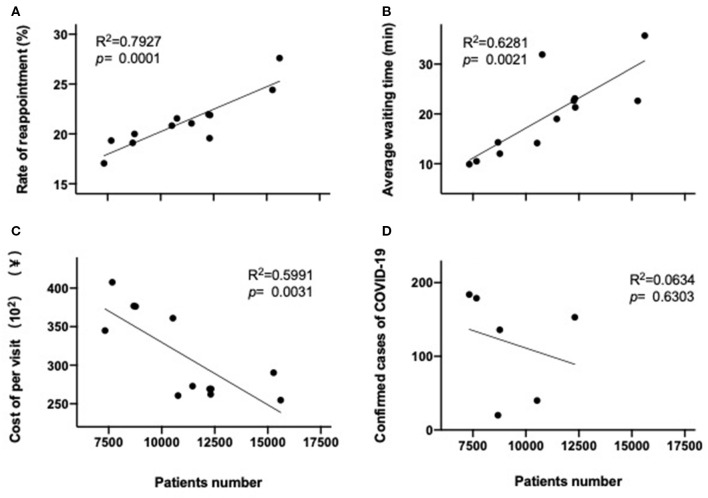
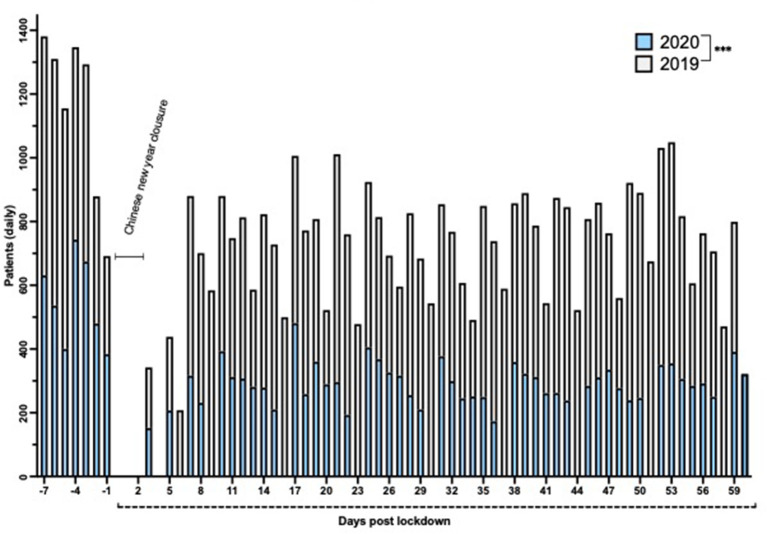
Background: The COVID-19 (2019 novel coronavirus disease) pandemic is deeply concerning because of its massive mortality and morbidity, creating adverse perceptions among patients likely to impact on their overall medical care. Thus, we evaluated the impact of the COVID-19 pandemic on the pattern of primary care consultations within a Shanghai health district. Methods: A retrospective observational cohort study was performed, with data analyzed concerning the pattern of patient visits to general practitioners within the Tongren Hospital network (the sole provider of general practice to the population of 700,000). Data from all general practice consultations for adults were collected for the first 6 months of 2020, which included a 60-day lockdown period (January 24-March 24, 2020) and compared to corresponding data from the first 6 months of 2019. We evaluated changes to the numbers and patterns of primary care consultations, including subgroup analysis based on age, sex, and primary diagnosis. Results: A substantial reduction in patient visits, associated with increased median age, was observed during the first wave of the pandemic in the first 6 months of 2020, compared to the same interval during 2019. Additionally, reduced reappointments and waiting times, but increased costs per visit were observed. When analyzed by primary disease diagnosis, patient visits were reduced for all the major systems. The most striking visit reductions were in cardiovascular, respiratory, endocrine, and gastrointestinal diseases. However, psychological disorders were increased following lockdown, but there was also a dramatic fall in consultations for depression. Reduced monthly patient numbers correlated with both rate of reappointment and average waiting time during the first 6 months of both 2019 and 2020, but an inverse correlation was observed between cost per visit and monthly patient numbers. Specifically during the lockdown period, there was ~50% reduced patient visits. Conclusions: The lockdown has had a serious impact on patients' physical and psychological health. Our analysis provides objective health-related data that may inform the current controversy concerning the balance between the detrimental effects of the use of lockdown vs. the use of a more targeted approach to eliminate viral transmission. These data may improve decision-making in medical practice, policy, and education.
Keywords: COVID-19; GP; demographic pattern; lockdown; primary care; psychological disorders.
Copyright © 2021 Xu, Fan, Ding, Feng, Tao, Zhou, Qian, Tao, Hambly and Bao.
Conflict of interest statement
The authors declare that the research was conducted in the absence of any commercial or financial relationships that could be construed as a potential conflict of interest.
Figures
Similar articles
-
The effect of COVID-19 pandemic and lockdown on consultation numbers, consultation reasons and performed services in primary care: results of a longitudinal observational study.BMC Fam Pract. 2021 Jun 23;22(1):125. doi: 10.1186/s12875-021-01471-3. BMC Fam Pract. 2021. PMID: 34162343 Free PMC article.
-
The future of telemedicine visits after COVID-19: perceptions of primary care pediatricians.Isr J Health Policy Res. 2020 Oct 20;9(1):53. doi: 10.1186/s13584-020-00414-0. Isr J Health Policy Res. 2020. PMID: 33081834 Free PMC article.
-
Impact of a prolonged COVID-19 lockdown on patterns of admission, mortality and performance indicators in a cardiovascular intensive care unit.Int J Qual Health Care. 2021 Mar 3;33(1):mzab029. doi: 10.1093/intqhc/mzab029. Int J Qual Health Care. 2021. PMID: 33620065 Free PMC article.
-
Suitability of Video Consultations During the COVID-19 Pandemic Lockdown: Cross-sectional Survey Among Norwegian General Practitioners.J Med Internet Res. 2021 Feb 8;23(2):e26433. doi: 10.2196/26433. J Med Internet Res. 2021. PMID: 33465037 Free PMC article.
-
Virtual outreach: a randomised controlled trial and economic evaluation of joint teleconferenced medical consultations.Health Technol Assess. 2004 Dec;8(50):1-106, iii-iv. doi: 10.3310/hta8500. Health Technol Assess. 2004. PMID: 15546515 Review.
Cited by
-
Satisfaction of primary care physicians towards initiation of phone consultations during the COVID-19 pandemic management in Qatar: a cross-sectional study.BMC Prim Care. 2022 Mar 12;23(1):44. doi: 10.1186/s12875-022-01654-6. BMC Prim Care. 2022. PMID: 35279085 Free PMC article.
-
Impact of the COVID-19 pandemic on diagnosis of respiratory diseases in the Northern Metropolitan Area in Barcelona (Spain).Med Clin (Barc). 2023 May 12;160(9):392-396. doi: 10.1016/j.medcli.2022.11.021. Epub 2023 Jan 23. Med Clin (Barc). 2023. PMID: 36822982 Free PMC article.
-
[Current situation of rare diseases in Bogotá: Notification to Sivigila from 2019 to 2022].Rev Salud Publica (Bogota). 2023 Jul 1;25(4):107594. doi: 10.15446/rsap.V25n4.107594. eCollection 2023 Aug. Rev Salud Publica (Bogota). 2023. PMID: 40098659 Free PMC article. Spanish.
-
At the edge of chaos: a prospective multiple case study in Australian general practices adapting to COVID-19.BMJ Open. 2023 Jan 18;13(1):e064266. doi: 10.1136/bmjopen-2022-064266. BMJ Open. 2023. PMID: 36657761 Free PMC article.
-
Changes in inpatient admissions before and during COVID-19 outbreak in a large tertiary hospital in Shanghai.Ann Transl Med. 2022 Apr;10(8):469. doi: 10.21037/atm-22-1594. Ann Transl Med. 2022. PMID: 35571407 Free PMC article.
References
-
- WHO . WHO Coronavirus Disease (COVID-19) Dashboard. Available online at: https://covid19.who.int/ (accessed January 21, 2021).
-
- SHTJJ . Statistical Communique of Shanghai City on National Economic and Social Development in 2019. Available online at: http://www.tjcn.org/tjgb/09sh/36201_6.html (accessed March 10, 2020).
-
- Chinanews . Available online at: http://www.chinanews.com/cj/2020/01-21/9066648.shtml; http://sh.sina.com.cn/news/m/2020-04-06/detail-iimxyqwa5269260.shtml (accessed January 21, 2020).
LinkOut - more resources
Full Text Sources
Other Literature Sources