. 2021 Mar 25:8:650757.
doi: 10.3389/fmolb.2021.650757. eCollection 2021.

Modeling Microtubule Counterion Distributions and Conductivity Using the Poisson-Boltzmann Equation

Affiliations

Modeling Microtubule Counterion Distributions and Conductivity Using the Poisson-Boltzmann Equation

Boden B Eakins et al. Front Mol Biosci. .

Abstract

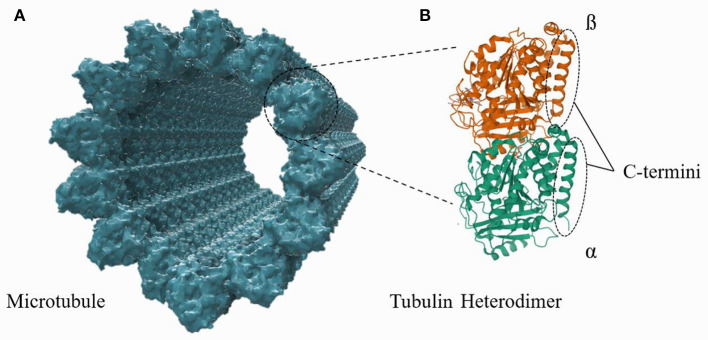
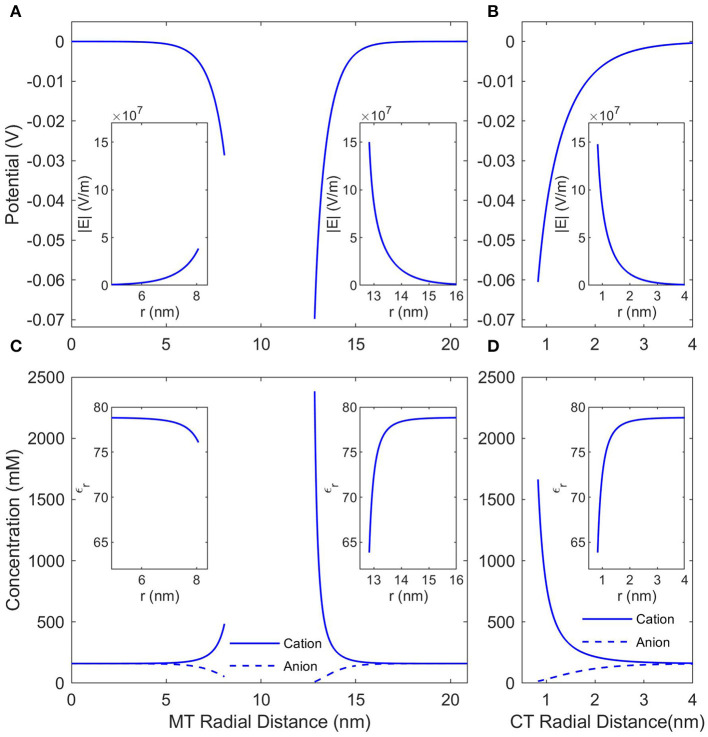
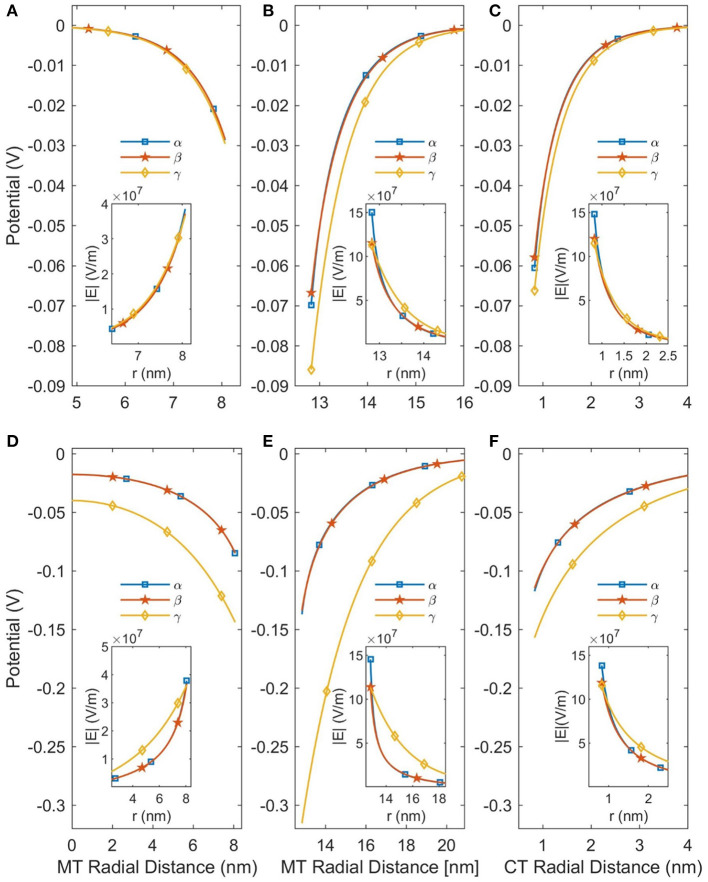
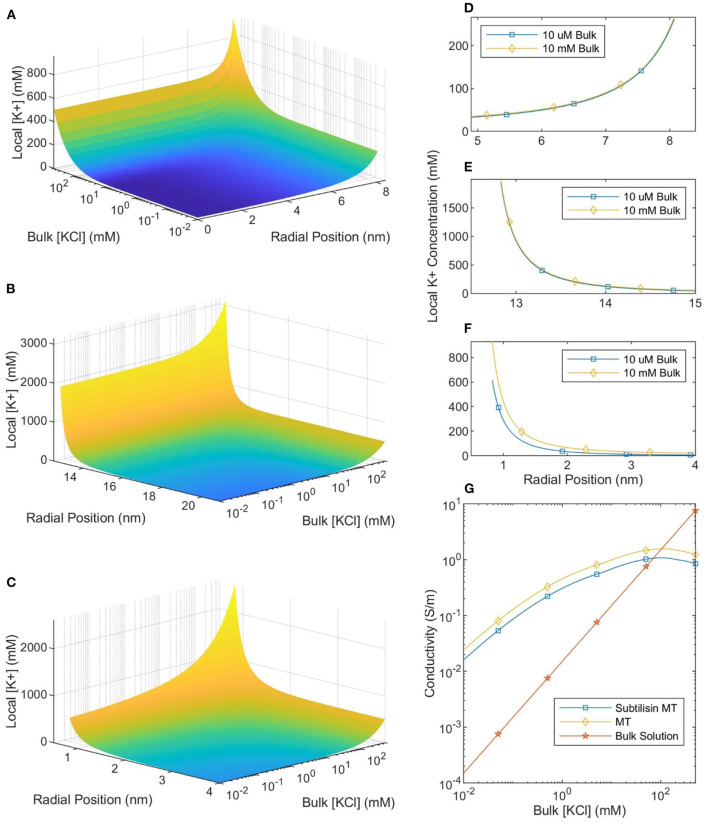
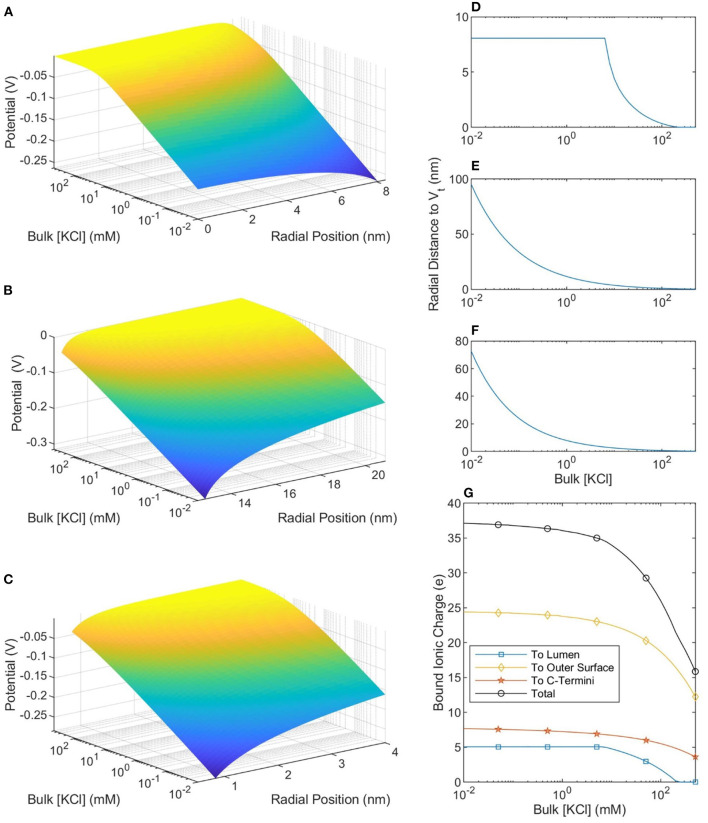
Microtubules are highly negatively charged proteins which have been shown to behave as bio-nanowires capable of conducting ionic currents. The electrical characteristics of microtubules are highly complicated and have been the subject of previous work; however, the impact of the ionic concentration of the buffer solution on microtubule electrical properties has often been overlooked. In this work we use the non-linear Poisson Boltzmann equation, modified to account for a variable permittivity and a Stern Layer, to calculate counterion concentration profiles as a function of the ionic concentration of the buffer. We find that for low-concentration buffers ([KCl] from 10 μM to 10 mM) the counterion concentration is largely independent of the buffer's ionic concentration, but for physiological-concentration buffers ([KCl] from 100 to 500 mM) the counterion concentration varies dramatically with changes in the buffer's ionic concentration. We then calculate the conductivity of microtubule-counterion complexes, which are found to be more conductive than the buffer when the buffer's ionic concentrations is less than ≈100 mM and less conductive otherwise. These results demonstrate the importance of accounting for the ionic concentration of the buffer when analyzing microtubule electrical properties both under laboratory and physiological conditions. We conclude by calculating the basic electrical parameters of microtubules over a range of ionic buffer concentrations applicable to nanodevice and medical applications.

Keywords: COMSOL; Poisson-Boltzmann; bio-electricity; conductivity; counter-ions; cytoskeleton; microtubules.


Conflict of interest statement

The authors declare that this study received funding from Novocure Inc. The funder was not involved in the study design, collection, analysis, interpretation of data, the writing of this article or the decision to submit it for publication.

Figures

Figure 1
Figure 1
A structural representation of an MT, composed of tubulin heterodimer subunits, is shown in (A). The structure of an individual tubulin heterodimer is shown in (B). This schematic is not to the correct scale and conformation (see Supplementary Material), but the illustration highlights that the c-termini lie on and protrude outward from the outer MT wall.
Figure 2
Figure 2
The counterionic concentrations and electrostatic potentials surrounding a microtubule when the buffer ionic concentration is 160 mM KCl. (A) Shows the potential profile near the inner and outer surfaces of an SMT; the radial distance is measured from the center of the microtubule, and the insets show the electric field strength as a function of the same radial distance. (B) Shows the potential profile near a single, isolated CT; the radial distance is measured from the center of the CT, and the inset shows the electric field strength as a function of the same radial distance. (C,D) Show the concentrations of anions and cations and the insets show the relative permittivity. The radial distances in (C,D) are the same as in (A,B), respectively.
Figure 3
Figure 3
This figure demonstrates the effects of linearizing the PB equation and accounting for a variable permittivity. The curves labeled α are the predictions of the NLPB equation with a variable relative permittivity; the β curves are the NLPB equation with a constant relative permittivity; and the γ curves are the LPB equation with a constant relative permittivity. (A–C) Are for SMTs in a background ionic concentration of 160 mM KCl, while (D–F) are for a background ionic concentration of 10 mM. The SMT radial distance is the distance from the center of an SMT and the CT radial distance is the distance from the center of a CT.
Figure 4
Figure 4
The local counterionic concentration—as a function of buffer ionic concentration—in the lumen (A), around the outer SMT surface (B), and around a CT (C). The radial position in (A,B) is measured from the center of the SMT while the radial position in (C) is measured from the center of the CT. (D–F) Show the similarity of the counterionic concentration profiles—near the lumen, outer SMT surface, and CT surface, respectively—for MTs in 10 μM and 10 mM ionic buffer solutions. (G) Shows the conductivity of the bulk solution, an SMT-ion complex, and an MT-ion complex as a function of bulk solution ionic concentration.
Figure 5
Figure 5
The potential profiles—as a function of buffer ionic concentration—in the lumen (A), around the outer SMT surface (B), and around a CT (C). The radial position in (A,B) is measured from the center of the SMT while the radial position in (C) is measured from the center of the CT. (D–F) Show, respectively, the distance from the lumen, outer SMT surface, and CT surface to the thermal voltage. The maximum value in (D) is the radius of the lumen and at these points the entire lumen has a potential greater than the thermal potential. (G) Shows the total ionic charge within the thermal voltage potential, which can be considered the charge “bound” to the microtubule.

References

    1. Andersen O. (2013). Cellular electrolyte metabolism. Encyclop. Metalloprot. 580–587. 10.1007/978-1-4614-1533-6_223 - DOI
    1. Cantero M. d. R., Perez P. L., Scarinci N., Cantiello H. F. (2019). Two-dimensional brain microtubule structures behave as memristive devices. Sci. Rep. 9:12398. 10.1038/s41598-019-48677-1 - DOI - PMC - PubMed
    1. Cantero M. d. R., Villa Etchegoyen C., Perez P. L., Scarinci N., Cantiello H. F. (2018). Bundles of brain microtubules generate electrical oscillations. Sci. Rep. 8:11899. 10.1038/s41598-018-30453-2 - DOI - PMC - PubMed
    1. Cherstvy A. G., Winkler R. (2012). Polyelectrolyte adsorption onto oppositely charged interfaces: image-charge repulsion and surface curvature. J. Phys. Chem. B 116, 9838–9845. 10.1021/jp304980e - DOI - PubMed
    1. Chu V. B., Bai Y., Lipfert J., Herschlag D., Doniach S. (2007). Evaluation of ion binding to DNA duplexes using a size-modified Poisson-Boltzmann theory. Biophys. J. 93, 3202–3209. 10.1529/biophysj.106.099168 - DOI - PMC - PubMed

LinkOut - more resources