

Identification of hub genes and compounds controlling ovarian cancer stem cell characteristics via stemness indices analysis
- PMID: 33842600
- PMCID: PMC8033320
- DOI: 10.21037/atm-20-3621
Identification of hub genes and compounds controlling ovarian cancer stem cell characteristics via stemness indices analysis
Abstract
Background: Ovarian cancer (OC) is the most lethal gynecological malignancy. It has been reported that cancer stem cells (CSCs) play a crucial role in disseminated metastases in abdominal cavity and chemotherapy resistance of high-grade serous OC. However, the overall gene expression features of OC stem cells have not been clarified.
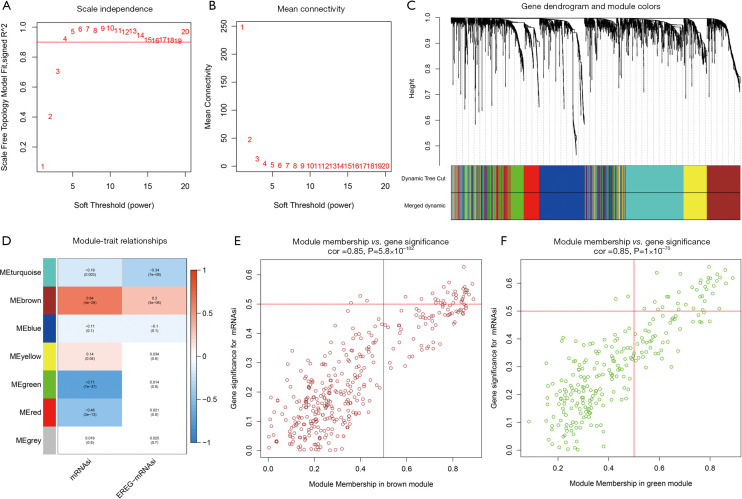
Methods: Expression datasets of 379 OC samples and 88 normal tissues were downloaded from The Cancer Genome Atlas (TCGA) and the Genotype Tissue Expression (GTEx) project. Differentially expressed genes (DEGs) were screened using the "limma" package in R software. Among the DEGs, modules and hub genes that were highly related to messenger RNA expression-based stemness index (mRNAsi) and epigenetically regulated mRNAsi indices were identified via weighted gene co-expression network analysis (WGCNA). These hub genes were considered to be associated with OC stem cells. The Gene Ontology (GO) project and the Kyoto Encyclopedia of Genes and Genomes (KEGG) pathway enrichment analysis was used to identify the main biological processes that hub genes participated in. Finally, Connectivity Map (CMap) was used to predict compounds that disturb the hub genes.
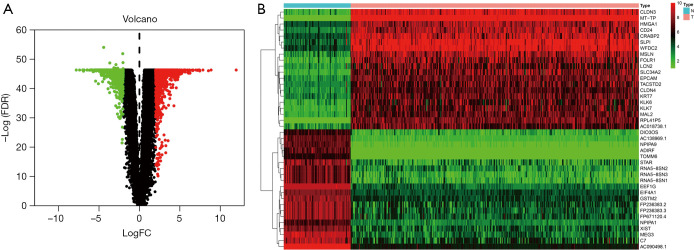
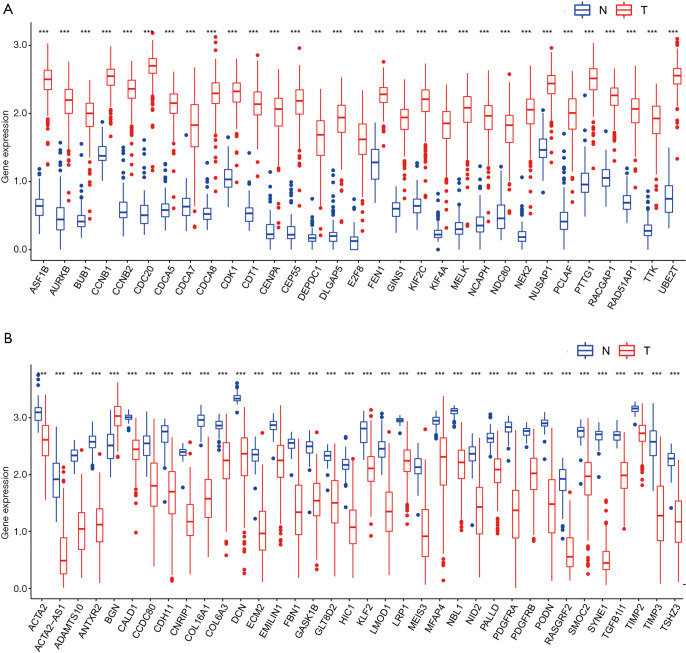
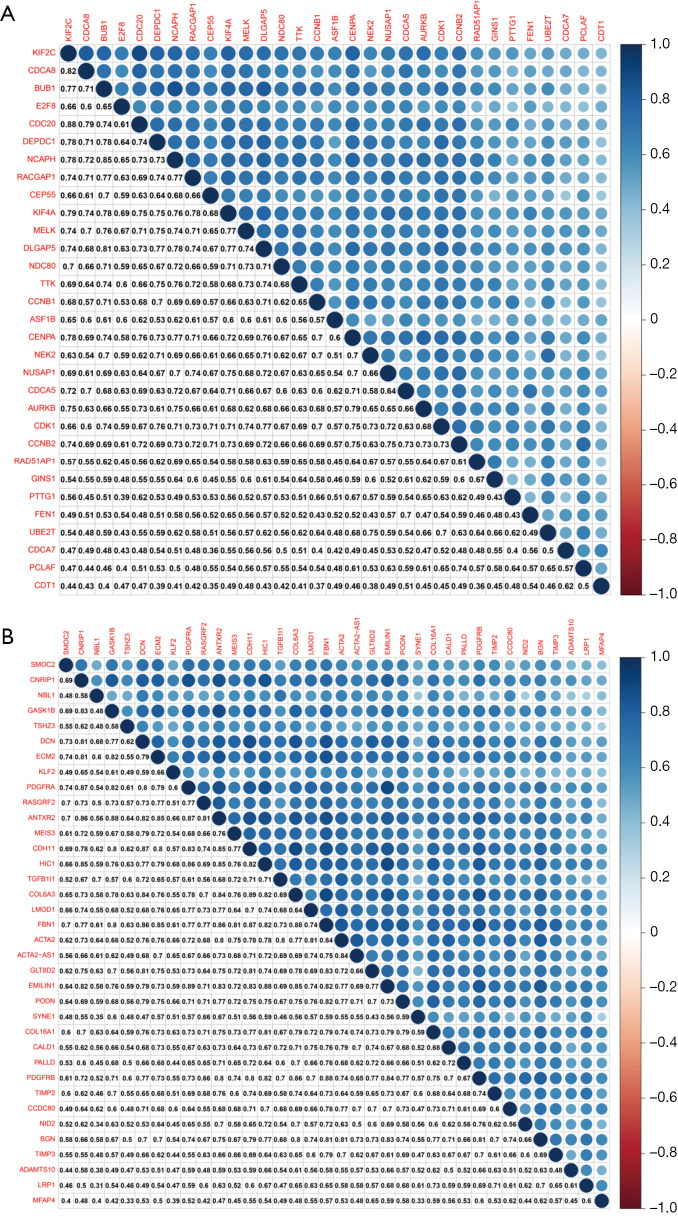
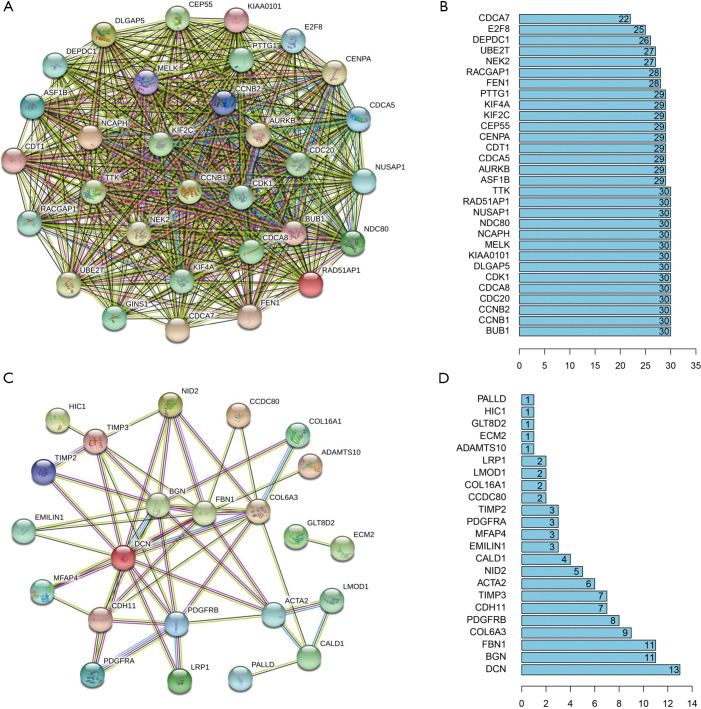
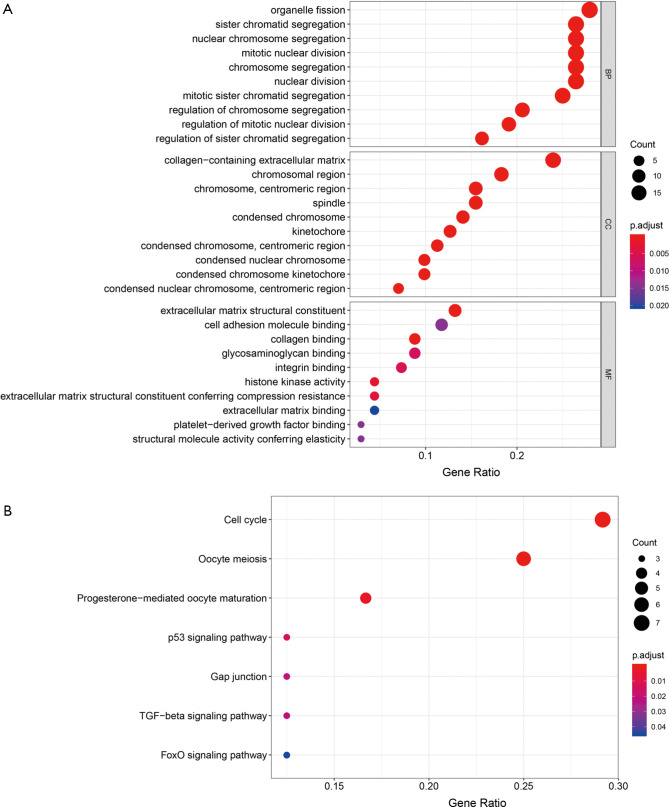
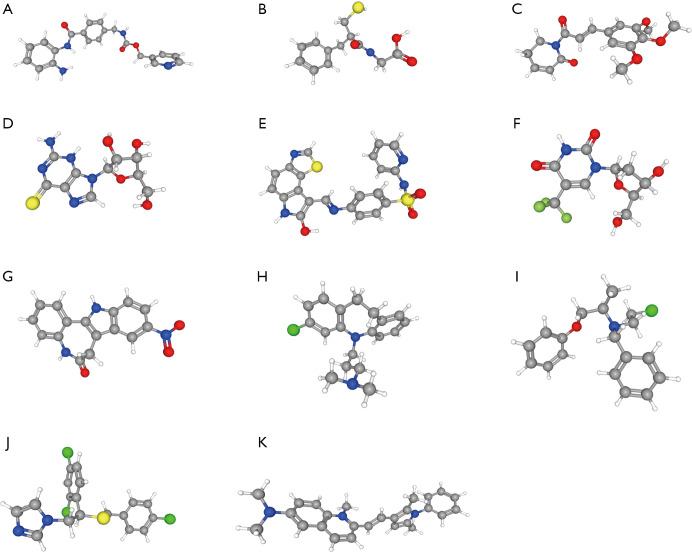
Results: We identified 2,253 DEGs; of these, 31 had a significantly positive correlation to mRNAsi indices and were upregulated in OC, while 41 of them had a significantly negative correlation with mRNAsi indices and were downregulated in OC. Correlation analysis indicated that hub genes from the same module composed a dense interaction network. GO and KEGG enrichment analysis demonstrated that hub genes primarily play roles in cell division and proliferation. Moreover, the compounds that may disturb hub genes were identified. Of these, 11 compounds, including MS-275, DL-thiorphan, and GW-8510, which have never been studied in OC stem cells, were screened as underlying treatments targeting OC stem cells.
Conclusions: Altogether, 72 hub genes that were closely linked to OC stem cell characteristics were found to mainly participate in cell division and proliferation. Moreover, compounds that disturb these hub gens were identified and can be considered underlying targets for inhibiting OC stem cells.
Keywords: Ovarian cancer (OC); cancer cell stemness; connectivity map (CMap); mRNAsi; weighted gene co-expression network analysis (WGCNA).
2021 Annals of Translational Medicine. All rights reserved.
Conflict of interest statement
Conflicts of Interest: All authors have completed the ICMJE uniform disclosure form (available at http://dx.doi.org/10.21037/atm-20-3621). The authors have no conflicts of interest to declare.
Figures
Similar articles
-
Identification of Glioma Cancer Stem Cell Characteristics Based on Weighted Gene Prognosis Module Co-Expression Network Analysis of Transcriptome Data Stemness Indices.J Mol Neurosci. 2020 Oct;70(10):1512-1520. doi: 10.1007/s12031-020-01590-z. Epub 2020 May 26. J Mol Neurosci. 2020. PMID: 32451841
-
Immunological Value of Prognostic Signature Based on Cancer Stem Cell Characteristics in Hepatocellular Carcinoma.Front Cell Dev Biol. 2021 Aug 2;9:710207. doi: 10.3389/fcell.2021.710207. eCollection 2021. Front Cell Dev Biol. 2021. PMID: 34409040 Free PMC article.
-
Integrated bioinformatics analysis for the screening of hub genes and therapeutic drugs in ovarian cancer.J Ovarian Res. 2020 Jan 27;13(1):10. doi: 10.1186/s13048-020-0613-2. J Ovarian Res. 2020. PMID: 31987036 Free PMC article.
-
Identification of stemness index-related long noncoding RNA SNHG12 in human bladder cancer based on WGCNA.Mol Cell Probes. 2022 Dec;66:101867. doi: 10.1016/j.mcp.2022.101867. Epub 2022 Sep 29. Mol Cell Probes. 2022. PMID: 36183925
-
Identification of key genes controlling breast cancer stem cell characteristics via stemness indices analysis.J Transl Med. 2020 Feb 12;18(1):74. doi: 10.1186/s12967-020-02260-9. J Transl Med. 2020. PMID: 32050983 Free PMC article.
Cited by
-
Ferroptosis-Related Genes in Lung Adenocarcinoma: Prognostic Signature and Immune, Drug Resistance, Mutation Analysis.Front Genet. 2021 Aug 9;12:672904. doi: 10.3389/fgene.2021.672904. eCollection 2021. Front Genet. 2021. PMID: 34434214 Free PMC article.
-
Development and verification of a 7-lncRNA prognostic model based on tumor immunity for patients with ovarian cancer.J Ovarian Res. 2023 Feb 4;16(1):31. doi: 10.1186/s13048-023-01099-0. J Ovarian Res. 2023. PMID: 36739404 Free PMC article.
-
The Value of the Stemness Index in Ovarian Cancer Prognosis.Genes (Basel). 2022 May 31;13(6):993. doi: 10.3390/genes13060993. Genes (Basel). 2022. PMID: 35741755 Free PMC article.
-
Development and Validation of a Novel Stemness-Index-Related Long Noncoding RNA Signature for Breast Cancer Based on Weighted Gene Co-Expression Network Analysis.Front Genet. 2022 Feb 22;13:760514. doi: 10.3389/fgene.2022.760514. eCollection 2022. Front Genet. 2022. PMID: 35273635 Free PMC article.
References
LinkOut - more resources
Full Text Sources
Other Literature Sources