. 2021 Apr 20;2(4):100253.
doi: 10.1016/j.xcrm.2021.100253. Epub 2021 Apr 5.

Rapid decline of neutralizing antibodies is associated with decay of IgM in adults recovered from mild COVID-19

Affiliations

Rapid decline of neutralizing antibodies is associated with decay of IgM in adults recovered from mild COVID-19

Whitney E Harrington et al. Cell Rep Med. .

Abstract

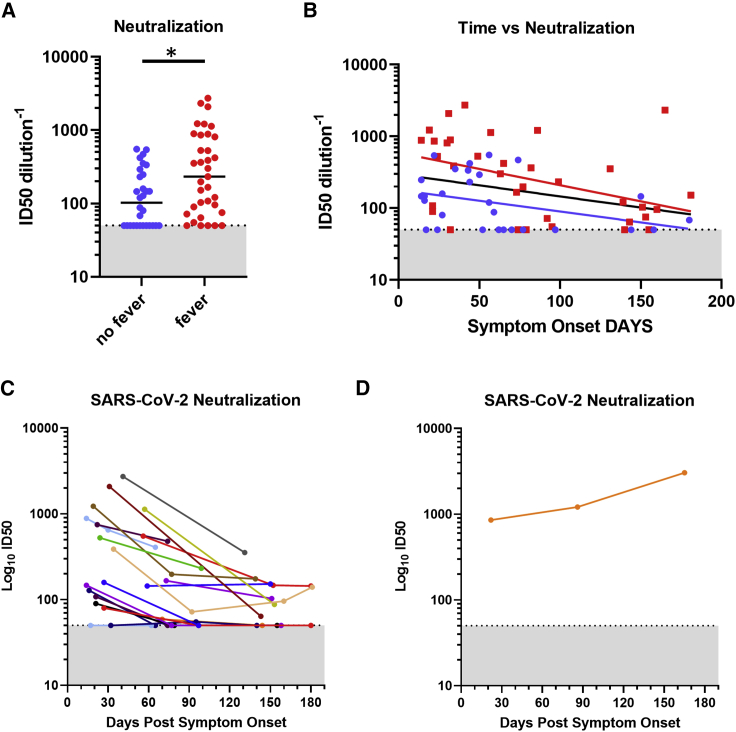
The fate of protective immunity following mild severe acute respiratory syndrome-coronavirus-2 (SARS-CoV-2) infection remains ill defined. Here, we characterize antibody responses in a cohort of participants recovered from mild SARS-CoV-2 infection with follow-up to 6 months. We measure immunoglobulin A (IgA), IgM, and IgG binding and avidity to viral antigens and assess neutralizing antibody responses over time. Furthermore, we correlate the effect of fever, gender, age, and time since symptom onset with antibody responses. We observe that total anti-S trimer, anti-receptor-binding domain (RBD), and anti-nucleocapsid protein (NP) IgG are relatively stable over 6 months of follow-up, that anti-S and anti-RBD avidity increases over time, and that fever is associated with higher levels of antibodies. However, neutralizing antibody responses rapidly decay and are strongly associated with declines in IgM levels. Thus, while total antibody against SARS-CoV-2 may persist, functional antibody, particularly IgM, is rapidly lost. These observations have implications for the duration of protective immunity following mild SARS-CoV-2 infection.

Keywords: COVID-19; IgG; IgM; SARS-CoV-2; antibody avidity; mild infection; neutralizing antibodies.


Conflict of interest statement

The authors declare no competing interests.

Figures

None
Graphical abstract
Figure 1
Figure 1
Comparison of IgG responses to SARS-CoV-2 antigens in recovered participants after COVID-19 with versus without fever Plasma IgG titers were determined for S, RBD, and NP at all available time points. Lines represent linear regression best-fit lines. Each point represents the average value from 2 replicate assays, each containing 2 technical replicates. Black lines: all participants, blue dots/lines: participants without fever, red dots/lines: participants with fever. Dotted lines: 95% confidence band. (A) Participants with fever developed higher IgG titers against all 3 antigens (anti-S delta: 0.46, p < 0.001, anti-RBD IgG delta: 0.48, p = 0.002, and anti-NP IgG delta: 0.82, p < 0.001). (B) Correlations between anti-S, anti-RBD, and anti-NP titers including data from all time points. NP titers were higher at the early time point, relative to S trimer (delta: 0.34, p = 0.02) or RBD (delta: 0.43, p = 0.004). (C–E) Decay rates for IgG over time by fever status. Anti-S trimer IgG did not decay over time (delta per month: -0.02, p = 0.5). Anti-RBD IgG slowly decayed over time (delta per month: −0.04, p = 0.07), whereas anti-NP IgG significantly decayed over time (delta per month: −0.15, p < 0.001). In addition, those with fever had a faster rate of decay for anti-RBD and anti-NP IgG despite having higher titers at the early time points, such that by 6 months, antibody titers were similar between those with and without fever for all 3 antigens.
Figure 2
Figure 2
Assessment of neutralizing antibodies after infection Neutralizing titers were measured at all time points using a pseudovirus neutralization assay. Lines represent linear regression best-fit lines. Each point represents the ID50, or the concentration of plasma that achieves 50% neutralization, which is the average from 2 replicate assays, each containing 2 technical replicates. Black lines: all participants, blue dots/lines: participants without fever, red dots/lines: participants with fever. (A) Participants with fever had higher neutralizing antibody titers including data from all time points (delta: 0.36, p = 0.01). (B) Neutralizing titers declined over time (delta per month: −0.10, p = 0.001), and the rate of decay was not modified by fever. (C) Neutralizing titers by participant, with most participants demonstrating a rapid loss of neutralizing titers over time. (D) ID50 titers for the only participant in the study who showed increased neutralization over time.
Figure 3
Figure 3
Anti-S avidity increases over time S and RBD avidity measured in a chaotrope-modified ELISA. Each point represents the average value from 2 replicate assays, each containing 2 technical replicates. Lines represent linear regression best fit lines. Black lines: all participants,blue dots/lines: participants without fever, red dots/ lines: participants with fever. Dotted lines: 95% confidence band. (A and B) S avidity over time (A) and RBD avidity over time (B). Considering all time points, those with fever had higher S avidity (delta: 0.09, p = 0.04) and a trend toward higher RBD avidity (delta: 0.06, p = 0.1). Those without fever had a faster rate of increase in RBD avidity, however, by 6 months those with and without fever had similar avidity for both antigens. (C and D) Considering all time points, (C) S avidity (R2 = −0.18, p = 0.2) and (D) RBD avidity (R2 = −0.07, p = 0.5) did not predict neutralization titers.
Figure 4
Figure 4
Plasma S trimer IgM and IgA are associated with fever and decrease over time, and IgM strongly correlates with neutralization Plasma S trimer IgM and IgA were measured at all available time points. Each point represents the average value from 2 replicate assays, each containing 2 technical replicates. Lines represent linear regression best-fit lines. Black lines: all participants, blue dots/lines: participants without fever, red dots/lines: participants with fever. Dotted lines: 95% confidence band. (A) Both IgM (delta: 0.28, p = 0.02) and IgA (delta: 0.20, p = 0.05) were higher in those with fever than those without fever. (B) S trimer IgM rapidly declined over time (delta per month:−0.11, p < 0.001). (C) S trimer IgA declined slowly over time (delta per month: −0.08, p < 0.001). (D–F) Association between S trimer IgM, IgA, and IgG and ID50 (adjusted effects: IgM delta per log increase: 0.71, p < 0.001; IgA delta per log increase: 0.28, p < 0.001; IgG delta per log increase: 0.19, p = 0.02).

References

    1. Dong E., Du H., Gardner L. An interactive web-based dashboard to track COVID-19 in real time. Lancet Infect. Dis. 2020;20:533–534. - PMC - PubMed
    1. Amanat F., Krammer F. SARS-CoV-2 Vaccines: Status Report. Immunity. 2020;52:583–589. - PMC - PubMed
    1. Fafi-Kremer S., Bruel T., Madec Y., Grant R., Tondeur L., Grzelak L., Staropoli I., Anna F., Souque P., Fernandes-Pellerin S. Serologic responses to SARS-CoV-2 infection among hospital staff with mild disease in eastern France. EBioMedicine. 2020;59:102915. - PMC - PubMed
    1. Guo L., Ren L., Yang S., Xiao M., Chang D., Yang F., Dela Cruz C.S., Wang Y., Wu C., Xiao Y. Profiling Early Humoral Response to Diagnose Novel Coronavirus Disease (COVID-19) Clin. Infect. Dis. 2020;71:778–785. - PMC - PubMed
    1. To K.K.-W., Tsang O.T.-Y., Leung W.-S., Tam A.R., Wu T.-C., Lung D.C., Yip C.C.-Y., Cai J.-P., Chan J.M.-C., Chik T.S.-H. Temporal profiles of viral load in posterior oropharyngeal saliva samples and serum antibody responses during infection by SARS-CoV-2: an observational cohort study. Lancet Infect. Dis. 2020;20:565–574. - PMC - PubMed

Publication types

MeSH terms