

Urinary biomarkers indicative of recovery from spinal cord injury: A pilot study
- PMID: 33842921
- PMCID: PMC8020035
- DOI: 10.1016/j.ibneur.2021.02.007
Urinary biomarkers indicative of recovery from spinal cord injury: A pilot study
Abstract
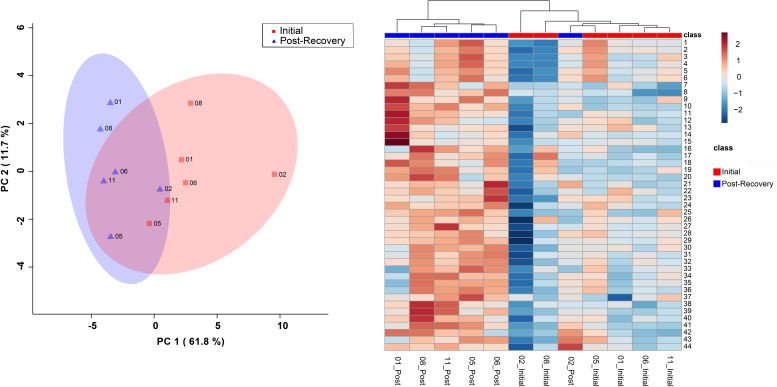
Current assessments of recovery following spinal cord injury (SCI) focus on clinical outcome measures. These assessments bear an inherent risk of bias, emphasizing the need for more reliable prognostic biomarkers to measure SCI severity. This study evaluated fluid biomarkers as an objective tool to aid with prognosticating outcomes following SCI. Using a 1H nuclear magnetic resonance (NMR)-based quantitative metabolomics approach of urine samples, the objectives were to determine (a) if alterations in metabolic profiles reflect the extent of recovery of individual SCI patients, (b) whether changes in urine metabolites correlate to patient outcomes, and (c) whether biological pathway analysis reflects mechanisms of neural damage and repair. An inception cohort exploratory pilot study collected morning urine samples from male SCI patients (n=6) following injury and again at 6-months post-injury. A 700 MHz Bruker Avance III HD NMR spectrometer was used to acquire the metabolic signatures of urine samples, which were used to derive metabolic pathways. Multivariate statistical analyses were used to identify changes in metabolic signatures, which were correlated to clinical outcomes in the Spinal Cord Independence Measure (SCIM). Among SCI-induced metabolic changes, biomarkers which significantly correlated to patient SCIM scores included caffeine (R = -0.76, p < 0.01), 3-hydroxymandelic acid (R= -0.85, p < 0.001), L-valine (R = 0.90, p < 0.001; R = -0.64, p < 0.05), and N-methylhydantoin (R = -0.90, p < 0.001). The most affected pathway was purine metabolism. These findings indicate that urinary metabolites reflect SCI lesion severity and recovery and provide potentially prognostic biomarkers of SCI outcome in precision medicine approaches.
Keywords: 1H NMR spectroscopy; Biomarkers; Functional recovery; Metabolomics; Neurorehabilitation; Spinal cord injury; Urine.
© 2021 The Authors.
Figures


Similar articles
-
Identification of Serum Metabolites as Prognostic Biomarkers Following Spinal Cord Injury: A Pilot Study.Metabolites. 2023 Apr 28;13(5):605. doi: 10.3390/metabo13050605. Metabolites. 2023. PMID: 37233646 Free PMC article.
-
Urinary metabolomic signatures as indicators of injury severity following traumatic brain injury: A pilot study.IBRO Neurosci Rep. 2021 Oct 27;11:200-206. doi: 10.1016/j.ibneur.2021.10.003. eCollection 2021 Dec. IBRO Neurosci Rep. 2021. PMID: 34786572 Free PMC article.
-
Blood-Derived Metabolic Signatures as Biomarkers of Injury Severity in Traumatic Brain Injury: A Pilot Study.Metabolites. 2024 Feb 2;14(2):105. doi: 10.3390/metabo14020105. Metabolites. 2024. PMID: 38392997 Free PMC article.
-
Dynamics of biomarkers across the stages of traumatic spinal cord injury - implications for neural plasticity and repair.Restor Neurol Neurosci. 2021;39(5):339-366. doi: 10.3233/RNN-211169. Restor Neurol Neurosci. 2021. PMID: 34657853 Review.
-
Biomarkers in Spinal Cord Injury: from Prognosis to Treatment.Mol Neurobiol. 2018 Aug;55(8):6436-6448. doi: 10.1007/s12035-017-0858-y. Epub 2018 Jan 6. Mol Neurobiol. 2018. PMID: 29307082 Review.
Cited by
-
Identification of Serum Metabolites as Prognostic Biomarkers Following Spinal Cord Injury: A Pilot Study.Metabolites. 2023 Apr 28;13(5):605. doi: 10.3390/metabo13050605. Metabolites. 2023. PMID: 37233646 Free PMC article.
-
The Utility of Metabolomics in Spinal Cord Injury: Opportunities for Biomarker Discovery and Neuroprotection.Int J Mol Sci. 2025 Jul 17;26(14):6864. doi: 10.3390/ijms26146864. Int J Mol Sci. 2025. PMID: 40725110 Free PMC article. Review.
-
Psychological and physiological differences related to supportive living situations amongst individuals with physical disabilities.Sci Rep. 2025 Aug 15;15(1):29927. doi: 10.1038/s41598-025-15893-x. Sci Rep. 2025. PMID: 40817283 Free PMC article.
-
Urinary metabolomic signatures as indicators of injury severity following traumatic brain injury: A pilot study.IBRO Neurosci Rep. 2021 Oct 27;11:200-206. doi: 10.1016/j.ibneur.2021.10.003. eCollection 2021 Dec. IBRO Neurosci Rep. 2021. PMID: 34786572 Free PMC article.
-
Unraveling Metabolic Changes following Stroke: Insights from a Urinary Metabolomics Analysis.Metabolites. 2024 Feb 28;14(3):145. doi: 10.3390/metabo14030145. Metabolites. 2024. PMID: 38535305 Free PMC article.
References
-
- Anderson P., Mahle D., Doom T., Reo N., DelRaso N., Raymer M. Dynamic adaptive binning: an improved quantification technique for NMR spectroscopic data. Metabolomics. 2011;7(2):179–190.
-
- Bar N., Korem T., Weissbrod O., Zeevi D., Rothschild D., Leviatan S., Kosower N., Lotan-Pompan M., Weinberger A., Le Roy C.I., Menni C., Visconti A., Falchi M., Spector T.D., Adamski J., Franks P.W., Pedersen O., Segal E. A reference map of potential determinants for the human serum metabolome. Nature. 2020;588:135–140. doi: 10.1038/s41586-020-2896-2. - DOI - PubMed
-
- Baumann W., Spungen A. Metabolic changes in persons after spinal cord injury. Phys. Med. Rehab. Clin. N. Am. 2000;11(1):109–140. 〈https://pubmed.ncbi.nlm.nih.gov/10680161/〉 Accessed 16 January 2020. - PubMed
LinkOut - more resources
Full Text Sources
Other Literature Sources