. 2021 Apr 12:10:e62648.
doi: 10.7554/eLife.62648.

Distinct clonal evolution of B-cells in HIV controllers with neutralizing antibody breadth

Affiliations

Distinct clonal evolution of B-cells in HIV controllers with neutralizing antibody breadth

Deniz Cizmeci et al. Elife. .

Abstract

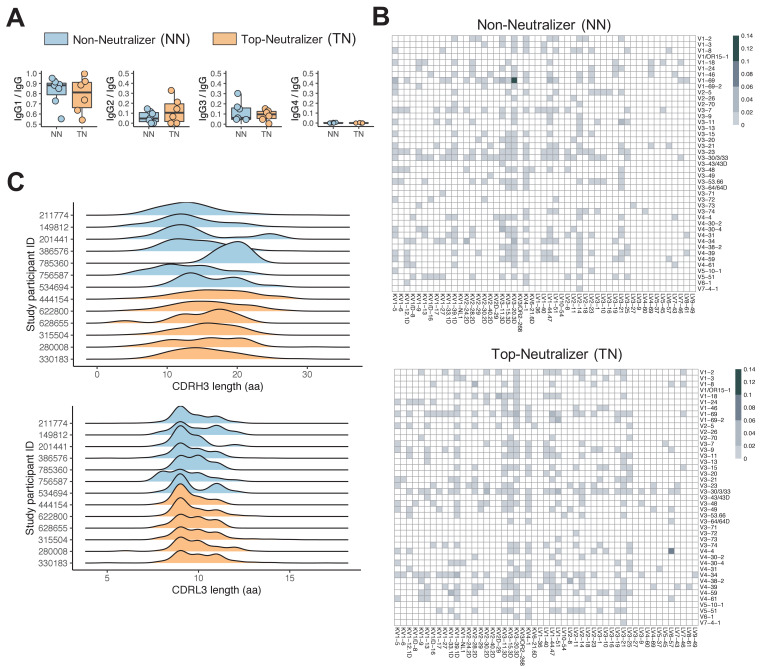
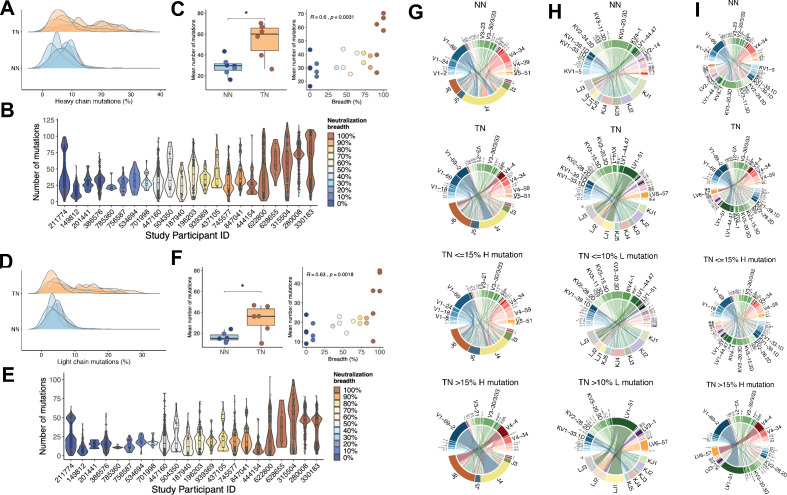
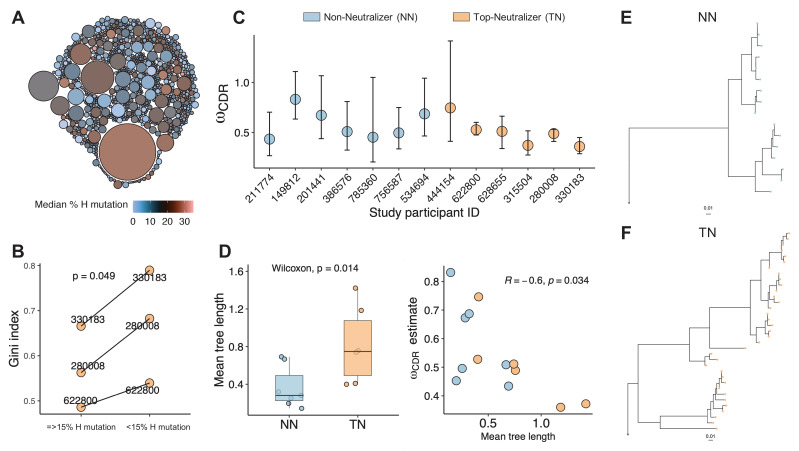
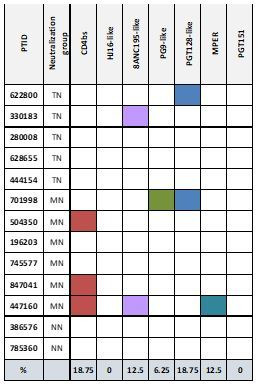
A minor subset of individuals infected with HIV-1 develop antibody neutralization breadth during the natural course of the infection, often linked to chronic, high-level viremia. Despite significant efforts, vaccination strategies have been unable to induce similar neutralization breadth and the mechanisms underlying neutralizing antibody induction remain largely elusive. Broadly neutralizing antibody responses can also be found in individuals who control HIV to low and even undetectable plasma levels in the absence of antiretroviral therapy, suggesting that high antigen exposure is not a strict requirement for neutralization breadth. We therefore performed an analysis of paired heavy and light chain B-cell receptor (BCR) repertoires in 12,591 HIV-1 envelope-specific single memory B-cells to determine alterations in the BCR immunoglobulin gene repertoire and B-cell clonal expansions that associate with neutralizing antibody breadth in 22 HIV controllers. We found that the frequency of genomic mutations in IGHV and IGLV was directly correlated with serum neutralization breadth. The repertoire of the most mutated antibodies was dominated by a small number of large clones with evolutionary signatures suggesting that these clones had reached peak affinity maturation. These data demonstrate that even in the setting of low plasma HIV antigenemia, similar to what a vaccine can potentially achieve, BCR selection for extended somatic hypermutation and clonal evolution can occur in some individuals suggesting that host-specific factors might be involved that could be targeted with future vaccine strategies.

Keywords: BCR repertoire; HIV infection; b-cell evolution; cell biology; human; infectious disease; microbiology; neutralizing antibodies.


Conflict of interest statement

DC, GL, ER, AD, MS, BJ No competing interests declared, DK, GC, NN employee of Atreca Inc, YT Former employee of Atreca Inc Now employee of Esco Ventures X. GA GA is a founder of Seromyx Systems.

Figures

Figure 1.
Figure 1.. Non-neutralizer (NN) and top-neutralizer (TN) memory B-cells (MBCs) B-cell receptor (BCR) repertoires.
(A) IgG subclass distribution in NNs and TNs. (B) The proportion of IGHV-IGLV gene combination in NN and TN individuals' usage was averaged and plotted in heatmaps representing the intensities of heavy and light chain paired V gene usage. (C) CDRH3 and CDRL3 length distribution (in aa) in NN and TN.
Figure 1—figure supplement 1.
Figure 1—figure supplement 1.. Non-neutralizer (NN) and top-neutralizer (TN) characteristics at time of sampling.
Figure 1—figure supplement 2.
Figure 1—figure supplement 2.. Gating strategy to identify and sort single envelope (Env)-specific memory B cells.
Figure 1—figure supplement 3.
Figure 1—figure supplement 3.. Non-neutralizer (NN) and top-neutralizer (TN) B-cell receptor (BCR) repertoires.
(A) The frequencies at which the IGH V/D/J and IGL V/J gene families are expressed by NN and TN memory B-cells (MBCs) are shown in pie charts as the average of percentages of gene sequences obtained in each individual. (B) The proportion of IGHV, IGHD, IGLV, IGLJ genes used per individual was plotted in a heatmap. Each row is annotated with the donor ID and the number of total sequences obtained from the individual. (C) The frequencies at which the paired IGH and IGL V/J gene families are expressed by NN and TN MBCs are shown. Per individual, proportions of each IGHV-IGHJ-IGLV-IGLV gene combination over the total number of sequences obtained from the individual were calculated. Then, these proportions are averaged in each NN and TN group separately. The total height of the plot reflects the cumulative quantity of the proportions. The height of each gene segment represents the proportion of usage. The thickness of flow lines reflects the proportion of gene combinations, NN sequences as blue lines, and TN sequences as orange lines.
Figure 2.
Figure 2.. Mutation characteristics of IGHV and IGLV genes and associations with neutralization breadth.
(A) The overall mutation frequencies in IGHV in top-neutralizers (TNs) versus non-neutralizers (NNs) are significantly different with mean number of mutations of 54 in TNs and 29 in NNs (unpaired t-test, p<0.05). (B) The number of mutations in IGHV for each of the 22 study participants is plotted and the serum neutralization breadth is color-coded ranging from blue (0% neutralization) to red (100% neutralization). (C) The mean frequency of mutations in IGHV correlates with the serum neutralization breadth in % (Spearman’s rho = 0.60, p<0.01). Similarly, for IGLV, the mean number of mutations differ (35 in TNs and 14 in NNs) (D) and correlates with the serum neutralization breadth in % (r = 0.63, p<0.01) (E and F). Circos plots summarize the combinations of V and J segments used in the rearranged IGH genes (G) and IGL genes (H) and V segment combinations of IGH and IGL (I) expressed by memory B-cells (MBCs). Top circos graphs demonstrate combinations expressed by NN MBCs and second row graphs demonstrate TN MBCs independent of the number of detected mutations. Third and fourth row circos graphs demonstrate gene combinations expressed by TN MBCs with low and high mutation rates. For each (G)/(H) plot, the bottom half depicts J genes and the top half depicts V genes. For (I) top half depicts IGHV and bottom half IGLV. To exclude potential bias caused by the number of input cells, the number of sequences in each repertoire signature was weighted by the total number of sequences and total number of unique clones in each individual (see 'Materials and methods'). The arc length of each segment denotes the normalized frequency at which each gene segment was identified. Rearrangement of a J gene with a V gene segment in a clonal immunoglobulin (Ig) sequence is represented by a ribbon (ribbons carry the color of the HV or LV family of the gene participating in the pairing). The width of the ribbons corresponds to the weighted frequency at which each particular HV-HJ or LV-LJ rearrangement was used in the respective MBC repertoire.
Figure 3.
Figure 3.. Clonality analysis.
A total number of 770 clones were obtained for top-neutralizers (TNs). (A) Each clone is represented as a circle. The sizes of the circles are scaled to the number of sequences in each clone (mean number of sequences 7.4); the colors represent mean number of mutations per clone. Dominant clones consist of highly mutated sequences. (B) Gini index (0 represents perfect equality and one perfect inequality) was calculated as an estimate of clonality for TNs for which a total of more than 600 sequences were obtained (subject IDs: 330183, 280008, 622800). Per each subject, sequences were divided into two sets as high mutated sequences (>60 mutations) and low mutated sequences (≤60 mutations). Each set of sequences were clustered into clones and Gini index was calculated. Gini Index is higher (paired t-test, p=0.04) in highly mutated sequence sets supporting the presence of fewer dominant clones. (C) Maximum likelihood point estimates of ω with 95% confidence intervals. (D) Estimates of mean tree length (total substitutions per codon within a lineage, averaged across all lineages within a repertoire) were compared between TN and non-neutralizer (NN) using Wilcoxon rank sum test (left graph). The correlation between ω and mean tree length calculated using Spearman’s correlation. Largest lineage trees in NNs (E) and TNs (F).
Author response image 1.

Similar articles

Cited by

References

    1. Angeletti D, Gibbs JS, Angel M, Kosik I, Hickman HD, Frank GM, Das SR, Wheatley AK, Prabhakaran M, Leggat DJ, McDermott AB, Yewdell JW. Defining B cell immunodominance to viruses. Nature Immunology. 2017;18:456–463. doi: 10.1038/ni.3680. - DOI - PMC - PubMed
    1. Breden F, Lepik C, Longo NS, Montero M, Lipsky PE, Scott JK. Comparison of antibody repertoires produced by HIV-1 infection, other chronic and acute infections, and systemic autoimmune disease. PLOS ONE. 2011;6:e16857. doi: 10.1371/journal.pone.0016857. - DOI - PMC - PubMed
    1. Burton DR, Hangartner L. Broadly neutralizing antibodies to HIV and their role in vaccine design. Annual Review of Immunology. 2016;34:635–659. doi: 10.1146/annurev-immunol-041015-055515. - DOI - PMC - PubMed
    1. CAPRISA002 Study Team. Gray ES, Madiga MC, Hermanus T, Moore PL, Wibmer CK, Tumba NL, Werner L, Mlisana K, Sibeko S, Williamson C, Abdool Karim SS, Morris L. The neutralization breadth of HIV-1 develops incrementally over four years and is associated with CD4+ T cell decline and high viral load during acute infection. Journal of Virology. 2011;85:4828–4840. doi: 10.1128/JVI.00198-11. - DOI - PMC - PubMed
    1. Clarke SH, Huppi K, Ruezinsky D, Staudt L, Gerhard W, Weigert M. Inter- and intraclonal diversity in the antibody response to influenza hemagglutinin. Journal of Experimental Medicine. 1985;161:687–704. doi: 10.1084/jem.161.4.687. - DOI - PMC - PubMed

Publication types

Substances