. 2021 Mar 26:(169):10.3791/62045.
doi: 10.3791/62045.

Serial Block-Face Scanning Electron Microscopy (SBF-SEM) of Biological Tissue Samples

Affiliations

Serial Block-Face Scanning Electron Microscopy (SBF-SEM) of Biological Tissue Samples

Justin A Courson et al. J Vis Exp. .

Abstract

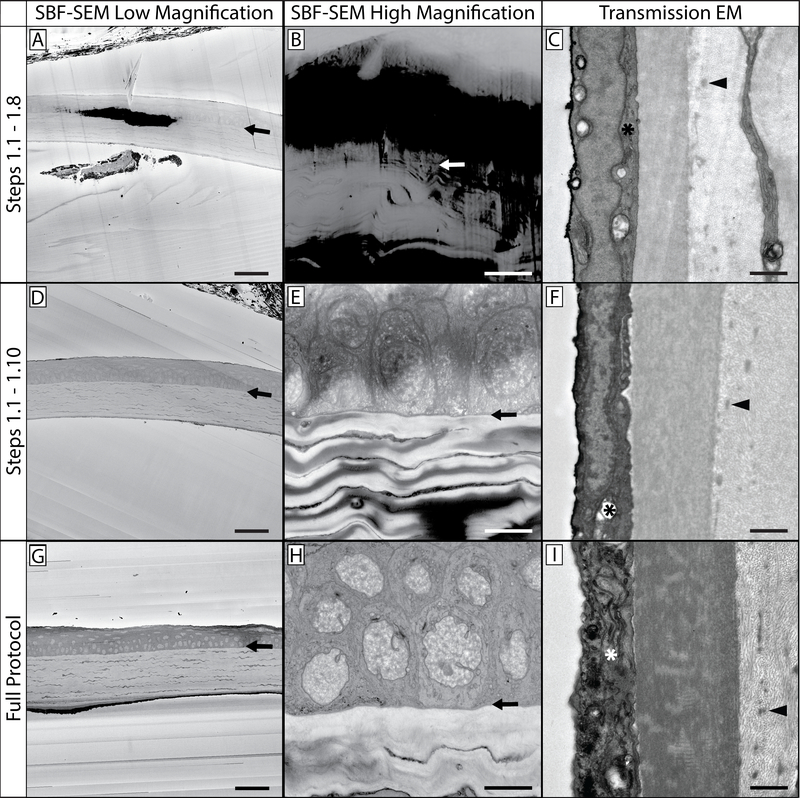
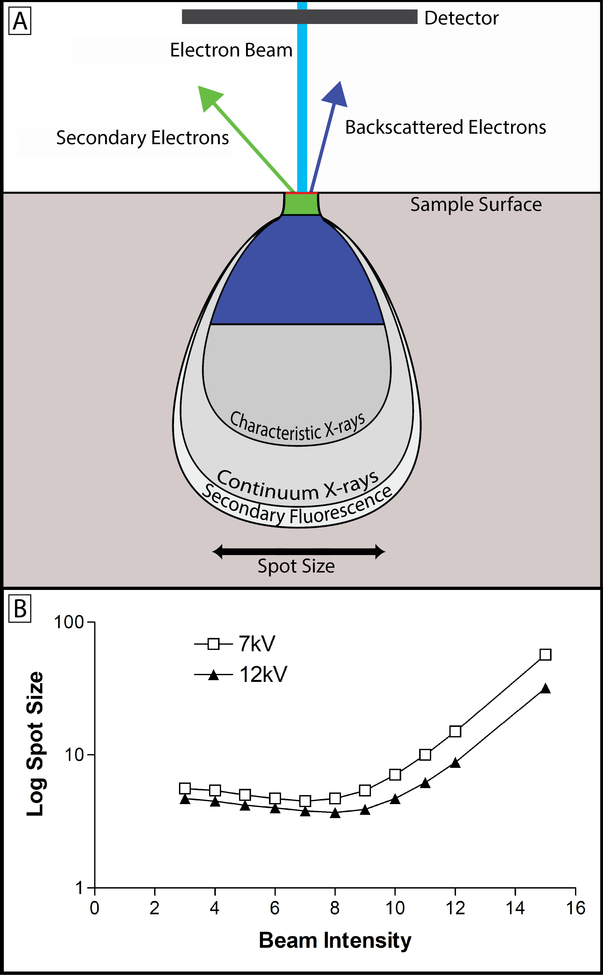
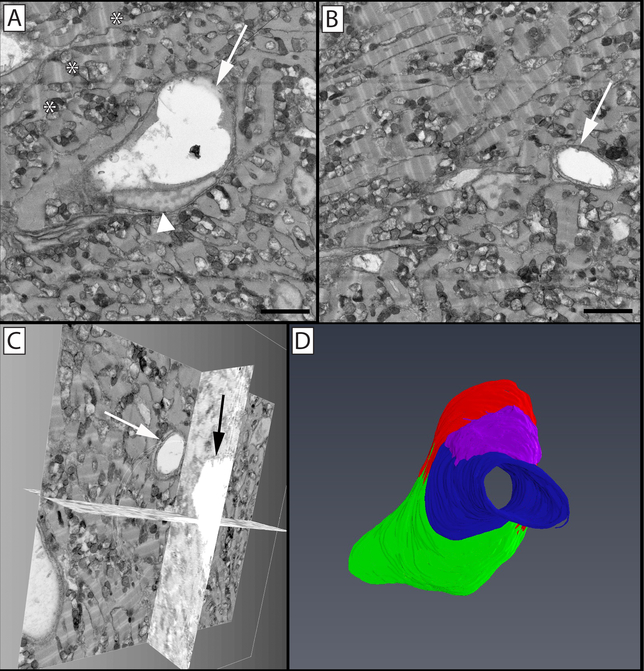
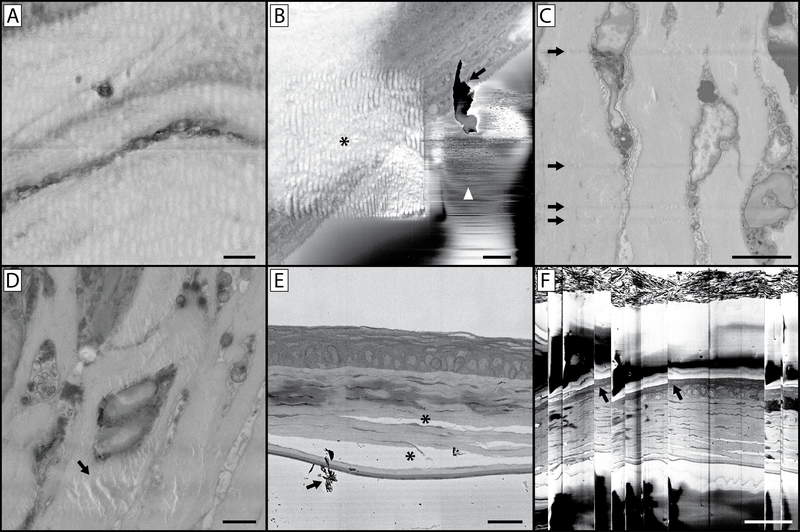
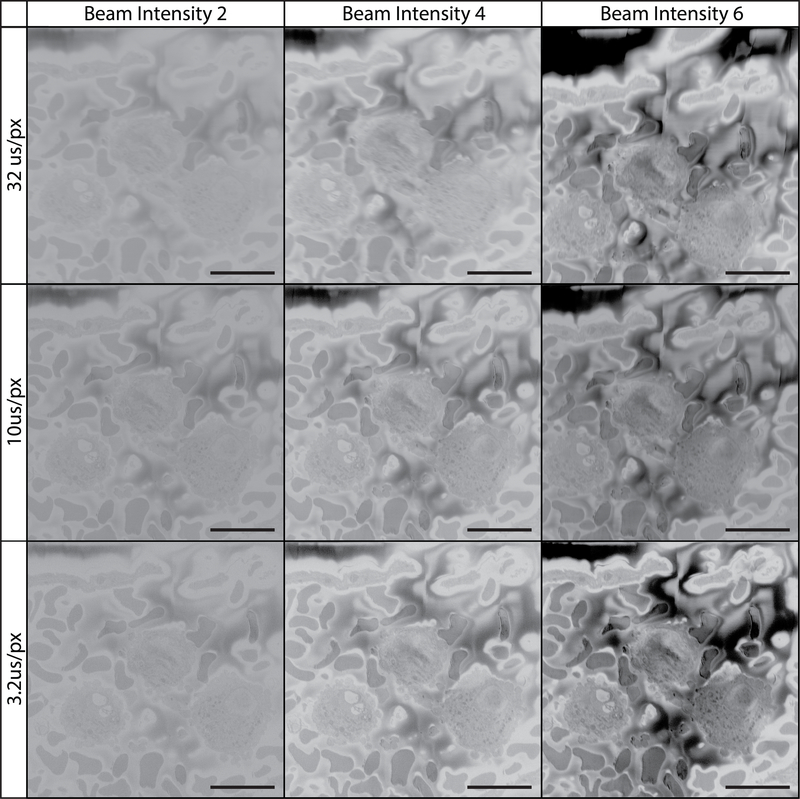
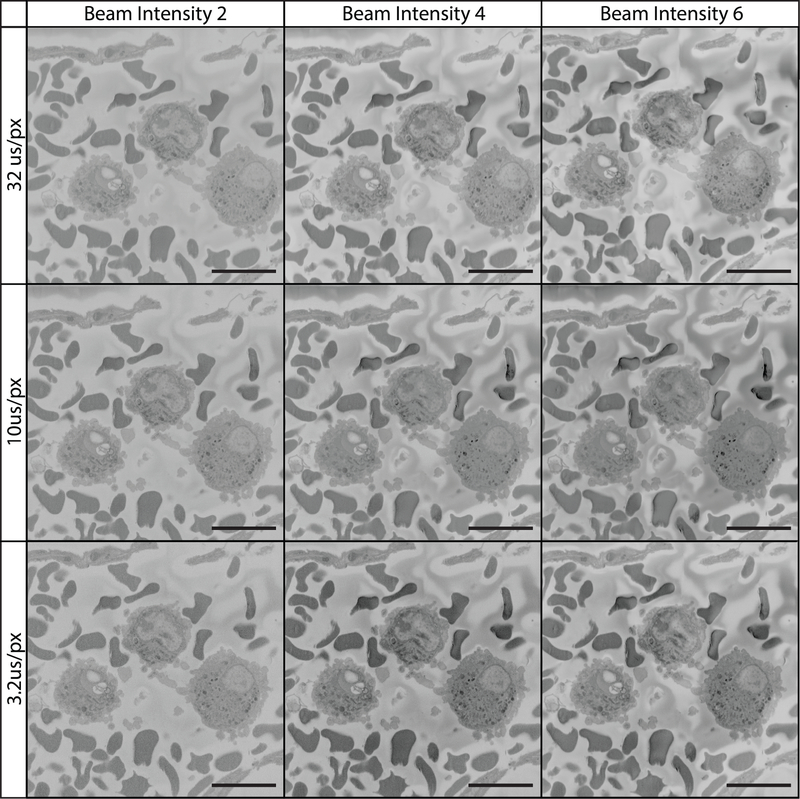
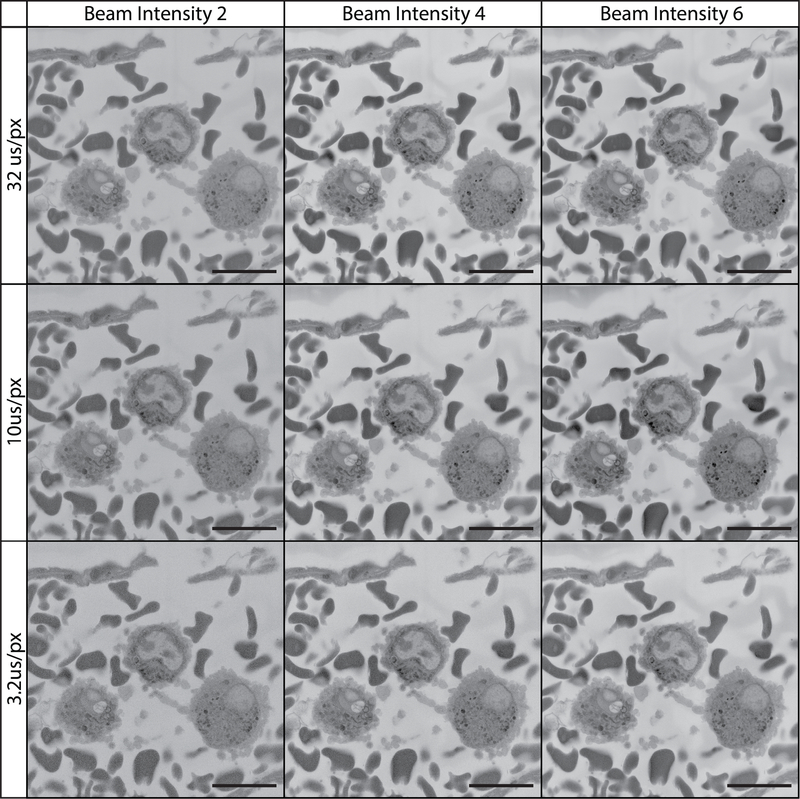
Serial block-face scanning electron microscopy (SBF-SEM) allows for the collection of hundreds to thousands of serially-registered ultrastructural images, offering an unprecedented three-dimensional view of tissue microanatomy. While SBF-SEM has seen an exponential increase in use in recent years, technical aspects such as proper tissue preparation and imaging parameters are paramount for the success of this imaging modality. This imaging system benefits from the automated nature of the device, allowing one to leave the microscope unattended during the imaging process, with the automated collection of hundreds of images possible in a single day. However, without appropriate tissue preparation cellular ultrastructure can be altered in such a way that incorrect or misleading conclusions might be drawn. Additionally, images are generated by scanning the block-face of a resin-embedded biological sample and this often presents challenges and considerations that must be addressed. The accumulation of electrons within the block during imaging, known as "tissue charging," can lead to a loss of contrast and an inability to appreciate cellular structure. Moreover, while increasing electron beam intensity/voltage or decreasing beam-scanning speed can increase image resolution, this can also have the unfortunate side effect of damaging the resin block and distorting subsequent images in the imaging series. Here we present a routine protocol for the preparation of biological tissue samples that preserves cellular ultrastructure and diminishes tissue charging. We also provide imaging considerations for the rapid acquisition of high-quality serial-images with minimal damage to the tissue block.


Figures

Figure 1:
Figure 1:. SBF-SEM and TEM comparisons at various steps in the protocol.
This protocol contains multiple steps in which sample tissue is stained with heavy metals. This affects not only tissue contrast and appreciation of cellular structures and organelles, but also the levels of charging that occurs when the tissue is imaged. This figure contains three distinct views of prepared tissue: a low magnification view (A, D & G), a high magnification view (B, E & H), and a TEM comparison of prepared mouse cornea (C, F & I). It can be noted that higher magnification images can result in increased tissue charging, as the electron beam is concentrated in a smaller region of tissue. The top row (A-C) is a representative sample from tissue processed through the completion of step 1.8, and has been impregnated with potassium ferrocyanide, osmium tetroxide, and thiocarbohydrazide. The arrows in the first two columns show the epithelial-stromal interface as a reference point. Note the low level of contrast in comparison to the bottom two rows, as well as the increased levels of tissue charging. The sample in the middle row (D-F) was processed through the completion of step 1.10 and benefits from an additional osmium tetroxide step, and is visibly more contrasted than the sample in the top row. While cellular structures are discernible, charging is still present. The sample in the bottom row (G-I) benefits from the full staining protocol and has minimal tissue charging. TEM imaging reveals tissue contrast levels imparted by the heavy metals present at each step (right column): organelles in the corneal endothelium (*) are more contrasted and apparent as tissue processing continues through the protocol. Additionally, stromal collagen and fibrillin details become more visible (arrowhead) as the protocol is completed. Panel A, D & G scale bar = 50 μm. Panel B, E & H scale bar = 10 μm. Panel C, F & I scale bar = 1 μm.
Figure 2:
Figure 2:. Schematic of embedded tissue block, specimen pin, and final preparation.
(A) Tissue should be placed in a known orientation at the very tip of the resin mold and the upper third of the mold filled with carbon black saturated resin. The region of the mold furthest from the tissue should remain clear so that the experiment label can be clearly seen. (B) Specimen pin surface should be scratched to produce a grid pattern, this allows for a greater area of contact for the cyanoacrylate glue to harden between the prepared specimen block and pin. (C) The carbon black saturated resin should make a wide area of contact with the specimen pin head, however the region that is cut by the diamond knife should be no greater than 1×1 mm. It is good practice to taper the block towards the tip. This minimizes cutting forces on the diamond knife and by having a wider base, the block is more resistant to separating from the pin during sectioning.
Figure 3:
Figure 3:. Comparison of image capture settings.
(A & B) Panels A and B compare image quality and resolution as a function of pixel dwell time. Panel A was created using a 32 μs/pixel dwell time at 4 kV and suffers from a diminished signal to noise ratio as is apparent in the “grainy” appearance of the enlarged inset. Panel B was created using a 100 μs/pixel dwell time at 4 kV. Increasing the pixel dwell time increases the signal to noise ratio and reveals an increased level of cellular detail, however increased pixel dwell time has the potential to lead to tissue charging and/or heat build-up which softens the block and introduces cutting artefacts (chatter) when sectioning. Panels C and D compare images captured under identical exposure conditions but with two different beam kV values. Tissue in these panels was impregnated with gold-toned nanogold particles to make differences in beam-penetration depths more apparent. Panel C was captured at 9 kV while panel D was captured at 21 kV. Increased kV has the advantage of increased contrast (D), however details are lost as result of gathering electrons from a greater depth of tissue (C). As a result of sampling a larger cross section, larger numbers of immunogold particles specific for GAP 43 are visible while non-specific labeling remains the same resulting in an increased signal-to-noise ratio. Panel A & B scale bar = 2 μm. Panel C & D scale bar = 1 μm.
Figure 4:
Figure 4:. Beam intensity, kV and spot size.
(A) Upon contacting the tissue sample, the electron beam (light blue) yields a teardrop-shaped interaction volume, from which varying forms of energy are produced from the interaction between beam electrons and the tissue sample. The teardrop shape is a function of tissue density and heavy metal staining along with beam energy, and the tilt angle of the electron beam. While x-rays, auger electrons, and tertiary electrons are produced during SBF-SEM imaging, the primary concern is with backscattered (dark blue) and secondary (green) electrons. The image produced with SBF-SEM imaging is produced by collecting backscattered electrons. These electrons originate from elastic interactions between the beam and the sample, and the signal collected is highly dependent on the atomic number of atoms interacted with – hence the need for heavy metal staining. Secondary electrons originate from inelastic interactions between the beam and the sample and detection of their signal is highly dependent on surface orientation. Because the block-face is flat in SBF-SEM, secondary electrons do not contribute meaningfully to the signal collected. In fact, secondary electron accumulation on the surface of the block can be a major source of charging and has a deleterious effect on image quality. (B) This graph shows the relationship between beam intensity, beam kV, and spot size. The spot size is the spatial resolution of the beam, and determines the resolution limit of the images being produced. Lowering kV increases the spot size, but also decreases the imaging depth allowing for finer appreciation of detail. This has the effect of decreasing the detectable signal as well. Increasing beam intensity offers an initial improvement on spot size and signal detection, but rapidly increases levels of tissue charging. Ultimately, the beam intensity and kV values chosen are sample dependent and best determined empirically in relation to the scientific question being asked.
Figure 5:
Figure 5:. Elastin-free microfibril bundle network in the mouse cornea.
3D reconstruction of microfibrils (white) closely associated with keratocytes (yellow, orange & green) within the corneal stroma. The microfibrils can be seen adjacent to, and in some cases within shallow grooves in, corneal keratocytes (arrows) (A). This network of elastin-free microfibrils are organized in distinct layers within the corneal stroma (B). Scale bar = 2 μm. The image block reconstructed is 45×45 μm in the x & y axis, and 30 μm in the z axis with voxel a resolution of 22×22×100 nm.
Figure 6:
Figure 6:. Reconstruction of corneal nerves passing through basal lamina at the stromal-epithelial border.
3D reconstruction of a penetrating nerve (purple) as it passes through the basal lamina (green). This nerve can be seen to bifurcate prior to penetration. After penetrating into the epithelium, both nerve branches underwent ramification. Mitochondria (yellow) are visible in the stromal and epithelial portions of the nerve bundle. Scale bar = 2.5 μm. The image block reconstructed is 25×25 μm in the x & y axis, and 14 μm in the z axis with a voxel resolution of 12×12×100 nm.
Figure 7:
Figure 7:. Limbal vasculature and associated cells in the peripheral mouse cornea.
A single image (A) from a 3D image block (B) can be seen through which a vessel, nerve bundle, and associated cells travel. Panel C shows a reconstructed vessel (red) with an associated pericyte (gray) wrapped around it covering the endothelial cell junctions. A nerve bundle (blue) bifurcates in close proximity to this vessel as it travels through the tissue. A neutrophil (yellow) can be seen parallel to the long axis of the vessel, with its polymorphic nucleus visible within its cell body and the trailing uropod visible as a protrusion towards the right of the image. A mast cell (magenta) is visible on the underside of the vessel. Panel D isolates this mast cell, where its granules (green) can be more easily seen overlaying the nucleus (purple) within the cell. Panel E highlights the cellular structures overlaid on the cellular reconstructions, with endothelial nuclei denoted in blue, and adherent microparticles visible in the vessel lumen (orange). Arrows show cell-cell borders between endothelial cells, which can be further seen as raised ridges extending along the cells on the luminal side of the vessel. Panel A scale bar = 2 μm. The image block used to reconstruct these cells is 30×30 μm in the x & y axis, and 42.5 μm in the z axis with a voxel resolution of 14.6×14.6×100 nm.
Figure 8:
Figure 8:. Reconstructed vascular network of the non-human primate retinal nerve fiber layer.
(A) A 200×200 μm SBF-SEM image of the primate retina taken at 8192×8192 px. The location sampled is ~500 microns from the inferior temporal rim margin of a healthy eye with no pathology. The image series reconstructed in panels C & D were captured at 2048×2048 px, with imaging paused so that regions of interested could be imaged at 8192×8192 px. Panel B is the inlayed region of panel A, taken directly from the original image. Note the large number of axons and their mitochondria. (C) Orthoslice section through a 200×200×200 μm tissue volume of a control eye inferior temporal nerve fiber layer, with vasculature segmented. (D) Z-projection of the nerve fiber layer vasculature. This series illustrates the resolution possible in a large field using this methodology. Panel A scale bar = 20 μm. Panel B scale bar = 2 μm. Image series voxel resolution is 97.6×97.6×500 nm. Region of interest pixel resolution is 24.4×24.4 nm.
Figure 9:
Figure 9:. Segmentation and 3D volume rendering of vessels in the giant danio (Devario malabaricus) compact heart.
(A) Two-dimensional micrograph in an image stack, showing the profile of a central venular-size vessel (arrow) and an endothelial nucleus (arrowhead), with surrounding cardiac myocytes rich in mitochondria and well organized sarcomeres (*). (B) Two-dimensional micrograph of the image stack with a capillary-size vessel (arrow). (C) Biorthogonal projections of the micrograph stack showing the capillary in panel B projected through one orthogonal slice. (D) 3D rendering of segmented endothelial cells lining the reconstructed vessel. Illustrated in green, red, blue, and purple are four separate endothelial cells; the endothelial cell depicted in blue can be seen in cross section in panel B (arrow), while the endothelial cells depicted in red (arrow) and green (arrowhead) are seen in cross section in panel A. Panels A & B scale bar = 2 μm. The image block reconstructed is 30×30 μm in the x & y axis, and 16 μm in the z axis with a voxel resolution of 14.6×14.6×100 nm.
Figure 10:
Figure 10:. Imaging complications and artefacts.
(A) The wavy and distorted nature of this image is the result of imaging using a pixel dwell time that is too long. This heats the resin block, leaving the block face soft and rubbery which results in a distorted image upon cutting. (B) This image contains a host of artefacts. The asterisk indicates a wavy distortion caused by prior imaging at a higher magnification and similar to panel A, concentrating the beam on a smaller region with a longer pixel dwell time has softened the resin in this region of interest. While the higher magnification image collected was free of artefacts, this can lead to a subsequent series of images where the sample underlying the region of interest appears distorted. This panel also illustrates the issue of debris accumulation on the block face (arrow) during imaging, also denoted by the arrow in panel E. If this becomes a persistent imaging problem, it will be necessary to break the vacuum, open the chamber and blow away debris accumulated on the diamond knife and around the sample. Small discharges of electrons from the block-face can lead to the rapid contrast changes and lines denoted by the white arrowhead. (C) This image illustrates knife scratches on the block face. This can occur due to a damaged knife, or debris accumulation on the edge of the knife. (D) The artefact denoted (arrow) is a result of the electron beam focused on (without sectioning) the block face for an extended period of time with the sample still in the imaging chamber. (E) Improper fixation of tissue can lead to separation of cellular structures and connective tissue (*). (F) If a large amount of charging occurs in your tissue or resin block, subsequent accumulation and discharge can occur which leads to the image “skipping” as is seen in this image. Note the distortion of the tissue in the image at these skipping points (arrows). Panel A scale bar = 1 μm. Panel B scale bar = 2 μm. Panel C scale bar = 5 μm. Panel D scale bar = 2 μm. Panel E scale bar = 25 um. Panel F scale bar = 50 um.
Figure 11:
Figure 11:. Imaging tissue at 3 kV using various pixel dwell times and beam intensities.
All images were collecting using a 3 kV beam, beam intensity is on a device-specific scale ranging from 1 to 20. The field imaged is of the vascular lumen containing white and red blood cells. At this low kV it is difficult to appreciate cellular detail. Increasing the pixel dwell time had little effect. Increasing beam intensity to 6 improved image contrast.
Figure 12:
Figure 12:. Imaging tissue at 7 kV using various pixel dwell times and beam intensities.
All images were collected using a 7 kV beam, beam intensity is on a device-specific scale ranging from 1 to 20. The field imaged is of the vascular lumen containing white and red blood cells. At 7 kV, increasing beam intensity and pixel dwell time contributed to higher quality imaging.
Figure 13:
Figure 13:. Imaging tissue at 12 kV using various pixel dwell times and beam intensities.
All images were collected using a 12 kV beam, beam intensity is on a device-specific scale ranging from 1 to 20. The field imaged is of the vascular lumen containing white and red blood cells. At 12 kV, imaging is optimized by adjusting pixel dwell time and beam intensity. Charging is reduced/absent at shorter pixel dwell times while cellular detail and image contrast are best with a longer pixel dwell time and higher beam intensity.

Similar articles

Cited by

References

    1. Leighton SB SEM images of block faces, cut by a miniature microtome within the SEM - a technical note. Scanning Electron Microscopy. (Pt 2), 73–76 (1981). - PubMed
    1. Denk W, Horstmann H Serial block-face scanning electron microscopy to reconstruct three-dimensional tissue nanostructure. PLOS Biology. 2 (11), e329 (2004). - PMC - PubMed
    1. He Q, Hsueh M, Zhang G, Joy DC, Leapman RD Biological serial block face scanning electron microscopy at improved z-resolution based on Monte Carlo model. Scientific Reports. 8 (1), 12985 (2018). - PMC - PubMed
    1. Zankel A, Wagner J, Poelt P Serial sectioning methods for 3D investigations in materials science. Micron. 62, 66–78 (2014). - PubMed
    1. Titze B, Genoud C Volume scanning electron microscopy for imaging biological ultrastructure. Biology of the Cell. 108 (11), 307–323 (2016). - PubMed

Publication types

MeSH terms

LinkOut - more resources