

The landscape of copy number variations in classical Hodgkin lymphoma: a joint KU Leuven and LYSA study on cell-free DNA
- PMID: 33843986
- PMCID: PMC8045498
- DOI: 10.1182/bloodadvances.2020003039
The landscape of copy number variations in classical Hodgkin lymphoma: a joint KU Leuven and LYSA study on cell-free DNA
Abstract
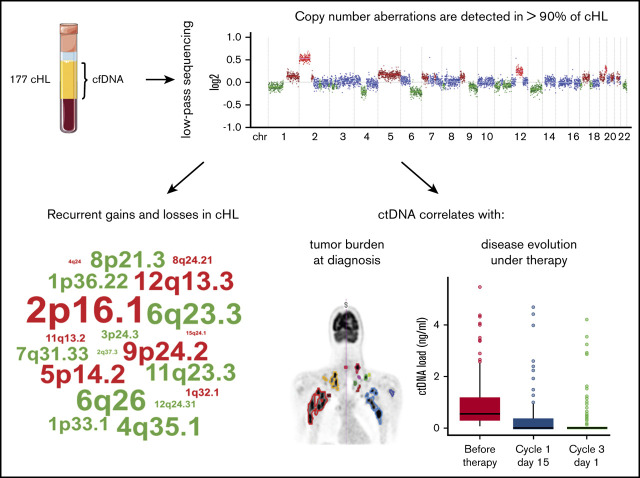
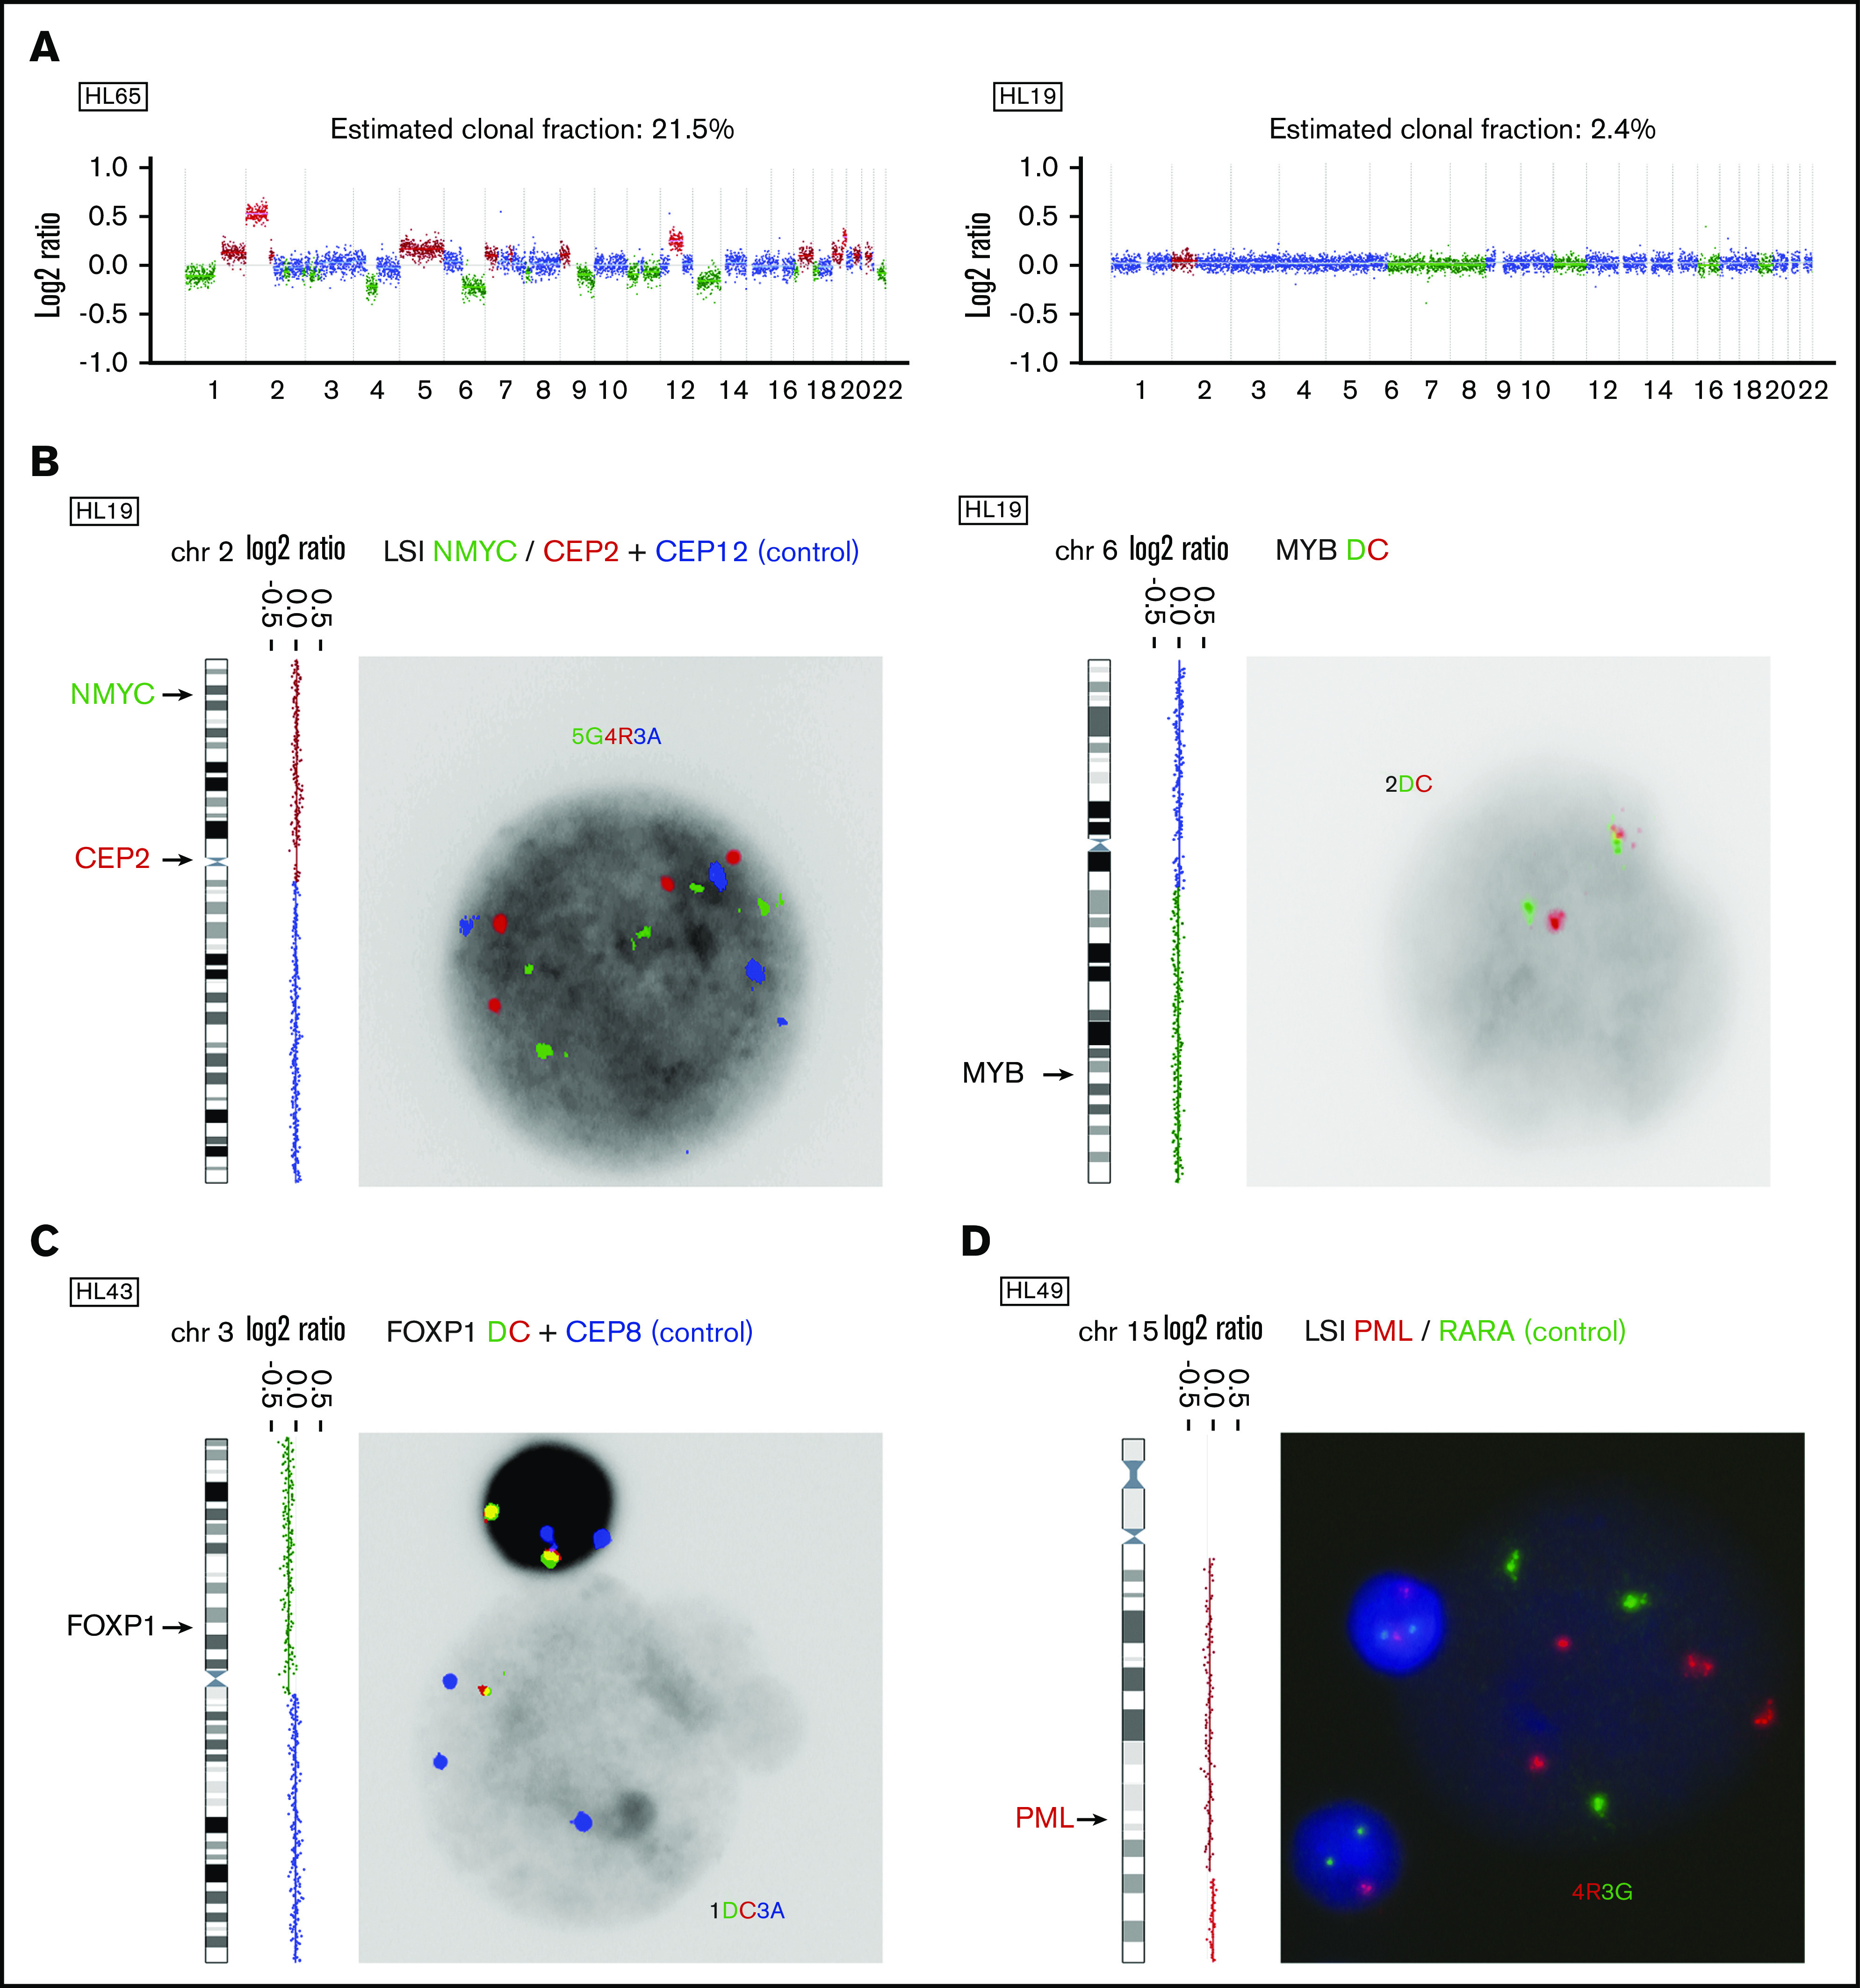
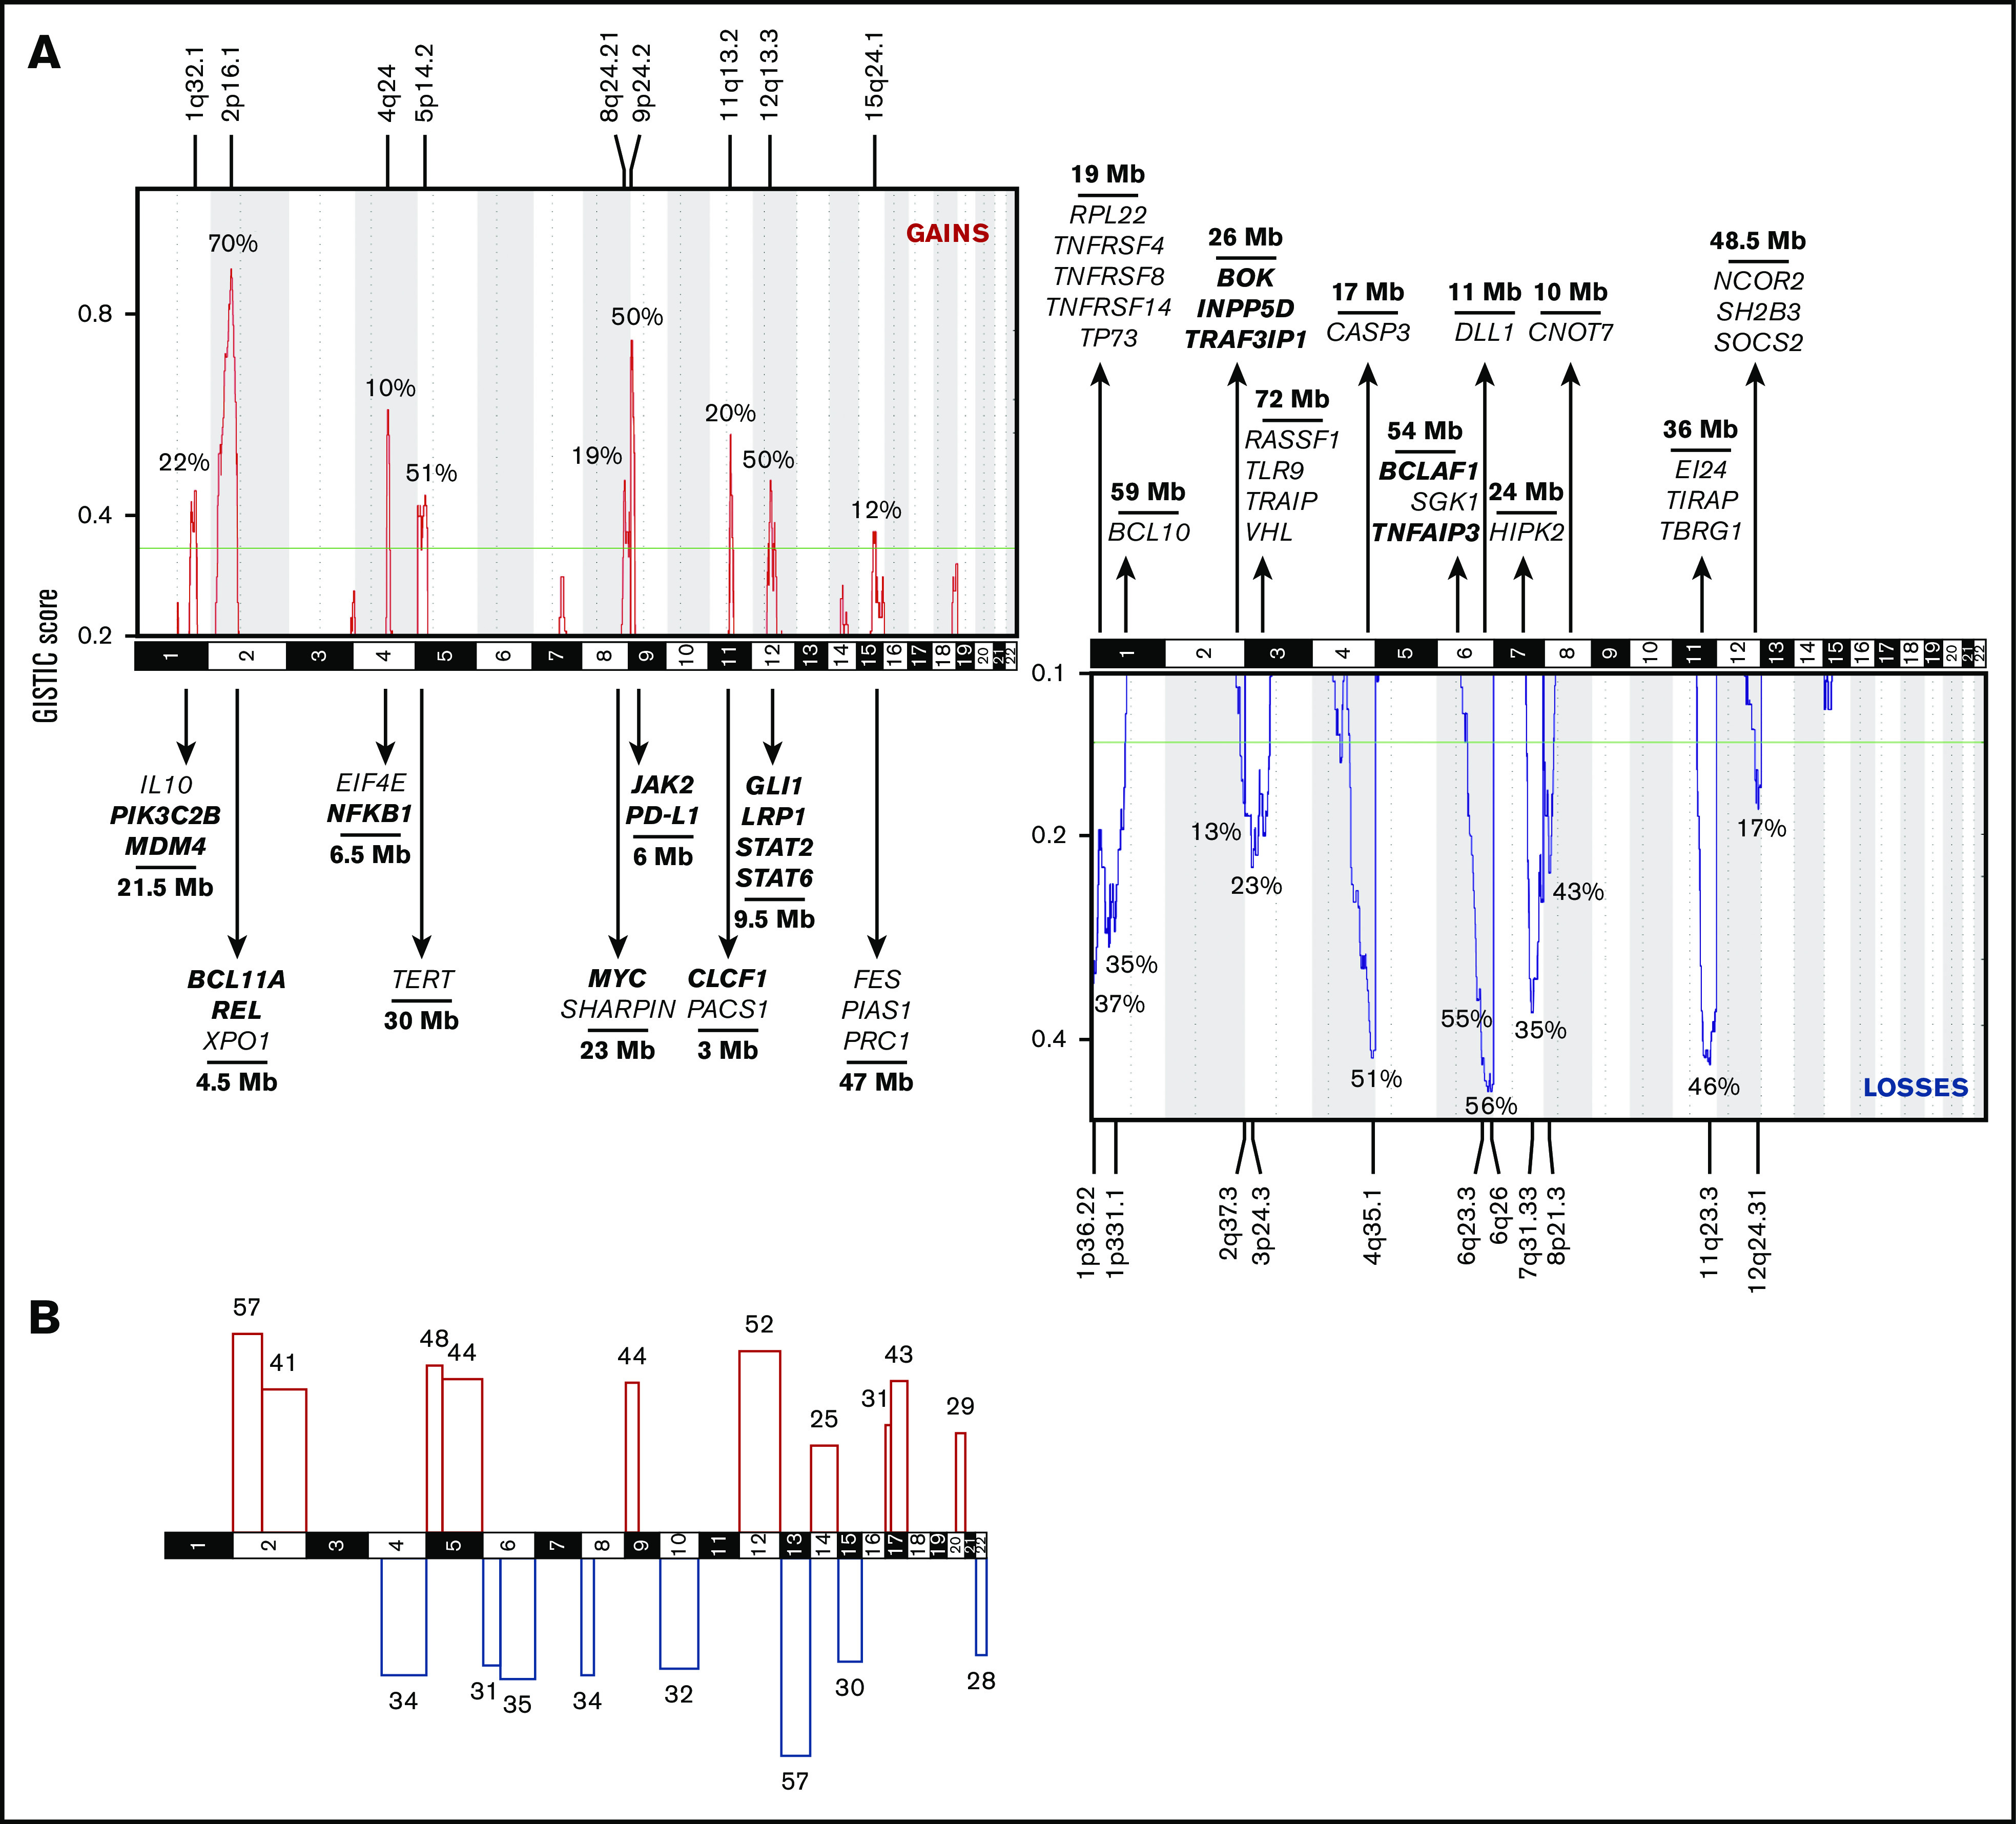
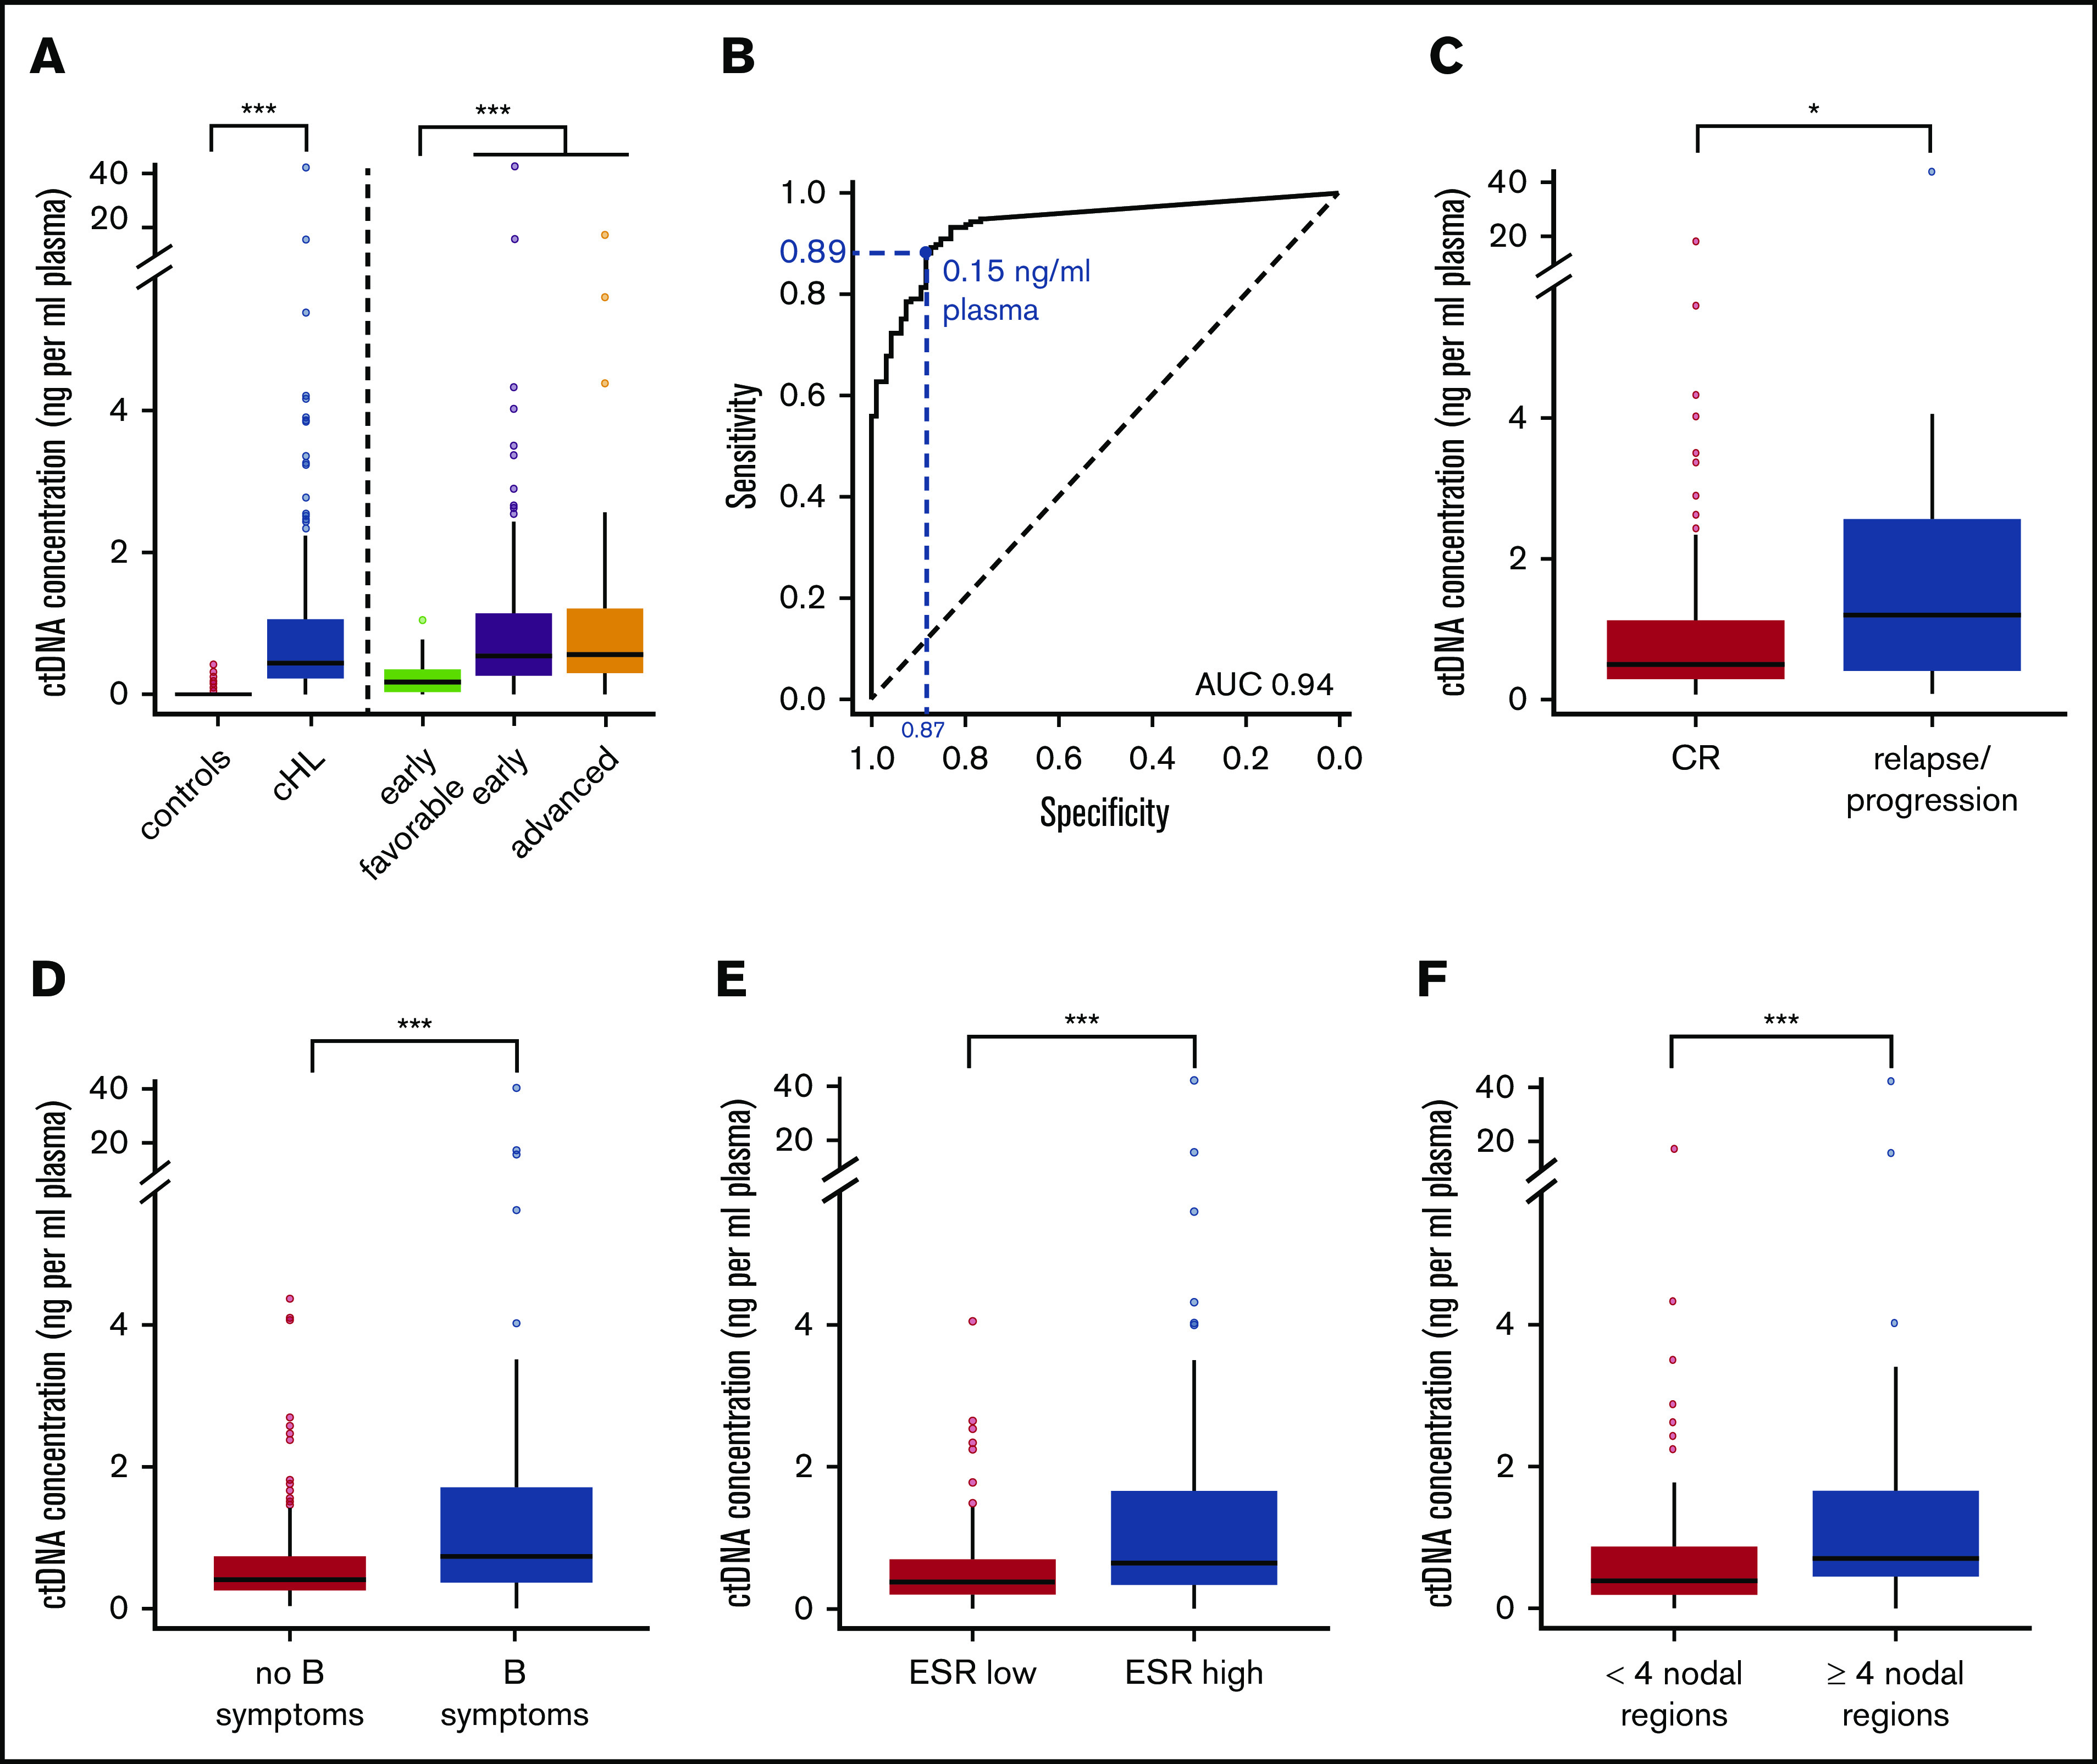
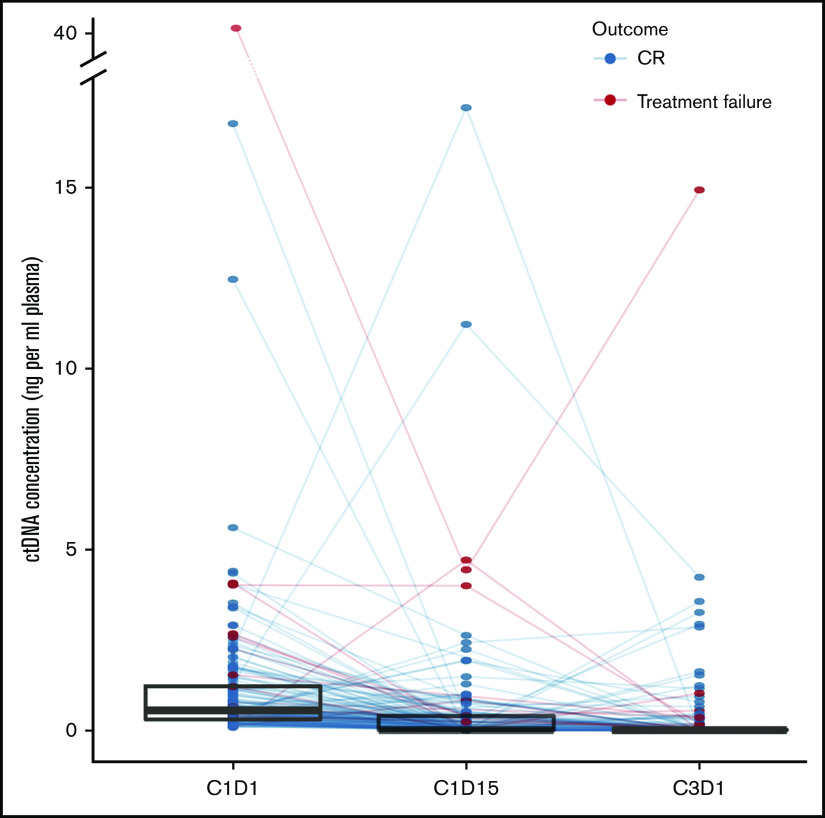
The low abundance of Hodgkin/Reed-Sternberg (HRS) cells in lymph node biopsies in classical Hodgkin lymphoma (cHL) complicates the analysis of somatic genetic alterations in HRS cells. As circulating cell-free DNA (cfDNA) contains circulating tumor DNA (ctDNA) from HRS cells, we prospectively collected cfDNA from 177 patients with newly diagnosed, mostly early-stage cHL in a monocentric study at Leuven, Belgium (n = 59) and the multicentric BREACH study by Lymphoma Study Association (n = 118). To catalog the patterns and frequencies of genomic copy number aberrations (CNAs), cfDNA was sequenced at low coverage (0.26×), and data were analyzed with ichorCNA to yield read depth-based copy number profiles and estimated clonal fractions in cfDNA. At diagnosis, the cfDNA concentration, estimated clonal fraction, and ctDNA concentration were significantly higher in cHL cases than controls. More than 90% of patients exhibited CNAs in cfDNA. The most frequent gains encompassed 2p16 (69%), 5p14 (50%), 12q13 (50%), 9p24 (50%), 5q (44%), 17q (43%), 2q (41%). Losses mostly affected 13q (57%), 6q25-q27 (55%), 4q35 (50%), 11q23 (44%), 8p21 (43%). In addition, we identified loss of 3p13-p26 and of 12q21-q24 and gain of 15q21-q26 as novel recurrent CNAs in cHL. At diagnosis, ctDNA concentration was associated with advanced disease, male sex, extensive nodal disease, elevated erythrocyte sedimentation rate, metabolic tumor volume, and HRS cell burden. CNAs and ctDNA rapidly diminished upon treatment initiation, and persistence of CNAs was associated with increased probability of relapse. This study endorses the development of ctDNA as gateway to the HRS genome and substrate for early disease response evaluation.
© 2021 by The American Society of Hematology.
Conflict of interest statement
Conflict-of-interest disclosure: The authors declare no competing financial interests.
Figures
Similar articles
-
Non-invasive detection of genomic imbalances in Hodgkin/Reed-Sternberg cells in early and advanced stage Hodgkin's lymphoma by sequencing of circulating cell-free DNA: a technical proof-of-principle study.Lancet Haematol. 2015 Feb;2(2):e55-65. doi: 10.1016/S2352-3026(14)00039-8. Epub 2015 Jan 20. Lancet Haematol. 2015. PMID: 26687610
-
Molecular karyotypes of Hodgkin and Reed-Sternberg cells at disease onset reveal distinct copy number alterations in chemosensitive versus refractory Hodgkin lymphoma.Clin Cancer Res. 2011 May 15;17(10):3443-54. doi: 10.1158/1078-0432.CCR-10-1071. Epub 2011 Mar 8. Clin Cancer Res. 2011. PMID: 21385932 Free PMC article.
-
Detection of genomic imbalances in microdissected Hodgkin and Reed-Sternberg cells of classical Hodgkin's lymphoma by array-based comparative genomic hybridization.Haematologica. 2008 Sep;93(9):1318-26. doi: 10.3324/haematol.12875. Epub 2008 Jul 18. Haematologica. 2008. PMID: 18641027
-
[Microenvironment in classical Hodgkin lymphoma].Pathologe. 2020 May;41(3):254-260. doi: 10.1007/s00292-020-00774-z. Pathologe. 2020. PMID: 32239325 Review. German.
-
Signaling pathways and immune evasion mechanisms in classical Hodgkin lymphoma.Blood. 2017 Nov 23;130(21):2265-2270. doi: 10.1182/blood-2017-06-781989. Blood. 2017. PMID: 29167175 Free PMC article. Review.
Cited by
-
Liquid Biopsy in B and T Cell Lymphomas: From Bench to Bedside.Int J Mol Sci. 2025 May 19;26(10):4869. doi: 10.3390/ijms26104869. Int J Mol Sci. 2025. PMID: 40430009 Free PMC article. Review.
-
Promising drugs and treatment options for pediatric and adolescent patients with Hodgkin lymphoma.Front Cell Dev Biol. 2022 Nov 24;10:965803. doi: 10.3389/fcell.2022.965803. eCollection 2022. Front Cell Dev Biol. 2022. PMID: 36506094 Free PMC article. Review.
-
Pathogenic Variants Associated with Epigenetic Control and the NOTCH Pathway Are Frequent in Classic Hodgkin Lymphoma.Int J Mol Sci. 2024 Feb 20;25(5):2457. doi: 10.3390/ijms25052457. Int J Mol Sci. 2024. PMID: 38473705 Free PMC article.
-
Distinct Hodgkin lymphoma subtypes defined by noninvasive genomic profiling.Nature. 2024 Jan;625(7996):778-787. doi: 10.1038/s41586-023-06903-x. Epub 2023 Dec 11. Nature. 2024. PMID: 38081297 Free PMC article.
-
The Value of Cell-Free Circulating DNA Profiling in Patients with Skin Diseases.Methods Mol Biol. 2023;2695:247-262. doi: 10.1007/978-1-0716-3346-5_17. Methods Mol Biol. 2023. PMID: 37450124 Review.
References
-
- Mottok A, Steidl C. Biology of classical Hodgkin lymphoma: implications for prognosis and novel therapies. Blood. 2018;131(15):1654-1665. - PubMed
-
- Eichenauer DA, Aleman BMP, André M, et al. . Hodgkin lymphoma: ESMO Clinical Practice Guidelines for diagnosis, treatment and follow-up. Ann Oncol. 2018;29(suppl 4):iv19-iv29. - PubMed
-
- Reichel J, Chadburn A, Rubinstein PG, et al. . Flow sorting and exome sequencing reveal the oncogenome of primary Hodgkin and Reed-Sternberg cells. Blood. 2015;125(7):1061-1072. - PubMed
-
- Steidl C, Telenius A, Shah SP, et al. . Genome-wide copy number analysis of Hodgkin Reed-Sternberg cells identifies recurrent imbalances with correlations to treatment outcome. Blood. 2010;116(3):418-427. - PubMed
Publication types
MeSH terms
Substances
LinkOut - more resources
Full Text Sources
Other Literature Sources
Medical
Research Materials
