. 2021 Aug 1;127(15):2693-2704.
doi: 10.1002/cncr.33554. Epub 2021 Apr 12.

Metabolic imaging with hyperpolarized 13 C pyruvate magnetic resonance imaging in patients with renal tumors-Initial experience

Affiliations

Metabolic imaging with hyperpolarized 13 C pyruvate magnetic resonance imaging in patients with renal tumors-Initial experience

Shuyu Tang et al. Cancer. .

Abstract

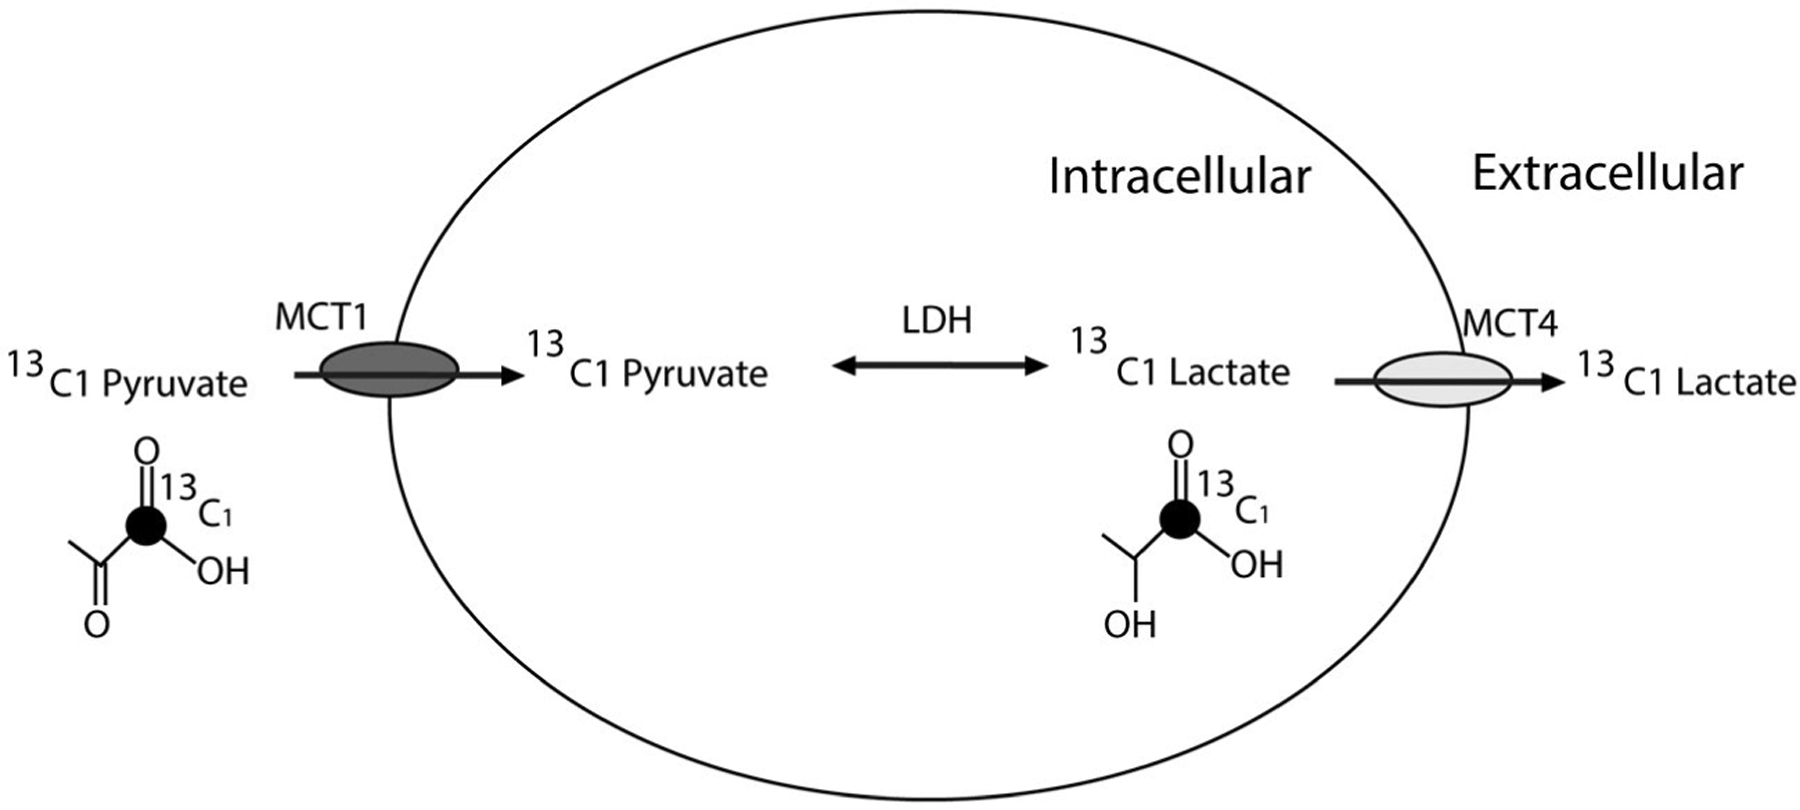
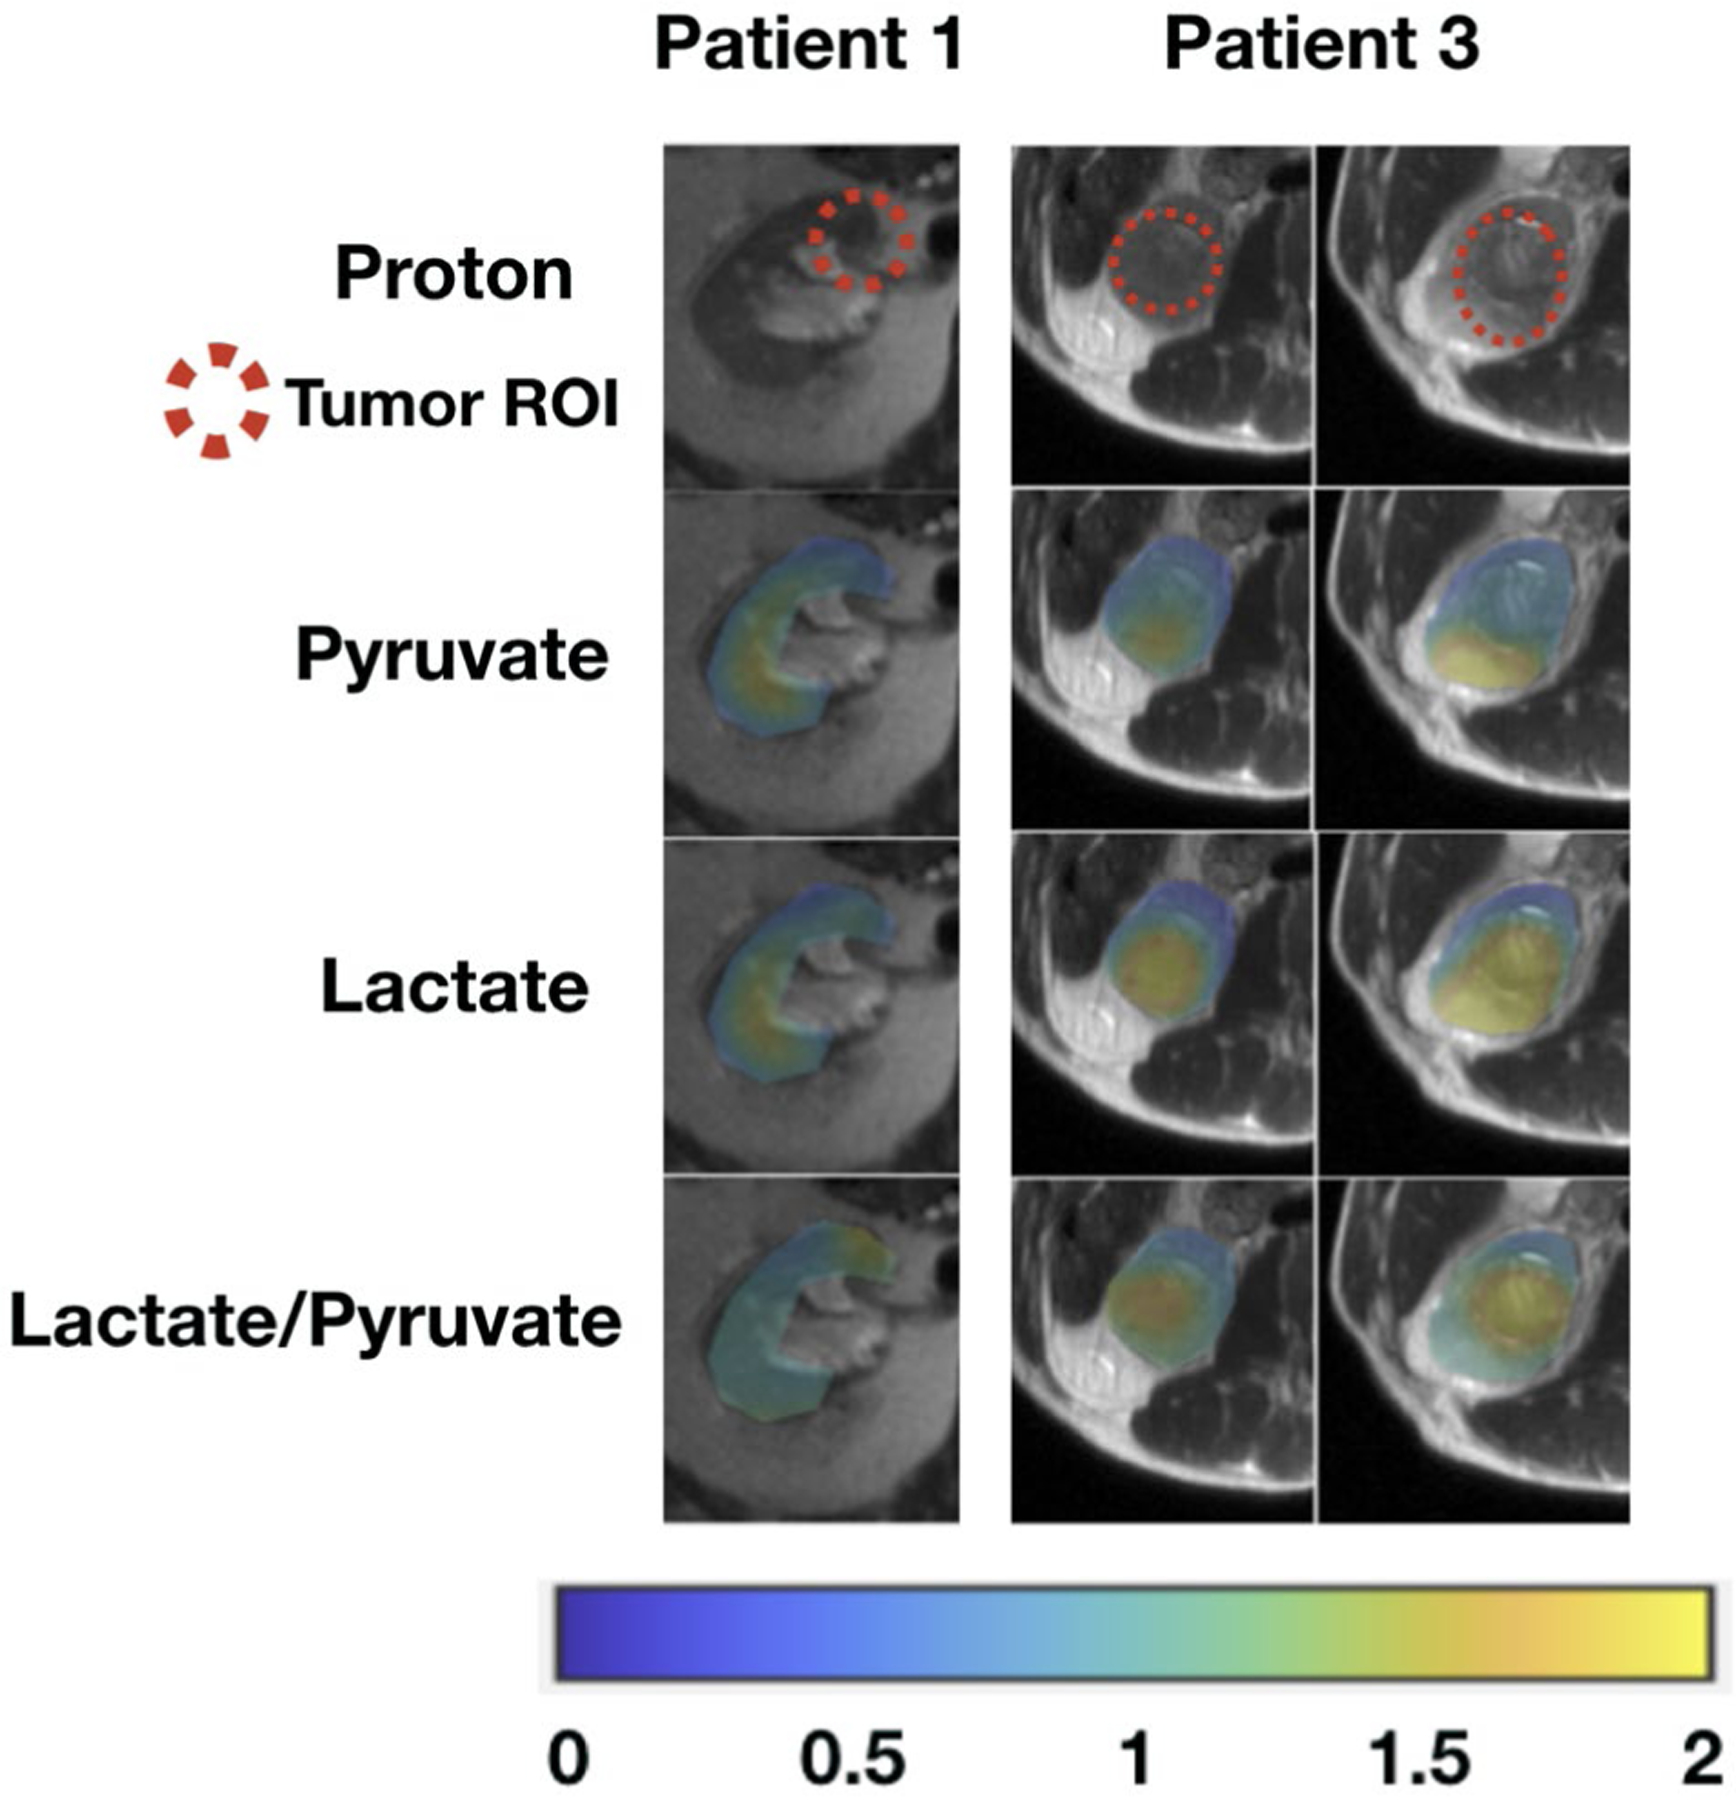
Background: Optimal treatment selection for localized renal tumors is challenging because of their variable biologic behavior and limitations in the preoperative assessment of tumor aggressiveness. The authors investigated the emerging hyperpolarized (HP) 13 C magnetic resonance imaging (MRI) technique to noninvasively assess tumor lactate production, which is strongly associated with tumor aggressiveness.

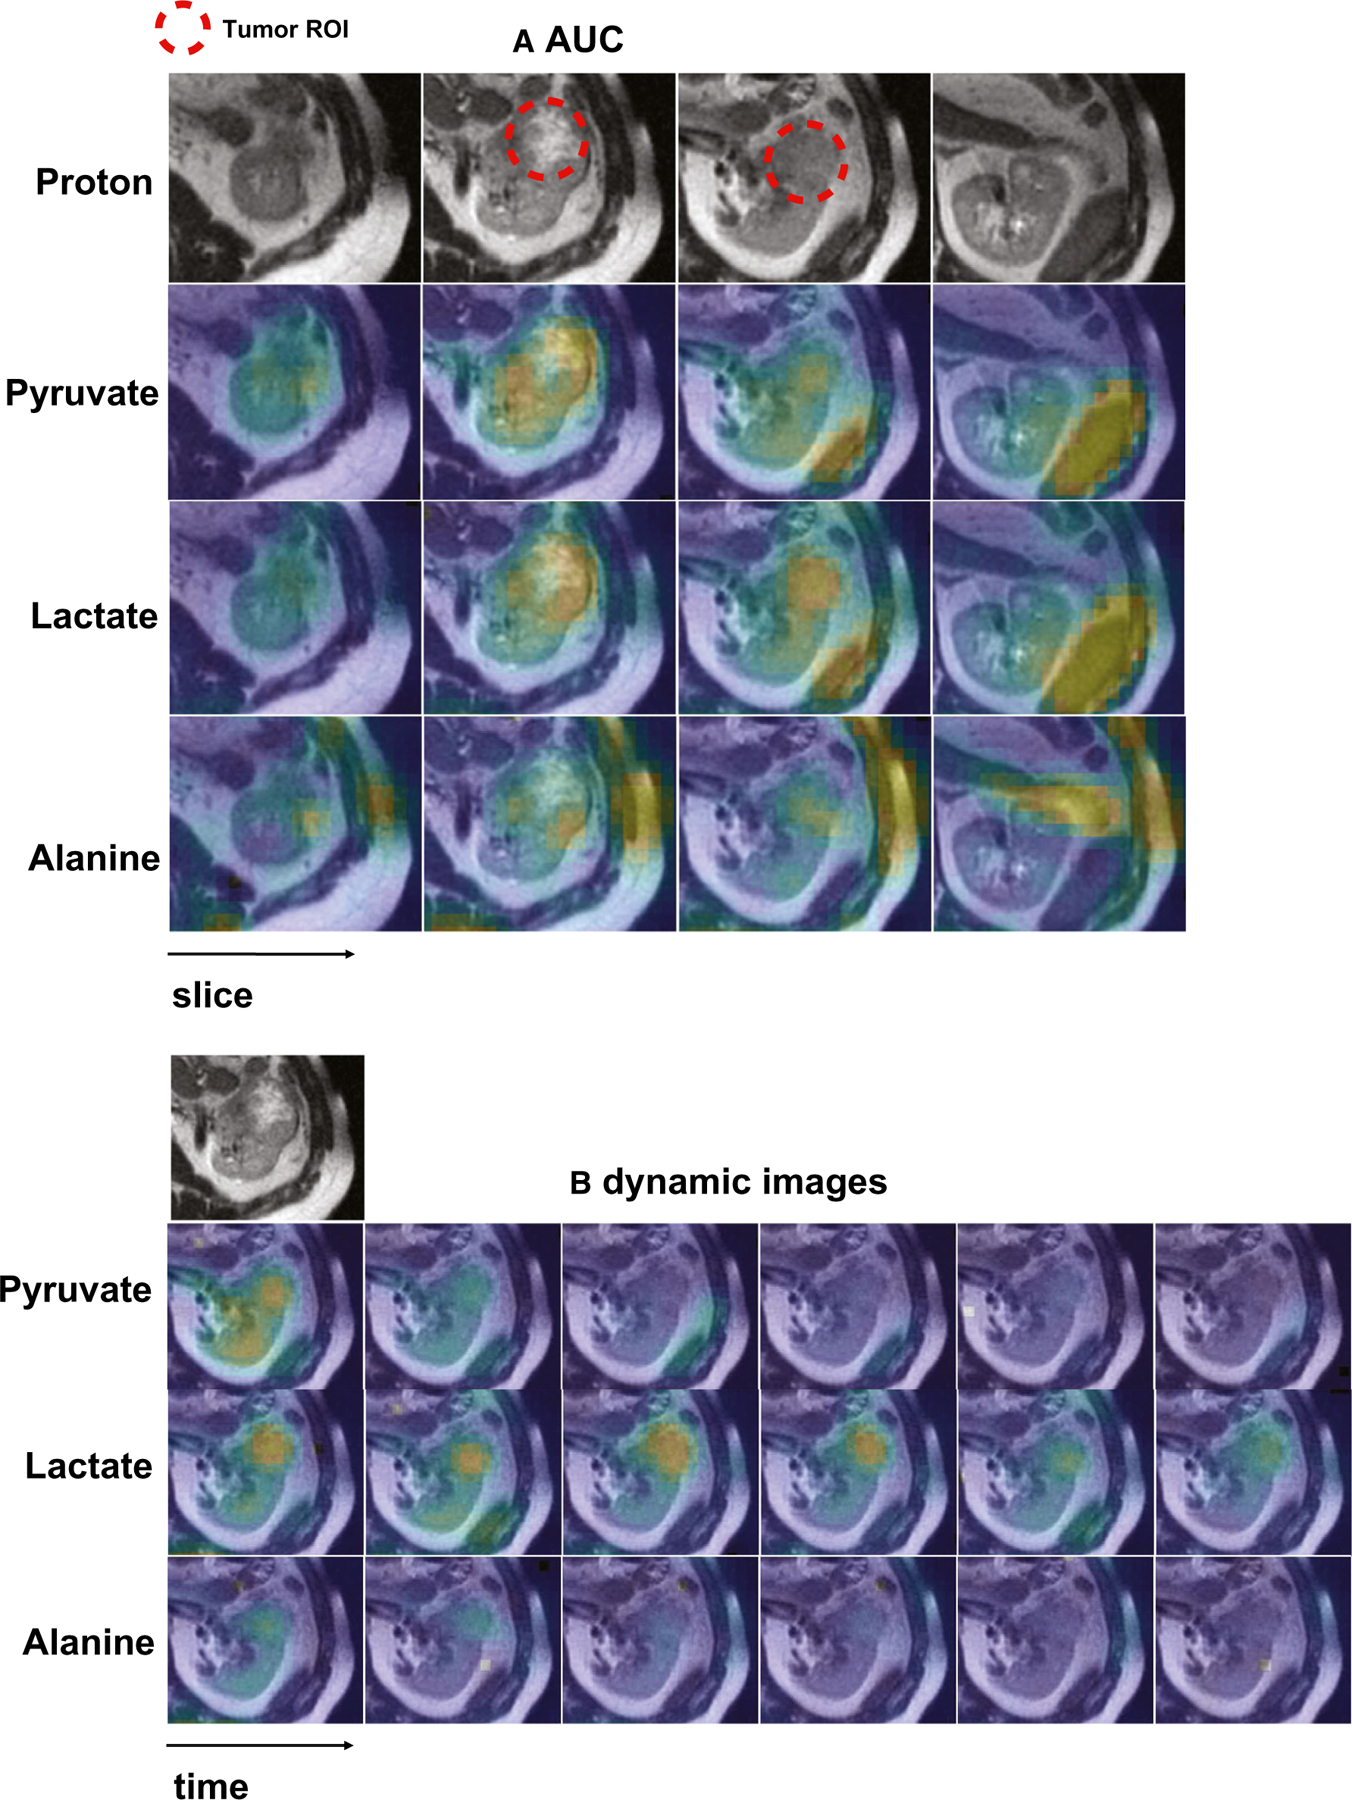
Methods: Eleven patients with renal tumors underwent HP 13 C pyruvate MRI before surgical resection. Tumor 13 C pyruvate and 13 C lactate images were acquired dynamically. Five patients underwent 2 scans on the same day to assess the intrapatient reproducibility of HP 13 C pyruvate MRI. Tumor metabolic data were compared with histopathology findings.

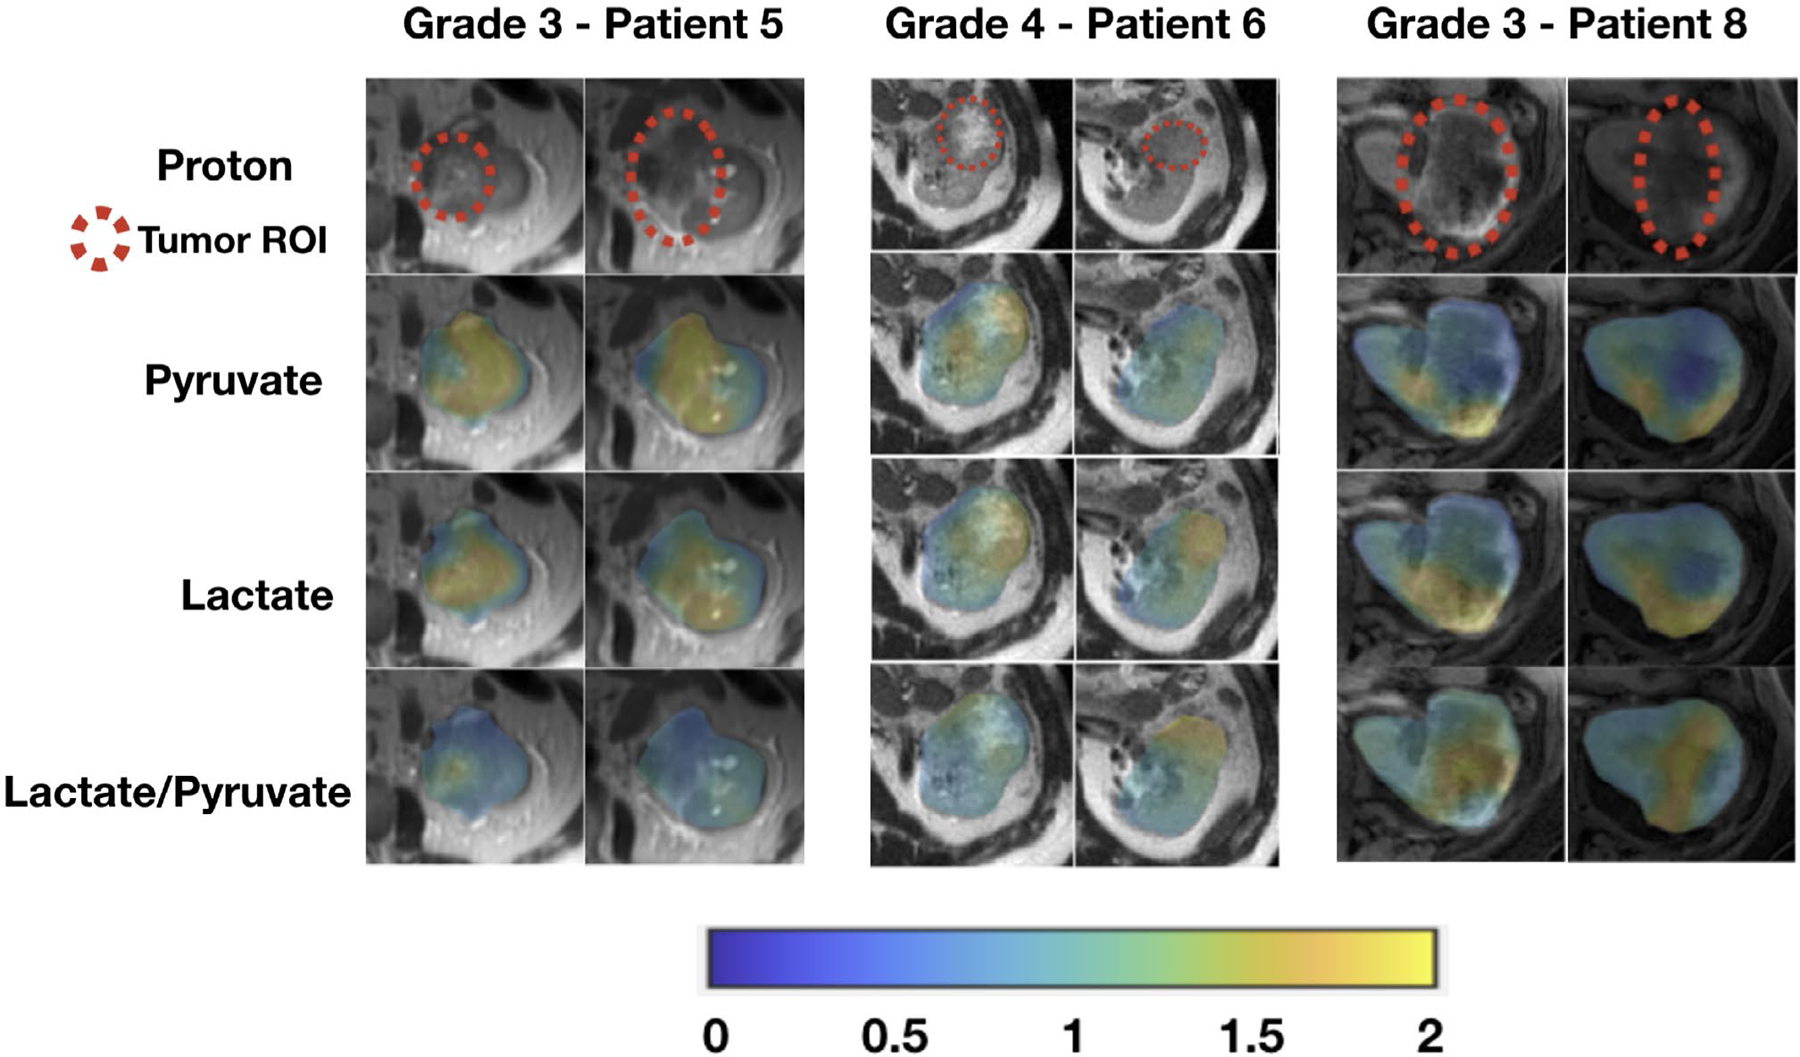
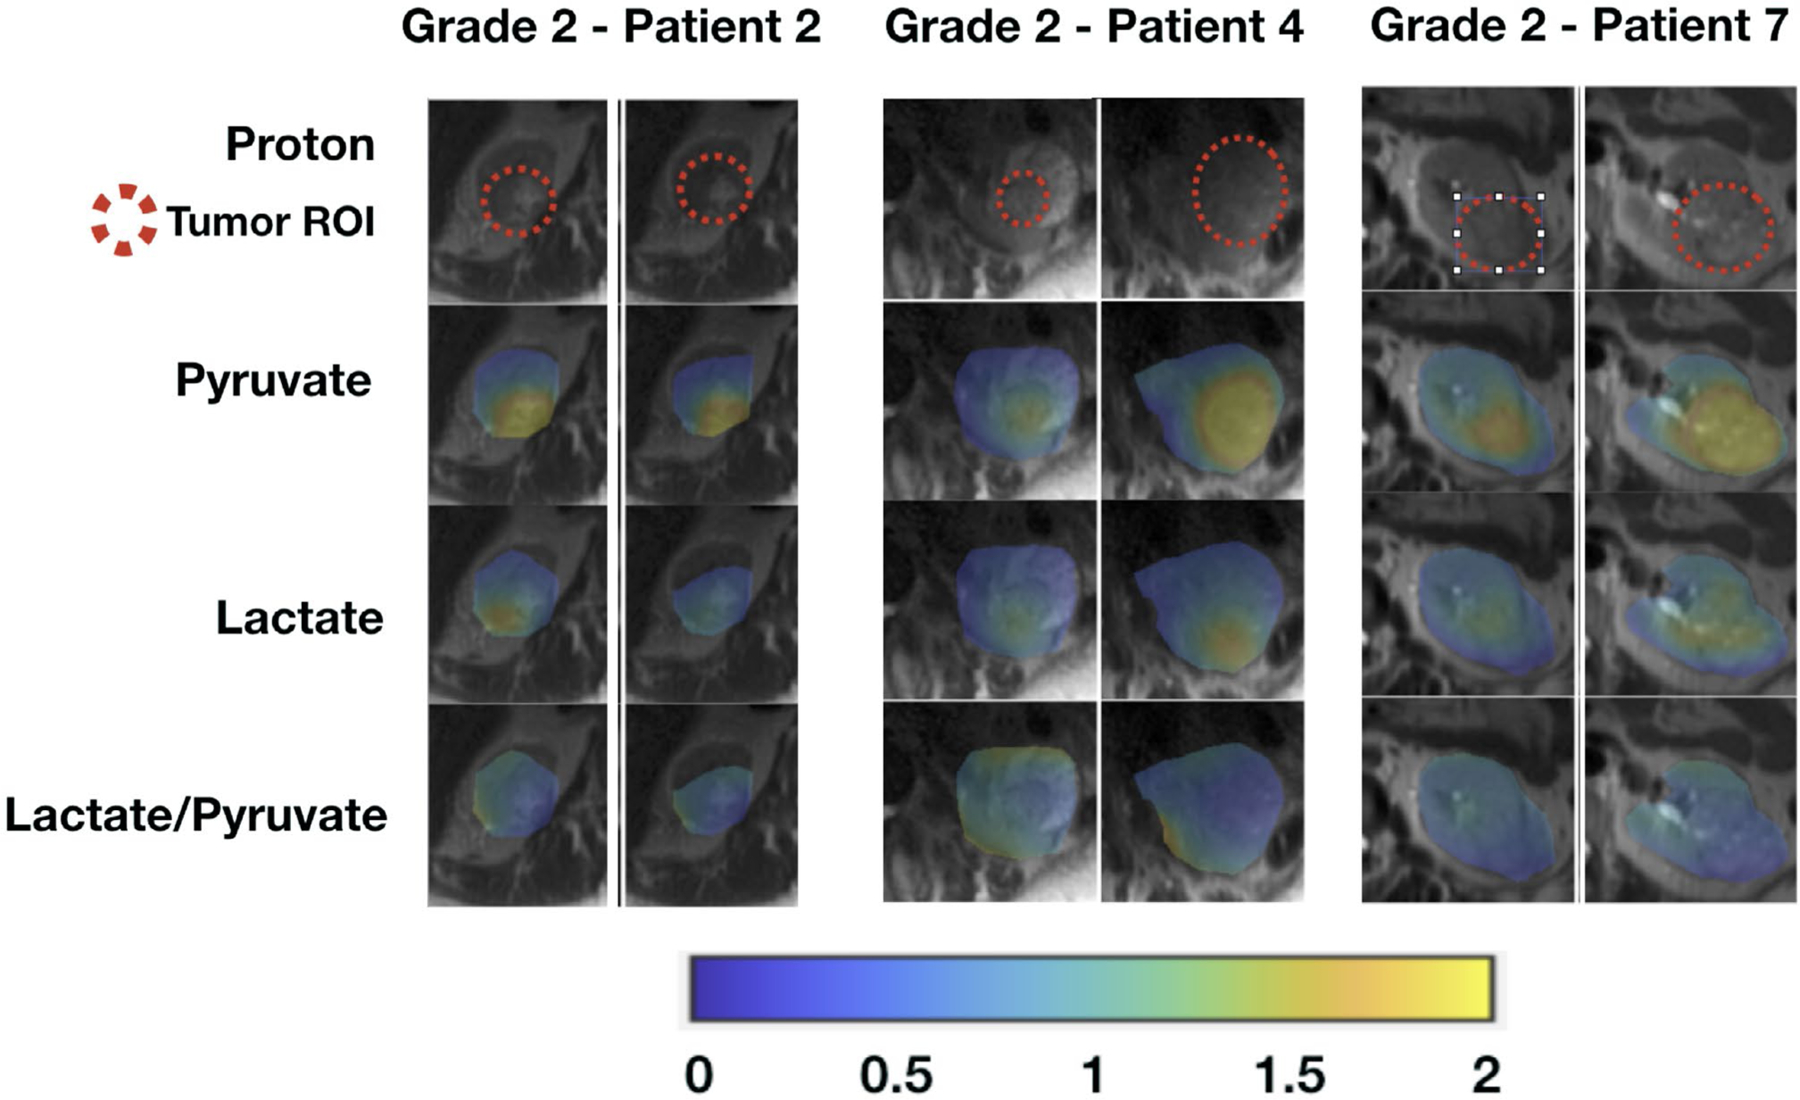
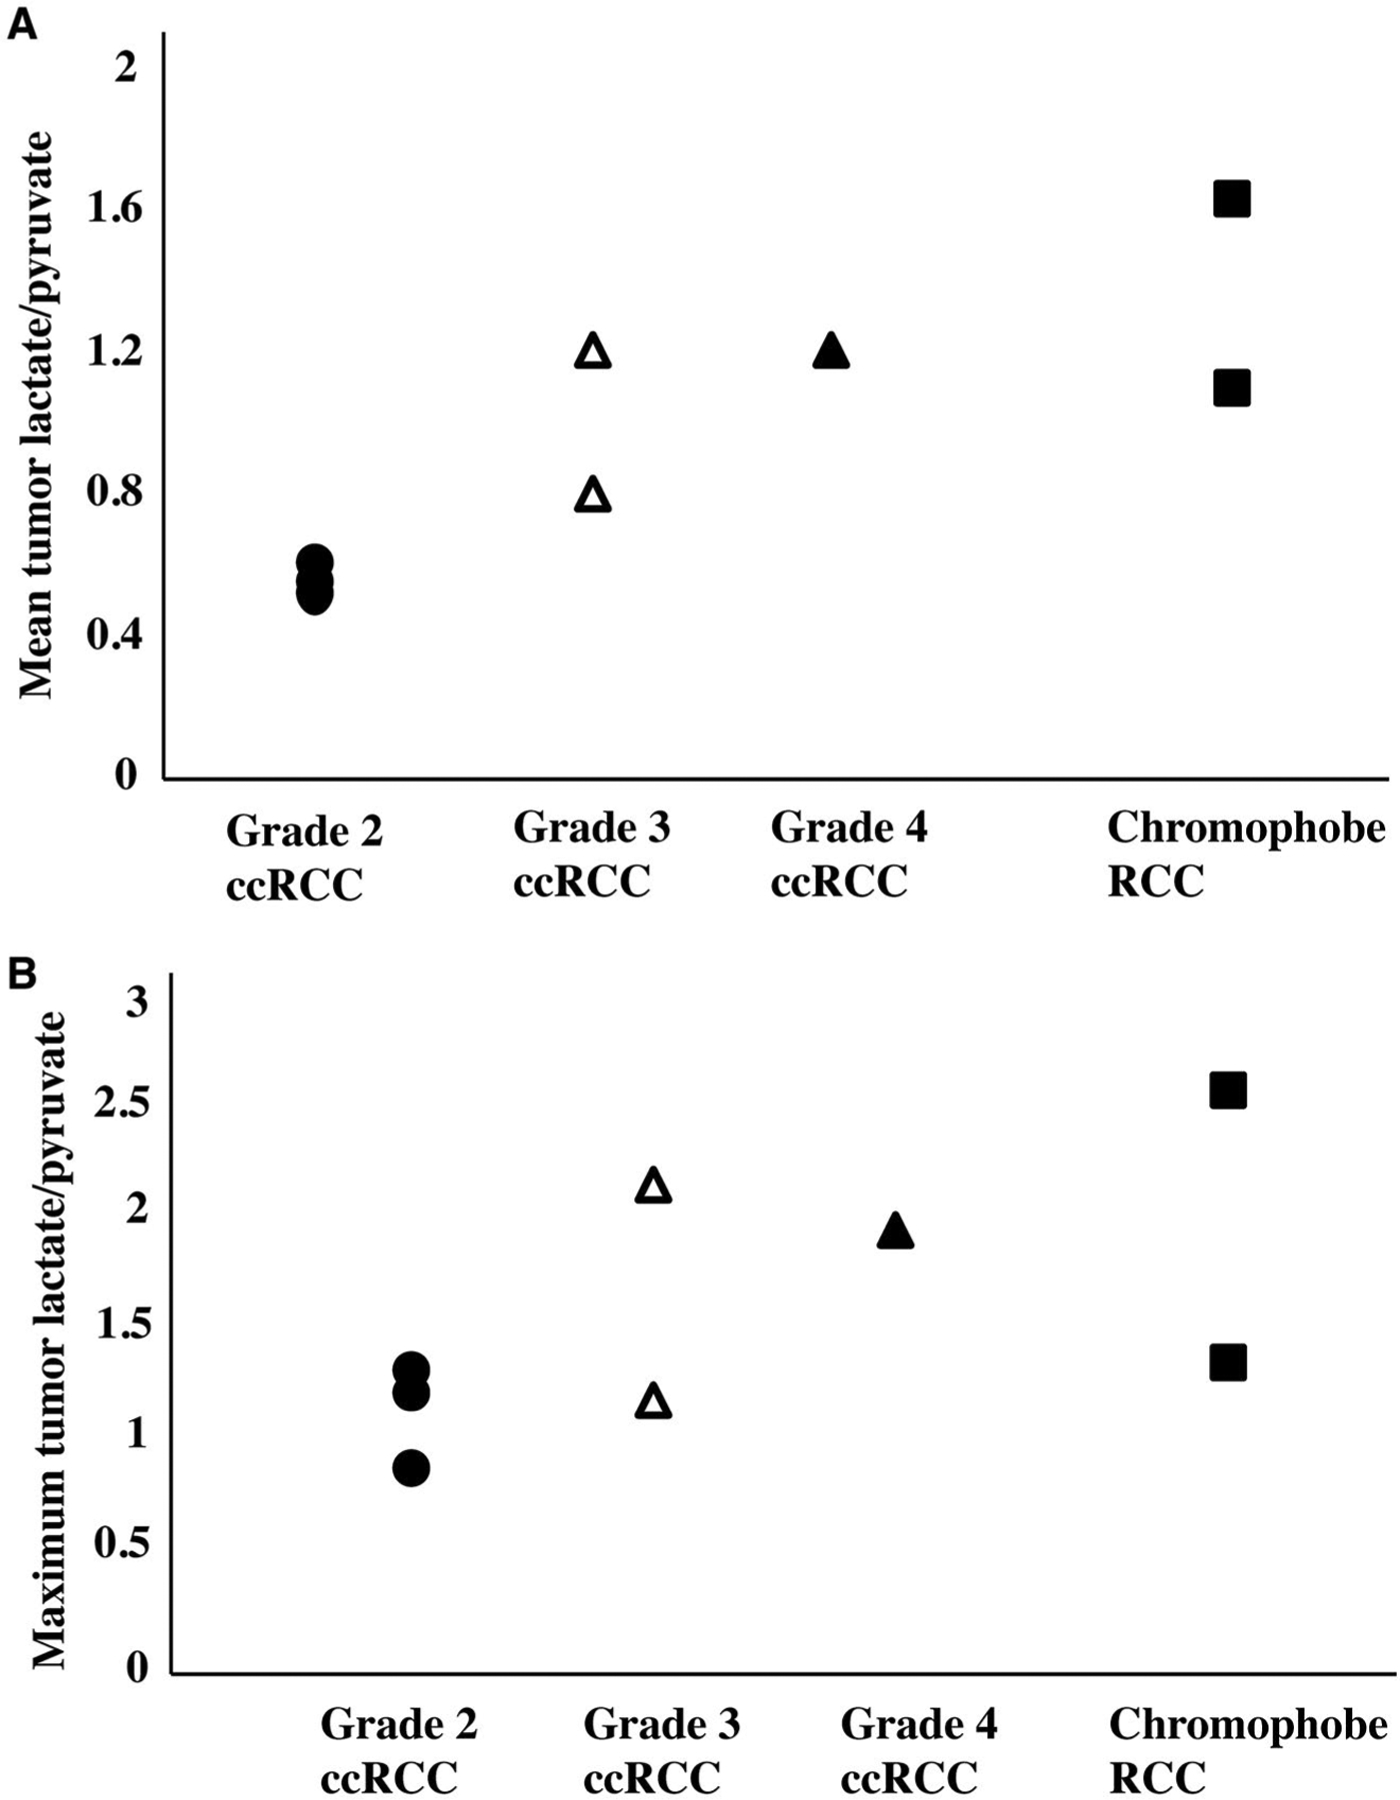
Results: Eight patients had tumors with a sufficient metabolite signal-to-noise ratio for analysis; an insufficient tumor signal-to-noise ratio was noted in 2 patients, likely caused by poor tumor perfusion and, in 1 patient, because of technical errors. Of the 8 patients, 3 had high-grade clear cell renal cell carcinoma (ccRCC), 3 had low-grade ccRCC, and 2 had chromophobe RCC. There was a trend toward a higher lactate-to-pyruvate ratio in high-grade ccRCCs compared with low-grade ccRCCs. Both chromophobe RCCs had relatively high lactate-to-pyruvate ratios. Good reproducibility was noted across the 5 patients who underwent 2 HP 13 C pyruvate MRI scans on the same day.

Conclusions: The current results demonstrate the feasibility of HP 13 C pyruvate MRI for investigating the metabolic phenotype of localized renal tumors. The initial data indicate good reproducibility of metabolite measurements. In addition, the metabolic data indicate a trend toward differentiating low-grade and high-grade ccRCCs, the most common subtype of renal cancer.

Lay summary: Renal tumors are frequently discovered incidentally because of the increased use of medical imaging, but it is challenging to identify which aggressive tumors should be treated. A new metabolic imaging technique was applied to noninvasively predict renal tumor aggressiveness. The imaging results were compared with tumor samples taken during surgery and showed a trend toward differentiating between low-grade and high-grade clear cell renal cell carcinomas, which are the most common type of renal cancers.

Keywords: hyperpolarized 13C; lactate; magnetic resonance imaging; molecular; pyruvate; renal cell carcinoma.


Figures

Figure 1.
Figure 1.
This schematic illustrates the pyruvate-to-lactate metabolic pathway with relevant transporter and enzyme in renal tumors and the information that hyperpolarized 13C pyruvate magnetic resonance imaging provides. LDH indicates lactate dehydrogenase; MCT, monocarboxylase transporter.
Figure 2.
Figure 2.
Representative hyperpolarized 13C pyruvate magnetic resonance images are shown from a man aged 41 years who had 5.8-cm, grade 4 renal cell carcinoma. (A) Area under the curve (AUC) and (B) dynamic images acquired every 4 seconds show a left kidney tumor with increased pyruvate, lactate, and alanine signals compared with adjacent normal parenchyma. The AUC images also show intratumoral metabolic heterogeneity. In the AUC images, the signal-to-noise-ratios of the tumor are 119 for pyruvate, 18 for lactate, and 5.2 for alanine. ROI indicates region of interest.
Figure 3.
Figure 3.
These are area under the curve (AUC) images from hyperpolarized 13C pyruvate magnetic resonance imaging of patients with high-grade (grade 3 and grade 4) clear cell renal cell carcinomas. Tumor AUC values were normalized to AUC values of the adjacent normal parenchyma for each metabolite. Lactate-to-pyruvate ratios were calculated using the normalized AUC signals. All images are displayed using the same color scale. ROI indicates region of interest.
Figure 4.
Figure 4.
These are area under the curve (AUC) images from hyperpolarized 13C pyruvate magnetic resonance imaging of patients with low-grade (grade 2) clear cell renal cell carcinomas. Tumor AUC values were normalized to AUC values of the adjacent normal parenchyma for each metabolite. Lactate-to-pyruvate ratios were calculated using the normalized AUC signals. All images are displayed using the same color scale. ROI indicates region of interest.
Figure 5.
Figure 5.
These area under the curve (AUC) images from hyperpolarized 13C pyruvate magnetic resonance imaging of patients with chromophobe renal cell carcinomas. Tumor AUC values were normalized to AUC values of the adjacent normal parenchyma for each metabolite. Lactate-to-pyruvate ratios were calculated using the normalized AUC signals. All images are displayed using the same color scale. ROI indicates region of interest.
Figure 6.
Figure 6.
The mean and maximum tumor lactate-to-pyruvate ratio is illustrated in 8 patients stratified by tumor histology and grade. The lactate-to-pyruvate ratios are the ratios between the normalized lactate area under the curve values and the normalized pyruvate area under the curve values, Charts depict (A) the mean tumor lactate-to-pyruvate ratio (mean of the lactate-to-pyruvate ratios when averaging all voxels for each tumor) and (B) the maximum lactate-to-pyruvate ratio for each tumor. There is a trend toward higher pyruvate-to-lactate ratio in high-grade (grade 3 and 4) clear cell renal cell carcinomas (ccRCCs) compared with low-grade (grade 2) ccRCCs. Both chromophobe RCCs demonstrate relatively high mean tumor lactate-to-pyruvate ratios; the chromophobe RCC with the highest lactate-to-pyruvate ratio also had a pathologic finding of microscopic necrosis, which has been associated with aggressive biology.

Similar articles

Cited by

References

    1. Hollingsworth JM, Miller DC, Daignault S, Hollenbeck BK. Rising incidence of small renal masses: a need to reassess treatment effect. J Natl Cancer Inst. 2006;98:1331–1334. - PubMed
    1. Welch HG, Skinner JS, Schroeck FR, Zhou W, Black WC. Regional variation of computed tomographic imaging in the United States and the risk of nephrectomy. JAMA Intern Med. 2018;178:221–227. - PMC - PubMed
    1. Rothman J, Egleston B, Wong YN, Iffrig K, Lebovitch S, Uzzo RG. Histopathological characteristics of localized renal cell carcinoma correlate with tumor size: a SEER analysis. J Urol. 2009;181:29–33; discussion 33–24. - PMC - PubMed
    1. Campbell S, Uzzo R, Allaf ME, et al. Renal mass and localized renal cancer: AUA Guideline. J Urol. 2017;198:520–529. - PubMed
    1. Leveridge MJ, Finelli A, Kachura JR, et al. Outcomes of small renal mass needle core biopsy, nondiagnostic percutaneous biopsy, and the role of repeat biopsy. Euro Urol. 2011;60:578–584. - PubMed

Publication types

MeSH terms