. 2021 Apr;129(4):47009.
doi: 10.1289/EHP8368. Epub 2021 Apr 12.

Long-Term Exposure to Fine Particle Elemental Components and Natural and Cause-Specific Mortality-a Pooled Analysis of Eight European Cohorts within the ELAPSE Project

Affiliations

Long-Term Exposure to Fine Particle Elemental Components and Natural and Cause-Specific Mortality-a Pooled Analysis of Eight European Cohorts within the ELAPSE Project

Jie Chen et al. Environ Health Perspect. 2021 Apr.

Abstract

Background: Inconsistent associations between long-term exposure to particles with an aerodynamic diameter 2.5 μm [fine particulate matter (PM2.5)] components and mortality have been reported, partly related to challenges in exposure assessment.

Objectives: We investigated the associations between long-term exposure to PM2.5 elemental components and mortality in a large pooled European cohort; to compare health effects of PM2.5 components estimated with two exposure modeling approaches, namely, supervised linear regression (SLR) and random forest (RF) algorithms.

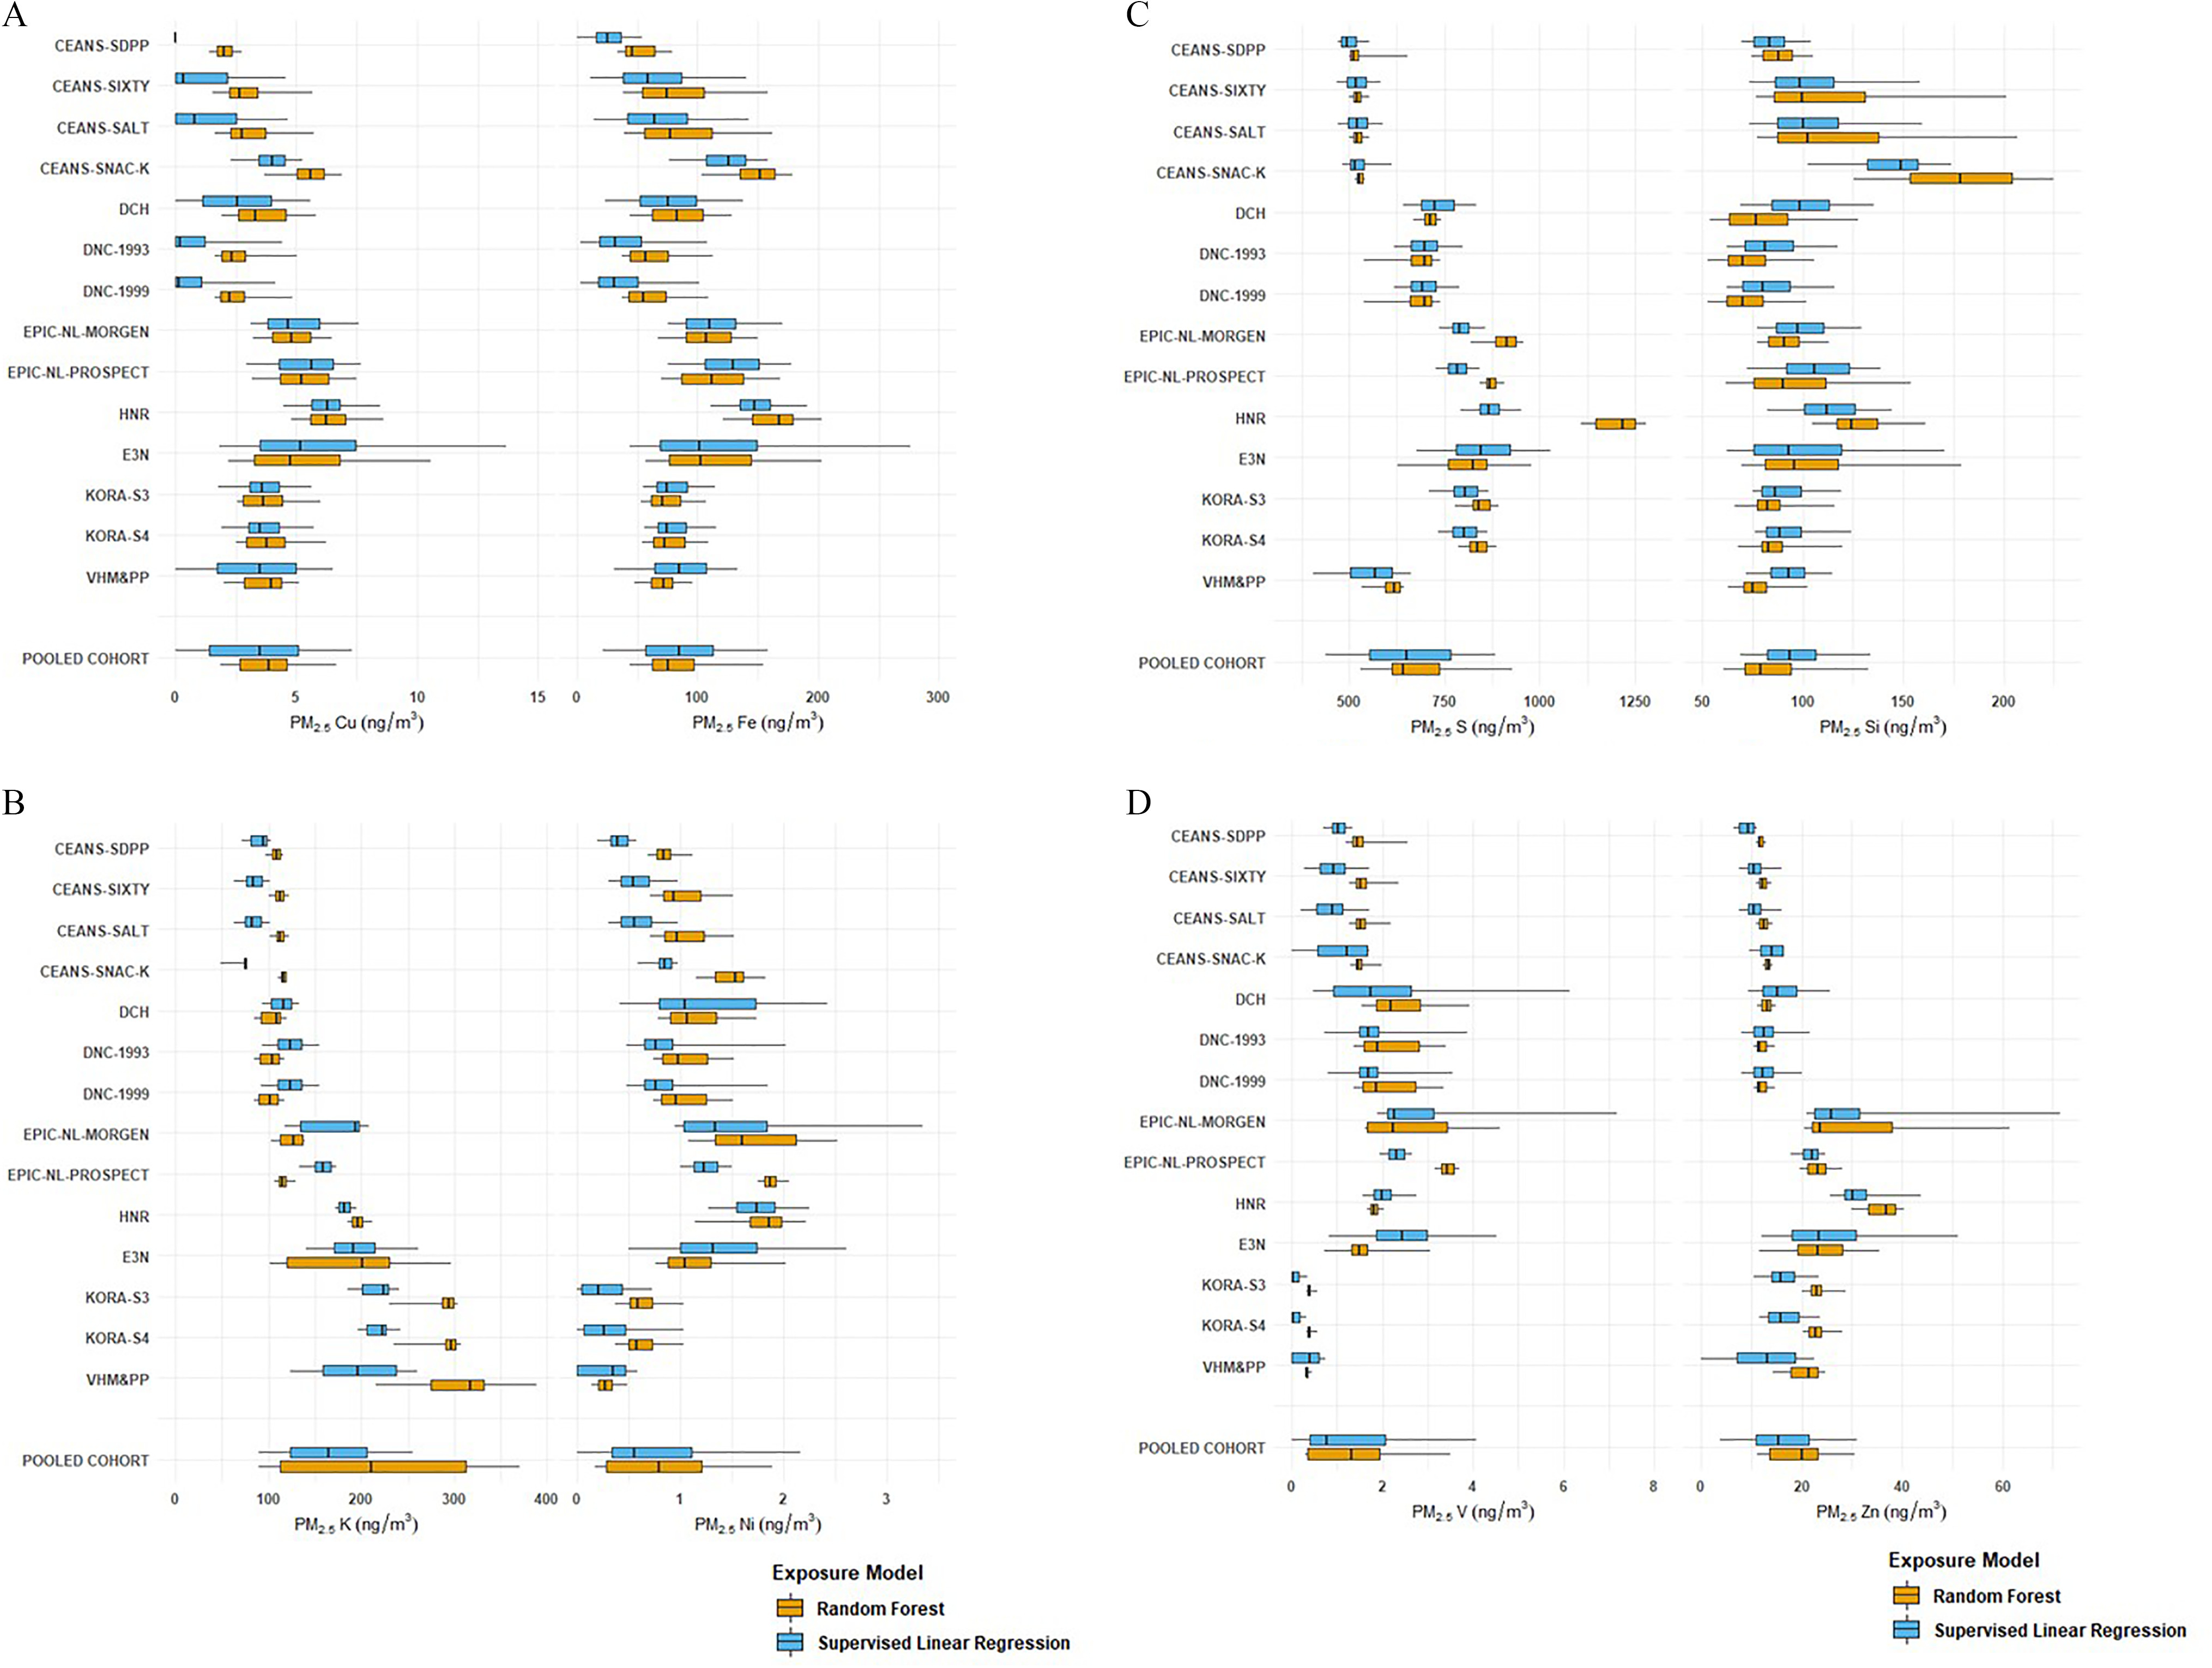
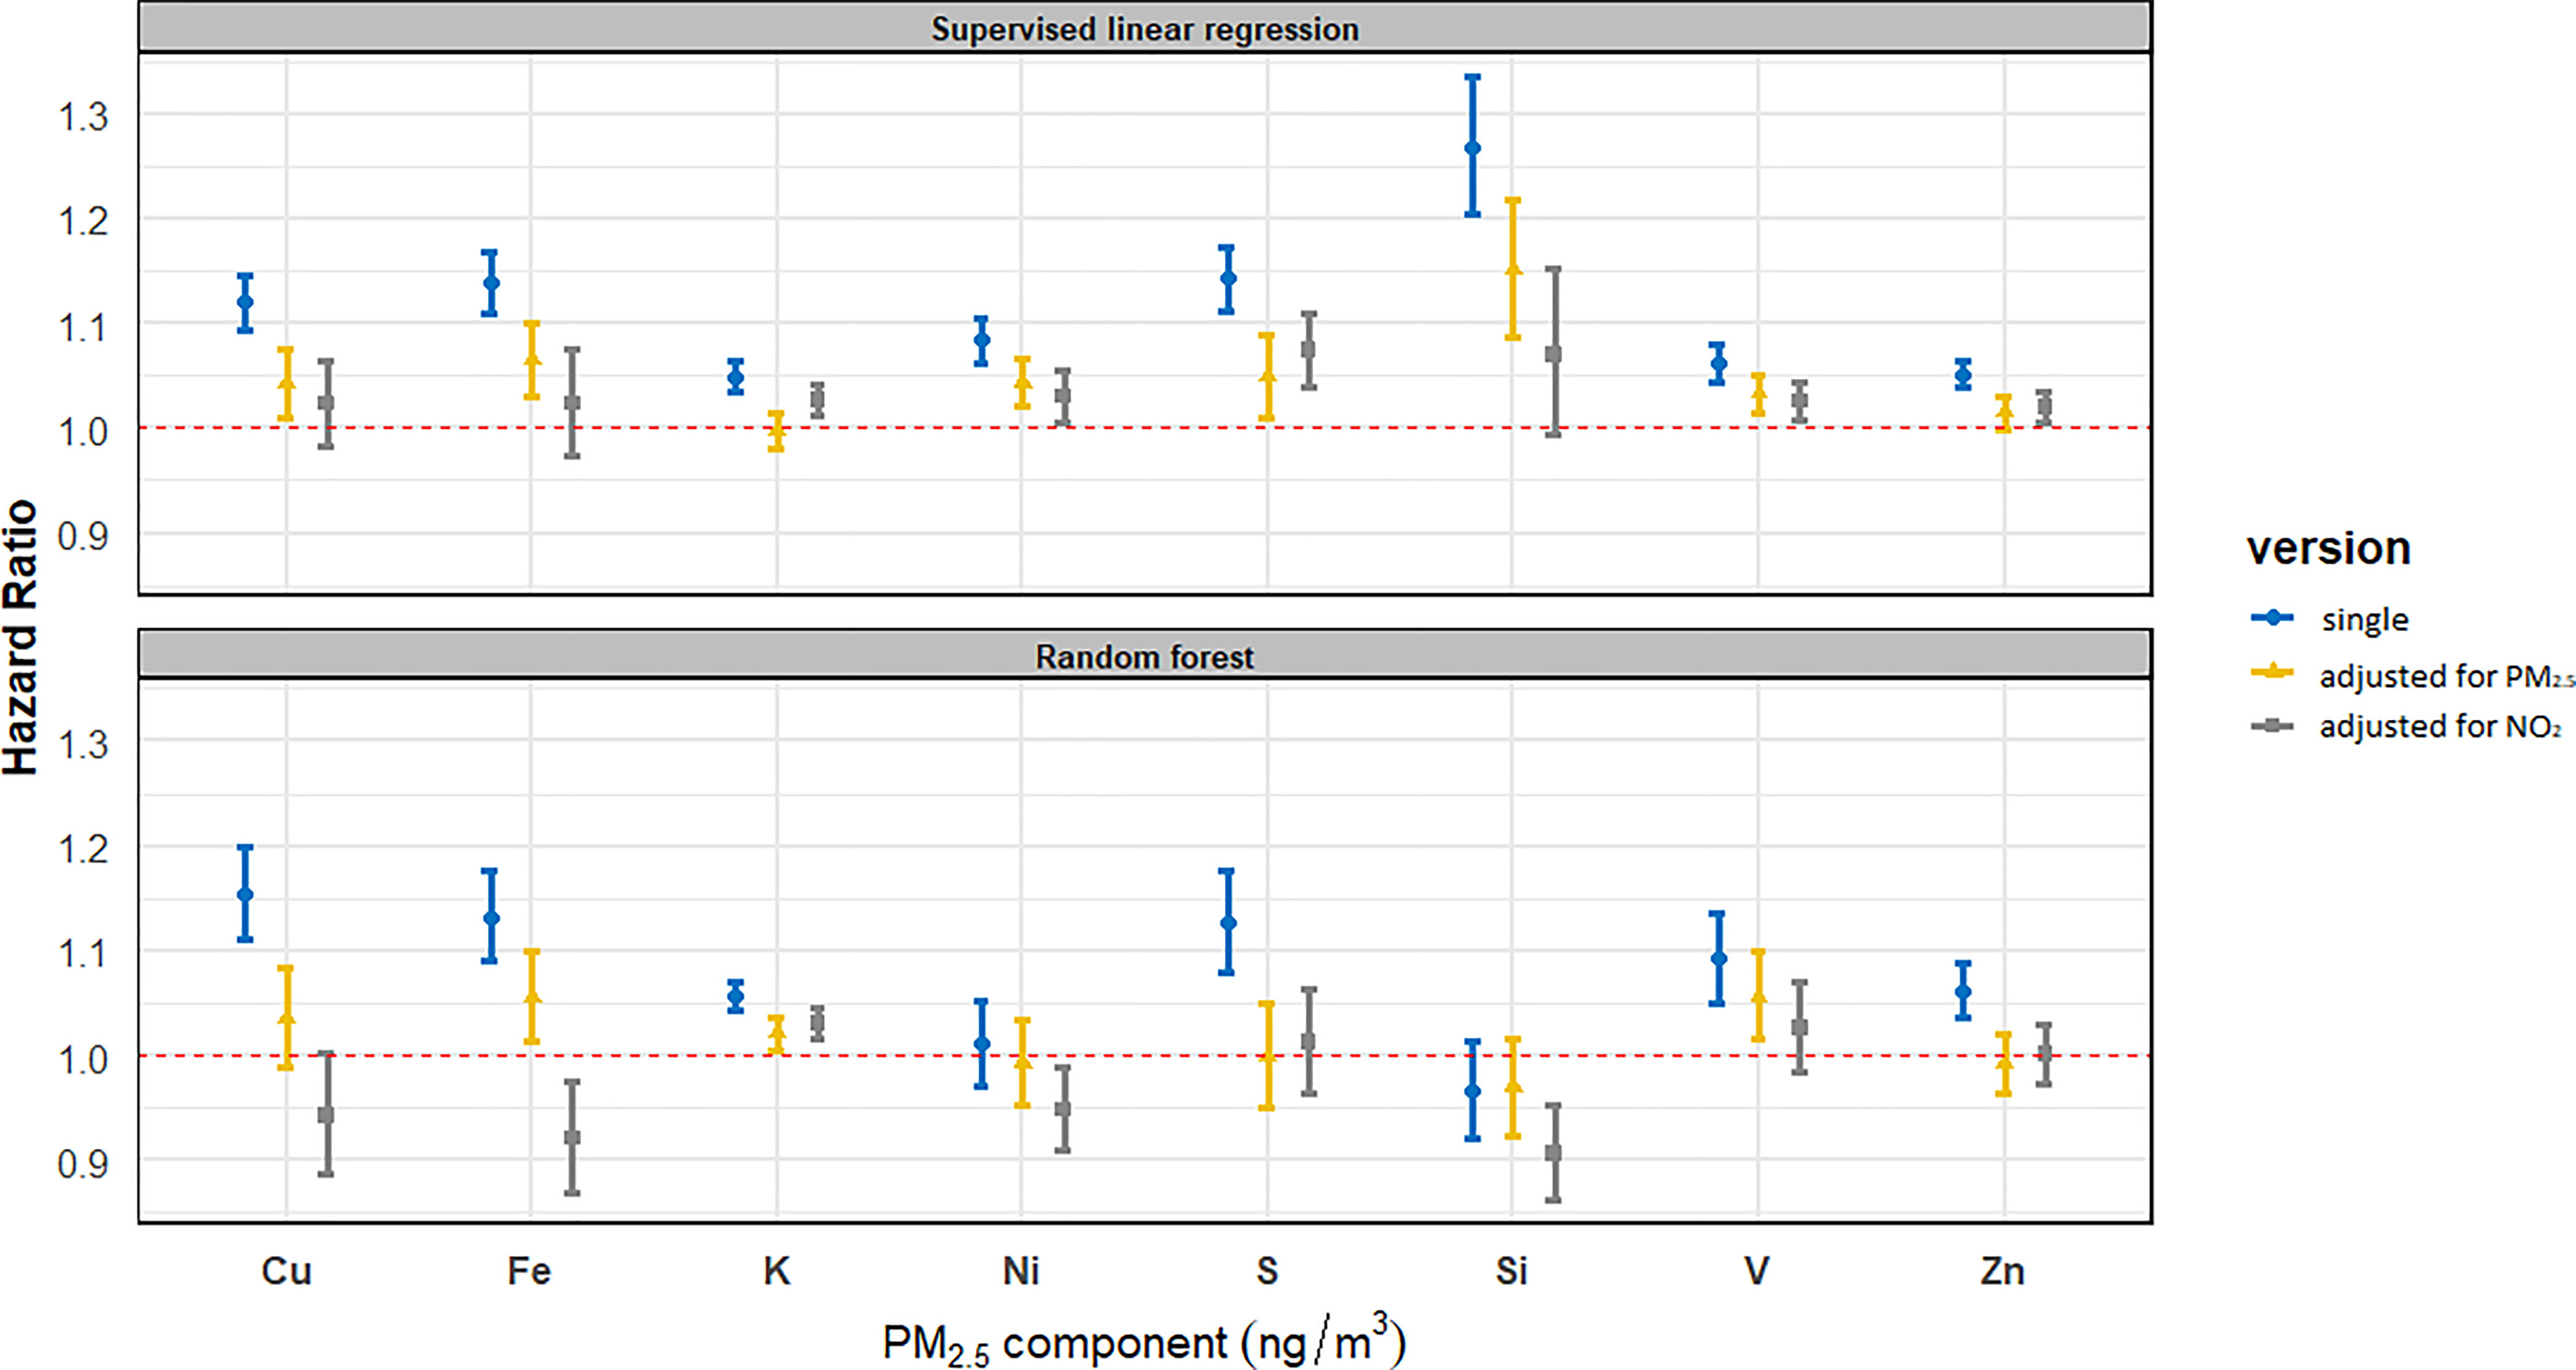
Methods: We pooled data from eight European cohorts with 323,782 participants, average age 49 y at baseline (1985-2005). Residential exposure to 2010 annual average concentration of eight PM2.5 components [copper (Cu), iron (Fe), potassium (K), nickel (Ni), sulfur (S), silicon (Si), vanadium (V), and zinc (Zn)] was estimated with Europe-wide SLR and RF models at a 100×100 m scale. We applied Cox proportional hazards models to investigate the associations between components and natural and cause-specific mortality. In addition, two-pollutant analyses were conducted by adjusting each component for PM2.5 mass and nitrogen dioxide (NO2) separately.

Results: We observed 46,640 natural-cause deaths with 6,317,235 person-years and an average follow-up of 19.5 y. All SLR-modeled components were statistically significantly associated with natural-cause mortality in single-pollutant models with hazard ratios (HRs) from 1.05 to 1.27. Similar HRs were observed for RF-modeled Cu, Fe, K, S, V, and Zn with wider confidence intervals (CIs). HRs for SLR-modeled Ni, S, Si, V, and Zn remained above unity and (almost) significant after adjustment for both PM2.5 and NO2. HRs only remained (almost) significant for RF-modeled K and V in two-pollutant models. The HRs for V were 1.03 (95% CI: 1.02, 1.05) and 1.06 (95% CI: 1.02, 1.10) for SLR- and RF-modeled exposures, respectively, per 2 ng/m3, adjusting for PM2.5 mass. Associations with cause-specific mortality were less consistent in two-pollutant models.

Conclusion: Long-term exposure to V in PM2.5 was most consistently associated with increased mortality. Associations for the other components were weaker for exposure modeled with RF than SLR in two-pollutant models. https://doi.org/10.1289/EHP8368.


Figures

Figures 1A and 1B are each two sets of two forest plots plotting Cardiovascular Effects of Air Pollution and Noise in Stockholm-Stockholm Diabetes Prevention Program; Cardiovascular Effects of Air Pollution and Noise in Stockholm-Stockholm Cohort of 60-Year-Olds; Cardiovascular Effects of Air Pollution and Noise in Stockholm-Stockholm Screening Across the Lifespan Twin study; Cardiovascular Effects of Air Pollution and Noise in Stockholm-Swedish National Study on Aging and Care in Kungsholmen; Diet, Cancer and Health cohort; Danish Nurse Cohort–1993; Danish Nurse Cohort–1999; European Prospective Investigation into Cancer and Nutrition-Netherlands-Monitoring Project on Risk Factors and Chronic Diseases in the Netherlands; European Prospective Investigation into Cancer and Nutrition-Netherlands-Prospect; Heinz Nixdorf Recall study; Etude Epidémiologique auprès de femmes de la Mutuelle Générale de l’Education Nationale; Cooperative Health Research in the Region of Augsburg; Vorarlberg Health Monitoring and Prevention Program; and Pooled Cohort (y-axis) across fine particulate matter Copper (nanograms per meter cubed), ranging for 0 to 15 in increments of 5; fine particulate matter Iron (nanograms per meter cubed), ranging from 0 to 300 in increments of 100; fine particulate matter Potassium (nanograms per meter cubed), ranging from 0 to 400 in increments of 100; and fine particulate matter Nickel (nanograms per meter cubed), ranging from 0 to 3 in unit increments (x-axis) for random forest and supervised linear regression, respectively. Figures 1C and 1 D are each two sets of two forest plots plotting Cardiovascular Effects of Air Pollution and Noise in Stockholm-Stockholm Diabetes Prevention Program; Cardiovascular Effects of Air Pollution and Noise in Stockholm-Stockholm Cohort of 60-Year-Olds; Cardiovascular Effects of Air Pollution and Noise in Stockholm-Stockholm Screening Across the Lifespan Twin study; Cardiovascular Effects of Air Pollution and Noise in Stockholm-Swedish National Study on Aging and Care in Kungsholmen; Diet, Cancer and Health cohort; Danish Nurse Cohort–1993; Danish Nurse Cohort–1999; European Prospective Investigation into Cancer and Nutrition-Netherlands-Monitoring Project on Risk Factors and Chronic Diseases in the Netherlands; European Prospective Investigation into Cancer and Nutrition-Netherlands-Prospect; Heinz Nixdorf Recall study; Etude Epidémiologique auprès de femmes de la Mutuelle Générale de l’Education Nationale; Cooperative Health Research in the Region of Augsburg; Vorarlberg Health Monitoring and Prevention Program; and Pooled Cohort (y-axis) across fine particulate matter sulfur (nanograms per meter cubed), ranging from 500 to 1,250 in increments of 250; fine particulate matter Silicon sulfur (nanograms per meter cubed), ranging from 50 to 200 in increments of 50; fine particulate matter Vanadium nanograms per meter cubed), ranging from 0 to 8 in increments of 2; and fine particulate matter Zinc (nanogram pers meter cubed), ranging from 0 to 60 in increments of 20 for random forest and supervised linear regression, respectively.
Figure 1.
Distribution of component exposure at participant addresses estimated from supervised linear regression and random forest models. (A) PM2.5 copper and PM2.5 iron; (B) PM2.5 potassium and PM2.5 nickel; (C) PM2.5 sulfur and PM2.5 silicon; and (D) PM2.5 vanadium and PM2.5 zinc. The boundary of the box closest to zero indicates P25; the boundary of the box furthest from zero, P75; the bold vertical line inside the box, P50; and the whiskers, P5 and P95. (See Table S11 for exposure distribution of components for the pooled cohort.) Subcohorts are shown from North to South. Note: P, percentile; PM2.5, fine particulate matter.
Figure 2 is a set of two error bar graphs titled supervised linear regression and random forest plotting hazard ratio, ranging from 0.9 to 1.3 in increments of 0.1 (y-axis) across fine particulate matter component (nanograms per meter cubed), including Copper, Iron, Potassium, Nickel, Sulfur, Silicon, Vanadium, and Zinc (x-axis) for single, adjusted for fine particulate matter, and adjusted for nitrogen dioxide, respectively.
Figure 2.
Associations of PM2.5 composition with natural mortality in single-pollutant and two-pollutant models in SLR and RF analyses. Total number of observations=323,782; person-years at risk=6,317,235; number of deaths from natural mortality=46,640. HRs (95% CIs) are presented for the following increments: PM2.5 Cu, 5ng/m3; PM2.5 Fe, 100ng/m3; PM2.5 K, 50ng/m3; PM2.5 Ni, 1ng/m3; PM2.5 S, 200ng/m3; PM2.5 Si, 100ng/m3; PM2.5 V, 2ng/m3; PM2.5 Zn, 10ng/m3. (See Table S14 for corresponding numeric data.) The main model was adjusted for subcohort identification, age, sex, year of enrollment, smoking (status, duration, intensity, and intensity2), BMI categories, marital status, employment status, and 2001 neighborhood-level mean income. In two-pollutant models, PM2.5 mass and NO2 exposures were estimated using SLR only. Note: BMI, body mass index; CI, confidence interval; Cu, copper; Fe, iron; HR, hazard ratio; K, potassium; Ni, nickel; PM2.5, fine particulate matter; RF, random forest; S, sulfur; Si, silicon; SLR, supervised linear regression; V, vanadium; Zn, zinc.

Similar articles

Cited by

References

    1. Adams K, Greenbaum DS, Shaikh R, van Erp AM, Russell AG. 2015. Particulate matter components, sources, and health: systematic approaches to testing effects. J Air Waste Manag Assoc 65(5):544–558, PMID: 25947313, 10.1080/10962247.2014.1001884. - DOI - PubMed
    1. Adar SD, Filigrana PA, Clements N, Peel JL. 2014. Ambient coarse particulate matter and human health: a systematic review and meta-analysis. Curr Environ Health Rep 1(3):258–274, PMID: 25152864, 10.1007/s40572-014-0022-z. - DOI - PMC - PubMed
    1. Armstrong BG. 1998. Effect of measurement error on epidemiological studies of environmental and occupational exposures. Occup Environ Med 55(10):651–656, PMID: 9930084, 10.1136/oem.55.10.651. - DOI - PMC - PubMed
    1. Badaloni C, Cesaroni G, Cerza F, Davoli M, Brunekreef B, Forastiere F, et al. . 2017. Effects of long-term exposure to particulate matter and metal components on mortality in the Rome longitudinal study. Environ Int 109:146–154, PMID: 28974306, 10.1016/j.envint.2017.09.005. - DOI - PubMed
    1. Basagaña X, Aguilera I, Rivera M, Agis D, Foraster M, Marrugat J, et al. . 2013. Measurement error in epidemiologic studies of air pollution based on land-use regression models. Am J Epidemiol 178(8):1342–1346, PMID: 24105967, 10.1093/aje/kwt127. - DOI - PubMed

Publication types

LinkOut - more resources