. 2021 Aug 1:236:117967.
doi: 10.1016/j.neuroimage.2021.117967. Epub 2021 Apr 29.

Measuring compartmental T2-orientational dependence in human brain white matter using a tiltable RF coil and diffusion-T2 correlation MRI

Affiliations

Measuring compartmental T2-orientational dependence in human brain white matter using a tiltable RF coil and diffusion-T2 correlation MRI

Chantal M W Tax et al. Neuroimage. .

Abstract

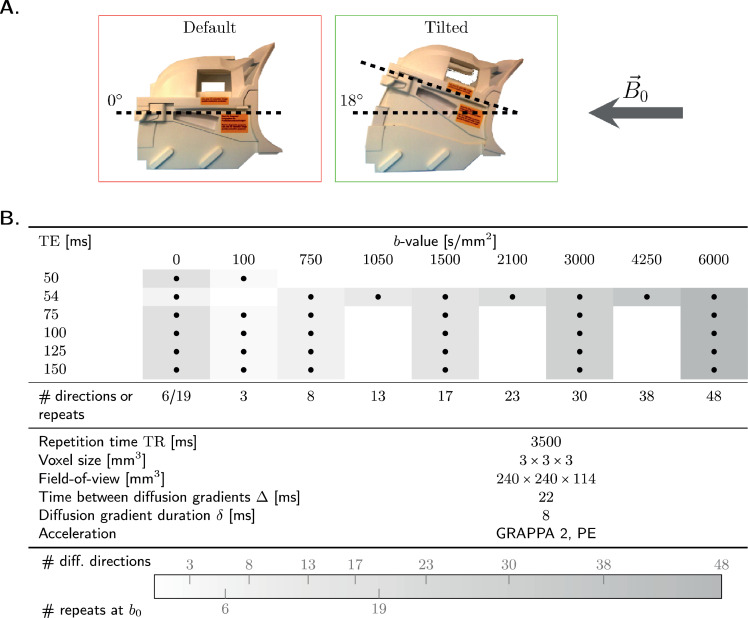
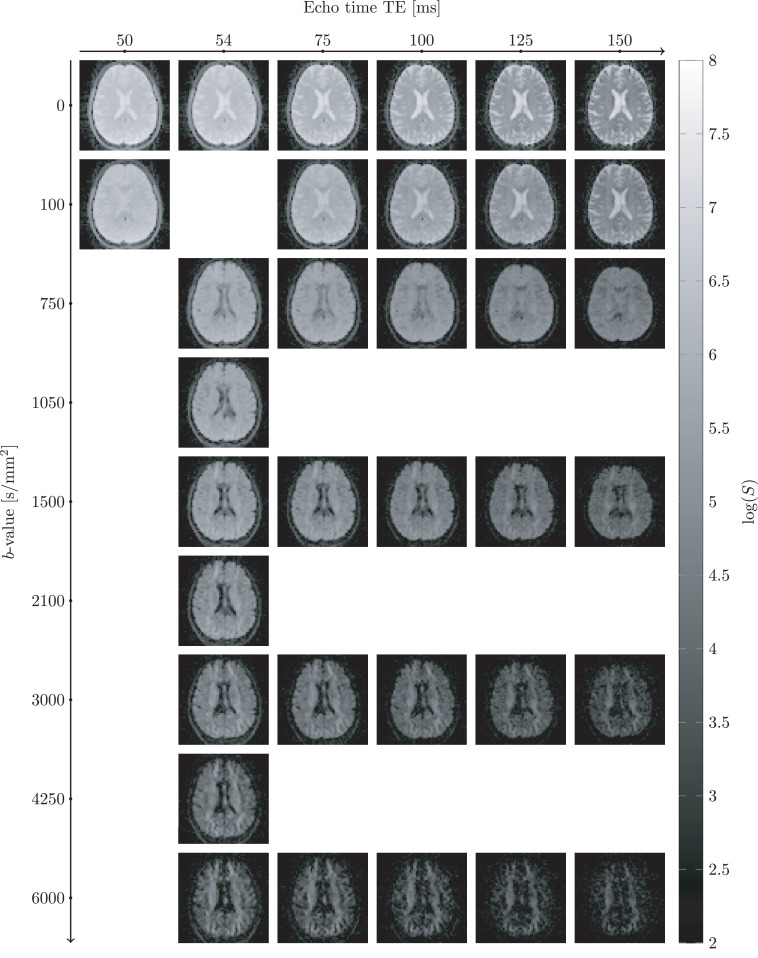
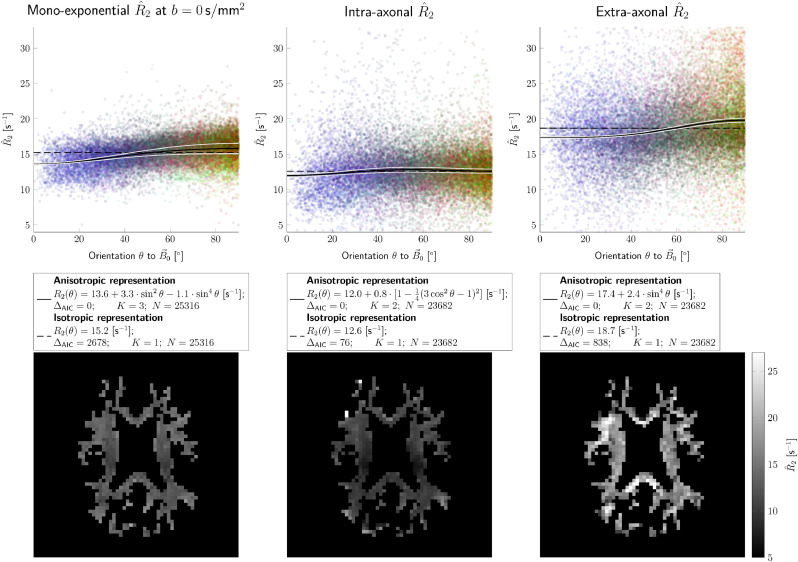
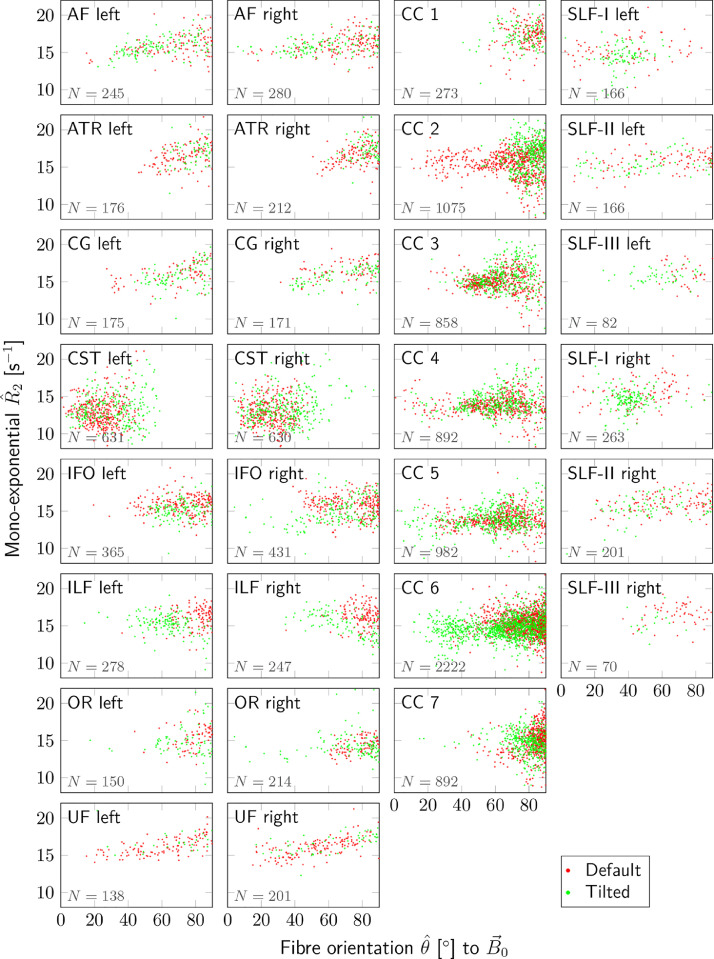
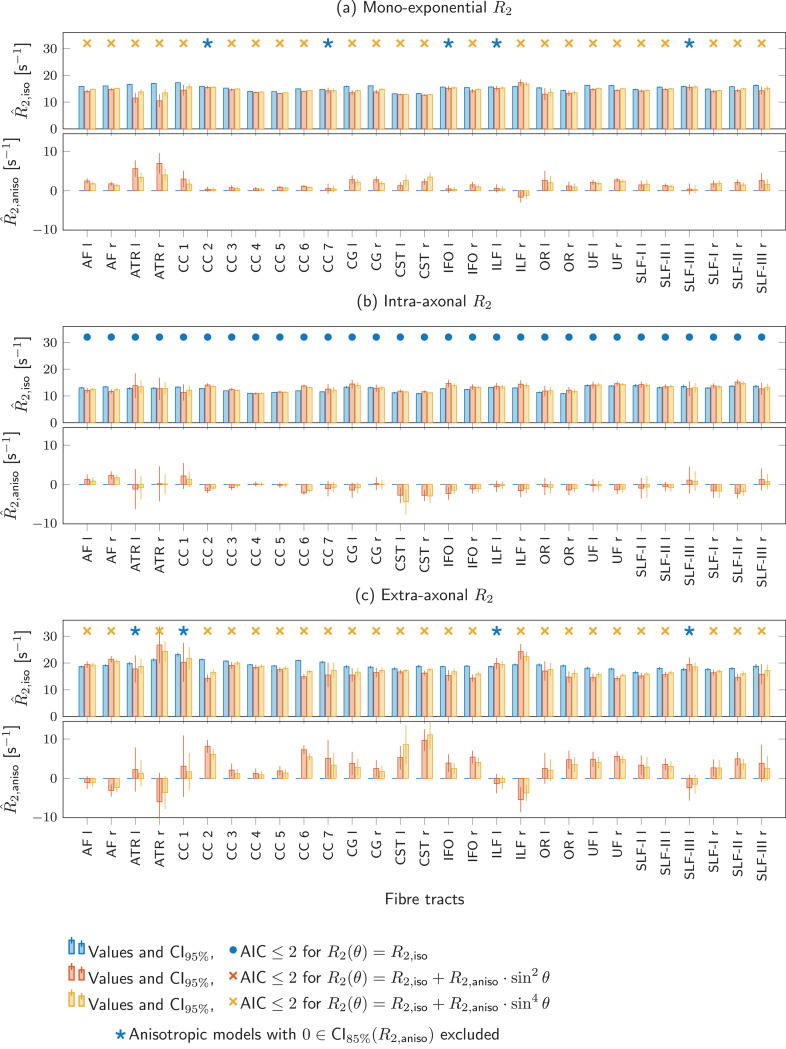
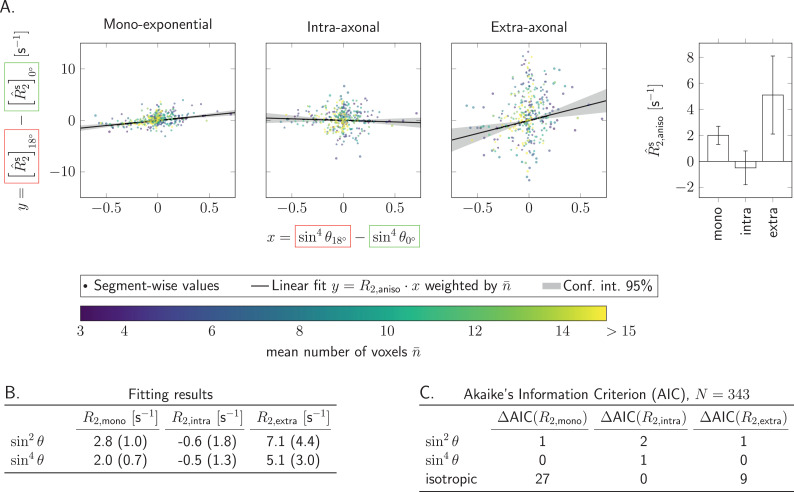
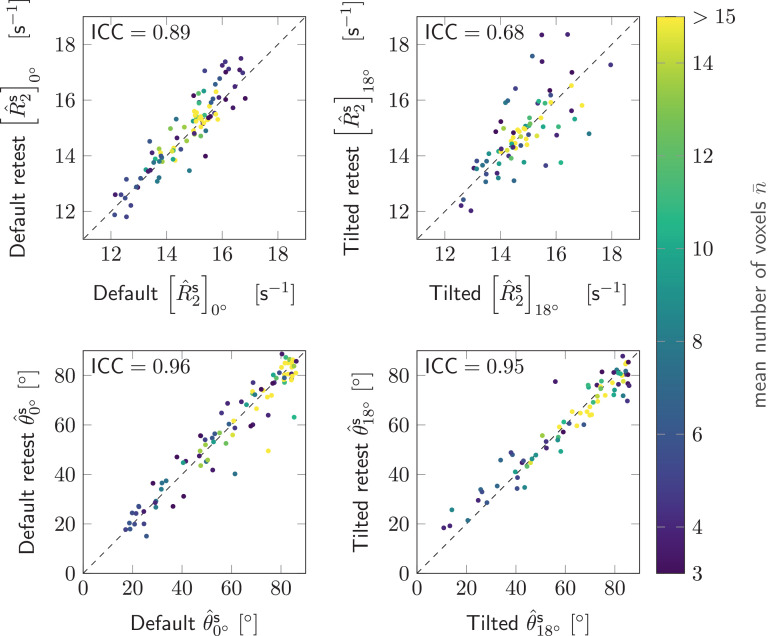
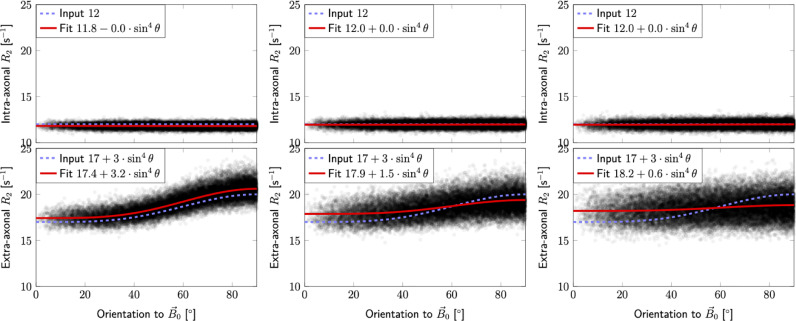
The anisotropy of brain white matter microstructure manifests itself in orientational-dependence of various MRI contrasts, and can result in significant quantification biases if ignored. Understanding the origins of this orientation-dependence could enhance the interpretation of MRI signal changes in development, ageing and disease and ultimately improve clinical diagnosis. Using a novel experimental setup, this work studies the contributions of the intra- and extra-axonal water to the orientation-dependence of one of the most clinically-studied parameters, apparent transverse relaxation T2. Specifically, a tiltable receive coil is interfaced with an ultra-strong gradient MRI scanner to acquire multidimensional MRI data with an unprecedented range of acquisition parameters. Using this setup, compartmental T2 can be disentangled based on differences in diffusional-anisotropy, and its orientation-dependence further elucidated by re-orienting the head with respect to the main magnetic field B→0. A dependence of (compartmental) T2 on the fibre orientation w.r.t. B→0 was observed, and further quantified using characteristic representations for susceptibility- and magic angle effects. Across white matter, anisotropy effects were dominated by the extra-axonal water signal, while the intra-axonal water signal decay varied less with fibre-orientation. Moreover, the results suggest that the stronger extra-axonal T2 orientation-dependence is dominated by magnetic susceptibility effects (presumably from the myelin sheath) while the weaker intra-axonal T2 orientation-dependence may be driven by a combination of microstructural effects. Even though the current design of the tiltable coil only offers a modest range of angles, the results demonstrate an overall effect of tilt and serve as a proof-of-concept motivating further hardware development to facilitate experiments that explore orientational anisotropy. These observations have the potential to lead to white matter microstructural models with increased compartmental sensitivity to disease, and can have direct consequences for longitudinal and group-wise T2- and diffusion-MRI data analysis, where the effect of head-orientation in the scanner is commonly ignored.

Keywords: relaxation; Diffusion MRI; Directional anisotropy; Microstructure; Myelin susceptibility.


Figures

Fig. 1
Fig. 1
A. Data were acquired for each participant with the coil in default (0) and tilted (18) position with respect to the magnetic field B0. B. Acquisition parameters for the diffusion-T2-correlation experiment: combinations of b-values and echo times TE used in this study are marked with a -symbol. Number of diffusion directions or repetitions at b0 is colour-coded for each b- and TE-value. The diffusion gradient duration δ and time between diffusion gradients Δ were kept fixed for all TE.
Fig. 2
Fig. 2
The diffusion-T2 correlation data were acquired by simultaneously varying b-value and the echo time TE in a diffusion-weighted spin-echo EPI sequence. The example data were acquired in default head orientation with diffusion gradients aligned with the superior-inferior axis.
Fig. 3
Fig. 3
Distributions of the signal (left column) and temporal SNR (tSNR, right column) in white matter from the data acquired at b=0s/mm2 and TE=54ms in all subjects (rows) for two receive-coil orientations: default in red and tilted in green. For the first subject, default retest (cyan) and tilted retest (blue) signal- and SNR distributions are also shown. Total number of WM voxels for each subject and each head orientation are noted next to the corresponding distribution in the left column.
Fig. 4
Fig. 4
Mono-exponential, intra- and extra-axonal relaxation parameter estimates in SFP voxels across the white matter (columns from left to right, respectively). The top row shows R^2-values from all subjects in both head orientations plotted against fibre orientation θ^ to B0. Colours represent fibre orientations in scanner coordinates (red,blue and green stand for left-right (LR), superior-inferior (SI) and anterior-posterior (AP), respectively). The black solid lines represent the best fitting curves, while the dashed lines indicate the isotropic case (i.e. R2,aniso1=R2,aniso2=0 in Eq. 2). The white lines outline 95% confidence intervals. The best fitting functions, ΔAIC, number of fitting parameters K, and number of fitting points N, are displayed in the legend. The bottom row shows examples of corresponding R^2-maps in WM from a single subject in the default head orientation.
Fig. 5
Fig. 5
Mono-exponential relaxation rates R^2 estimated from data acquired at b0 are plotted against fibre orientation θ^ to the magnetic field B0 for default (red) and tilted (green) head orientations. Each point represents one of the SFP voxels from one of 29 fibre tracts (separate plots, fibre tract name in top left corner) in each subject. Total number, N, of voxels included from all subjects and orientations for each tract is indicated in bottom left corner of each plot. Evidently, adding an acquisition in the tilted position enables the exploration of a wider range of angles θ compared to the default position along various tracts.
Fig. 6
Fig. 6
Isotropic and anisotropic components of (a) mono-exponential, (b) intra-axonal, or (c) extra-axonal R2(θ) were simultaneously estimated from default and tilted data from all subjects for each fibre tract using R2(θ)=R2,iso+f(θ), where f(θ) was i) 0 (blue ); ii) R2,aniso·sin2θ (red ×); and iii) R2,aniso·sin4θ (yellow ×). Top and bottom plots show bar plots and 95% confidence bounds of the isotropic component R2,iso and the magnitude of anisotropy R2,aniso, respectively. Symbols , and × above grouped bar-plots for each fibre tract indicate which model outperformed the others (lowest AIC), and symbol highlights those tracts for which the 85% confidence interval of R2,aniso included 0 for both anisotropic models.
Fig. 7
Fig. 7
Relaxation anisotropy was probed segment-wise by comparing values estimated in the default and tilted coil-orientations in segments 5 to 16 and with at least 3 voxels per segment. A. Differences between per-segment R^2s(θ)-values y=[R^2s]0[R^2s]18 were plotted against differences in corresponding sin4θ-values for mono-exponential (estimated at b=0s/mm2), intra- and extra-axonal R2-values. Colours correspond to the number of voxels n¯ per segment, averaged between the default and tilted head positions. The magnitude of anisotropy R^2,anisos was estimated from the linear fit y=R^2,anisos·x, where x=sin4θ^0ssin4θ^18s. The resulting R^2,anisos-values are shown in the bar plot on the right hand side, along with the corresponding 95% confidence intervals. The tables list fitting results for anisotropic representations with sin2θ and sin4θ terms (B.), and the effective AIC values (ΔAIC=AICAICmin) for each representation including isotropic x=0 for mono-exponential, intra- and extra-axonal R^2-values (C.). Number of data points included in the fitting was N=343.
Fig. 8
Fig. 8
Repeatibility of estimates was investigated from the test-retest data acquired in one subject in default (left column) and tilted (right column) coil-orientations. Each data point represents a single tract segment with its test value along the horizontal axis and retest value along the vertical axis. The test and retest estimates are plotted for R^2,ms (top row) and the fibre orientation θ^s to B0 (bottom row). The colours correspond to the number of voxels per segment, averaged between the default and tilted head positions. Intraclass correlation coefficients (ICC) are included in the top left corner of each plot.
Fig. 9
Fig. 9
Simulated orientation dispersion of 0 (left), 0.16 (middle), and 0.32 (right) respectively, as described in Appendix A.2. Note that the estimation procedure (Appendix A.1) only captures the effect of orientation dispersion in the diffusion dimension. An under-estimation of R2,aniso can be observed as OD increases. Remaining simulation parameters (see also Supplementary materials): intra-axonal R2,i(θ)=12s1, anisotropic extra-axonal R2,e(θ)=17+3·sin2θ, signal fraction f=0.5, intra-axonal parallel, and extra-axonal parallel and perpendicular diffusivities D,i=2.5μm2/ms,D,e=2μm2/ms, and D,e=0.8μm2/ms, respectively. Gaussian noise was added to the signal with the default SNR input parameters of SNR=100 on the S(0,0) signal corresponding to SNR50 on the S(0,54) signal assuming T270 ms. The angles and number of points were taken from the data analysed in this work (cf Fig. 4). An under-estimation of R2,aniso can be observed as OD increases.

Similar articles

Cited by

References

    1. Abragam A. Oxford university press; 1961. The Principles of Nuclear Magnetism 32.
    1. Akaike H. A new look at the statistical model identification. IEEE Trans. Autom. Control. 1974;19(6):716–723.
    1. Alexander D.C. A general framework for experiment design in diffusion MRI and its application in measuring direct tissue-microstructure features. Magn. Reson. Med. 2008;60(2):439–448. doi: 10.1002/mrm.21646. - DOI - PubMed
    1. de Almeida Martins J.P., Tax C.M.W., Reymbaut A., Szczepankiewicz F., Chamberland M., Jones D.K., Topgaard D. Computing and visualising intra-voxel orientation-specific relaxation–diffusion features in the human brain. Hum. Brain Mapp. 2020 - PMC - PubMed
    1. de Almeida Martins J.P., Tax C.M.W., Szczepankiewicz F., Jones D.K., Westin C.-F., Topgaard D. Transferring principles of solid-state and laplace nmr to the field of in vivo brain mri. Magn. Reson. 2020;1(1):27–43. doi: 10.5194/mr-1-27-2020. - DOI - PMC - PubMed

Publication types