

Gene coexpression network approach to develop an immune prognostic model for pancreatic adenocarcinoma
- PMID: 33845841
- PMCID: PMC8042890
- DOI: 10.1186/s12957-021-02201-w
Gene coexpression network approach to develop an immune prognostic model for pancreatic adenocarcinoma
Abstract
Background: Pancreatic adenocarcinoma (PAAD) is a nonimmunogenic tumor, and very little is known about the relationship between the host immune response and patient survival. We aimed to develop an immune prognostic model (IPM) and analyze its relevance to the tumor immune profiles of patients with PAAD.
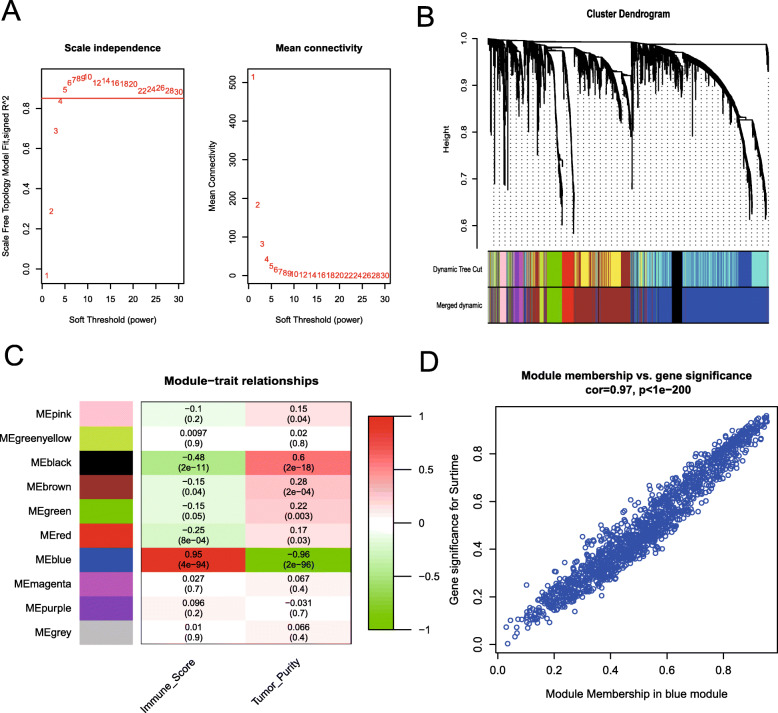
Methods: We investigated differentially expressed genes between tumor and normal tissues in the TCGA PAAD cohort. Immune-related genes were screened from highly variably expressed genes with weighted gene correlation network analysis (WGCNA) to construct an IPM. Then, the influence of IPM on the PAAD immune profile was comprehensively analyzed.
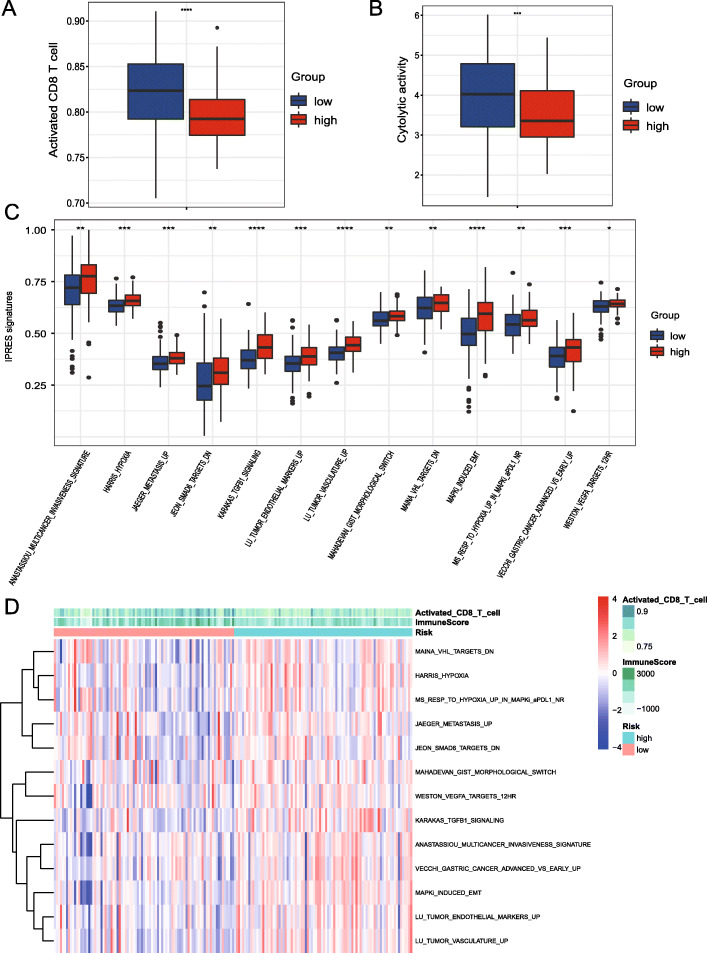
Results: A total of 4902 genes highly variably expressed among primary tumors were used to construct a weighted gene coexpression network. One hundred seventy-five hub genes in the immune-related module were used for machine learning. Then, we established an IPM with four core genes (FCGR2B, IL10RA, and HLA-DRA) to evaluate the prognosis. The risk score predicted by IPM was an independent prognostic factor and had a high predictive value for the prognosis of patients with PAAD. Moreover, we found that the patients in the low-risk group had higher cytolytic activity and lower innate anti-PD-1 resistance (IPRES) signatures than patients in the high-risk group.
Conclusions: Unlike the traditional methods that use immune-related genes listed in public databases to screen prognostic genes, we constructed an IPM through WGCNA to predict the prognosis of PAAD patients. In addition, an IPM prediction of low risk indicated enhanced immune activity and a decreased anti-PD-1 therapeutic response.
Keywords: Immune profile; Immune prognostic model; Immunotherapy; Pancreatic cancer; WGCNA.
Conflict of interest statement
No conflicts of interest exist in the submission of this manuscript, and the manuscript has been approved by all authors for publication.
Figures

Similar articles
-
CD8 + T-Cell-Related Genes: Deciphering Their Role in the Pancreatic Adenocarcinoma TME and Their Effect on Prognosis.Dig Dis Sci. 2025 Jan;70(1):262-284. doi: 10.1007/s10620-024-08715-z. Epub 2024 Nov 27. Dig Dis Sci. 2025. PMID: 39604668
-
Identification of novel potential homologous repair deficiency-associated genes in pancreatic adenocarcinoma via WGCNA coexpression network analysis and machine learning.Cell Cycle. 2023 Nov;22(21-22):2392-2408. doi: 10.1080/15384101.2023.2293594. Epub 2024 Jan 18. Cell Cycle. 2023. PMID: 38124367 Free PMC article.
-
Development and Validation of an Inflammatory Response-Related Gene Signature for Predicting the Prognosis of Pancreatic Adenocarcinoma.Inflammation. 2022 Aug;45(4):1732-1751. doi: 10.1007/s10753-022-01657-6. Epub 2022 Mar 23. Inflammation. 2022. PMID: 35322324
-
Identify potential prognostic indicators and tumor-infiltrating immune cells in pancreatic adenocarcinoma.Biosci Rep. 2022 Feb 25;42(2):BSR20212523. doi: 10.1042/BSR20212523. Biosci Rep. 2022. PMID: 35083488 Free PMC article. Review.
-
GPCRs in pancreatic adenocarcinoma: Contributors to tumour biology and novel therapeutic targets.Br J Pharmacol. 2020 Jun;177(11):2434-2455. doi: 10.1111/bph.15028. Epub 2020 Apr 12. Br J Pharmacol. 2020. PMID: 32060895 Free PMC article. Review.
Cited by
-
Identification of genetic and immune signatures for the recurrence of HER2-positive breast cancer after trastuzumab-based treatment.Breast Cancer Res Treat. 2023 Jun;199(3):603-615. doi: 10.1007/s10549-023-06931-1. Epub 2023 Apr 21. Breast Cancer Res Treat. 2023. PMID: 37084155
-
Construction and Validation of an Immune-Based Prognostic Model for Pancreatic Adenocarcinoma Based on Public Databases.Front Genet. 2021 Jul 14;12:702102. doi: 10.3389/fgene.2021.702102. eCollection 2021. Front Genet. 2021. PMID: 34335699 Free PMC article.
-
The immune checkpoint regulator PD-L1 expression are associated with clinical progression in prostate cancer.World J Surg Oncol. 2021 Jul 16;19(1):215. doi: 10.1186/s12957-021-02325-z. World J Surg Oncol. 2021. PMID: 34271938 Free PMC article.
-
Sensory Ion Channel Candidates Inform on the Clinical Course of Pancreatic Cancer and Present Potential Targets for Repurposing of FDA-Approved Agents.J Pers Med. 2022 Mar 16;12(3):478. doi: 10.3390/jpm12030478. J Pers Med. 2022. PMID: 35330477 Free PMC article.
-
Prognostic value of immune-related lncRNA pairs in patients with bladder cancer.World J Surg Oncol. 2021 Oct 18;19(1):304. doi: 10.1186/s12957-021-02419-8. World J Surg Oncol. 2021. PMID: 34663340 Free PMC article.
References
-
- Lutz ER, Wu AA, Bigelow E, Sharma R, Mo G, Soares K, Solt S, Dorman A, Wamwea A, Yager A, Laheru D, Wolfgang CL, Wang J, Hruban RH, Anders RA, Jaffee EM, Zheng L. Immunotherapy converts nonimmunogenic pancreatic tumors into immunogenic foci of immune regulation. Cancer Immunol Res. 2014;2(7):616–631. doi: 10.1158/2326-6066.CIR-14-0027. - DOI - PMC - PubMed
MeSH terms
Substances
Grants and funding
LinkOut - more resources
Full Text Sources
Other Literature Sources
Medical
Research Materials
Miscellaneous
