. 2021 Apr 12;18(1):90.
doi: 10.1186/s12974-021-02144-9.

High-salt diet downregulates TREM2 expression and blunts efferocytosis of macrophages after acute ischemic stroke

Affiliations

High-salt diet downregulates TREM2 expression and blunts efferocytosis of macrophages after acute ischemic stroke

Mengyan Hu et al. J Neuroinflammation. .

Abstract

Background: A high-salt diet (HSD) is one of the major risk factors for acute ischemic stroke (AIS). As a potential mechanism, surplus salt intake primes macrophages towards a proinflammatory phenotype. In this study, whether HSD could blunt the efferocytic capability of macrophages after ischemic stroke, thus exacerbating post-stroke neural inflammation, was investigated.

Methods: Wild-type male C57BL/6 mice were fed with fodder containing 8% sodium chloride for 4 weeks and subjected to transient middle cerebral occlusion (tMCAO). Disease severity, macrophage polarization as well as efferocytic capability were evaluated. Bone marrow-derived macrophages were cultured in vitro, and the impact of high salinity on their efferocytic activity, as well as their expression of phagocytic molecules, were analyzed. The relationships among sodium concentration, macrophage phenotype, and disease severity in AIS patients were explored.

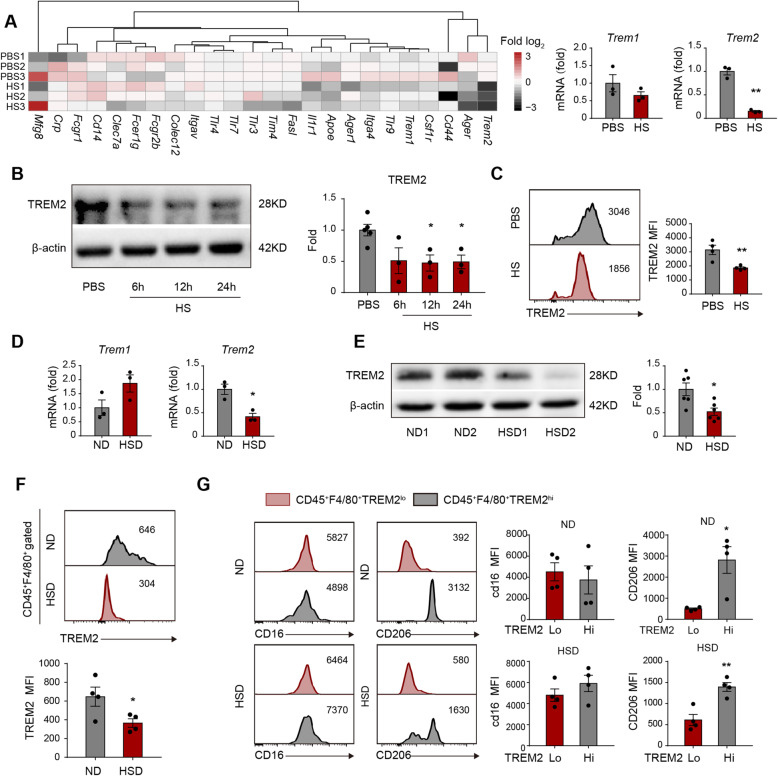
Results: HSD-fed mice displayed increased infarct volume and aggravated neurological deficiency. Mice fed with HSD suffered exacerbated neural inflammation as shown by higher inflammatory mediator expression and immune cell infiltration levels. Infiltrated macrophages within stroke lesions in HSD-fed mice exhibited a shift towards proinflammatory phenotype and impaired efferocytic capability. As assessed with a PCR array, the expression of triggering receptor expressed on myeloid cells 2 (TREM2), a receptor relevant to phagocytosis, was downregulated in high-salt-treated bone marrow-derived macrophages. Enhancement of TREM2 signaling restored the efferocytic capacity and cellular inflammation resolution of macrophages in a high salinity environment in vitro and in vivo. A high concentration of urine sodium in AIS patients was found to be correlated with lower TREM2 expression and detrimental stroke outcomes.

Conclusions: HSD inhibited the efferocytic capacity of macrophages by downregulating TREM2 expression, thus impeding inflammation resolution after ischemic stroke. Enhancing TREM2 signaling in monocytes/macrophages could be a promising therapeutic strategy to enhance efferocytosis and promote post-stroke inflammation resolution.

Keywords: High-salt diet; Macrophage; Phagocytosis; Stroke; Triggering receptor expressed on myeloid cells 2.


Conflict of interest statement

The authors declare that they have no competing interests.

Figures

Fig. 1
Fig. 1
Excess salt intake exacerbates disease outcomes of ischemic stroke. C57BL/6 mice were fed with ND or HSD for 28d and were subjected to 60min of tMCAO. Animals were sacrificed at 3 days or 7 days after tMCAO. a The timeline of the in vivo experimental design. b, c Infarct volume of male mice was quantified in NeuN (green)-stained coronal sections at 3 days and 7 days in vivo. Dashed lines outline the infarct area. N = 6–8 mice per group, *P < 0.05 and **P < 0.01 versus ND group in t test. d, e Representative images demonstrating TUNEL (green) co-labeling with NeuN (red) in infarct penumbra at 3 days and 7 days after tMCAO in vivo. The number of NeuN+TUNEL+ neurons was quantified. N = 5 mice per group. ***P < 0.001 and ****P < 0.0001 versus ND group in t test. f The reduction rate of dead/dying neurons from 3 days–7 days after tMCAO was calculated in vivo. N = 5 mice per group, **P < 0.01 and ***P < 0.001 versus ND group in t test. g Neurological deficit score was assessed at 0–3 days after tMCAO. N = 10 per group, *P < 0.05 versus ND group in t test. h Survival of mice was recorded at 0–7 days after tMCAO. N = 10 mice per group. *P < 0.05 versus ND group in t test. ND normal diet, HSD high-salt diet, STR striatum, and CTX cortex
Fig. 2
Fig. 2
Surplus salt intake exacerbates post-stroke neural inflammation. a Leukocyte infiltration in the ischemic brain at 3 days after tMCAO was analyzed with flow cytometry in vivo. Representative flow plots showing infiltrated T lymphocytes (CD45hiCD3+), B lymphocytes (CD45hiCD19+), microglia (CD45inCD11b+), myeloid cells (CD45hiCD11b+), neutrophils (CD45hiCD11b+Ly6G+), and macrophages (CD45hiCD11b+Ly6G-) in ND and HSD brains, and the corresponding statistical analysis were displayed. N = 4 for ND and N = 5 mice for HSD group. *P < 0.05 and **P < 0.01 versus ND group in t test. b mRNA was extracted from the ipsilateral hemisphere of stroke mice at 3 days after tMCAO and subjected to RT-PCR. N = 3 mice per group. *P < 0.05, **P < 0.01, and ***P < 0.001 versus ND group in t test. IP ipsilateral
Fig. 3
Fig. 3
Expression of inflammation resolution-associated molecules in macrophages is downregulated in a high salinity environment. a Brain sections were collected from ND and HSD mice at 3 days after 60-min tMCAO. Expression of CD16 (green) or CD206 (green) in Iba1+ cells (a marker of microglia and macrophage) was analyzed with immunostaining in vivo. N = 3 mice per group. **P < 0.01, ***P < 0.001, and ****P < 0.0001 versus ND group in t test. b, c Bone marrow-derived primary cultured macrophages were treated with 40 mM of NaCl overnight at the presence of LPS (100 ng/ml) or IL-4 (20 ng/ml) in vitro. Expression of CD206, Arg1, and TNFα was assessed with RT-PCR (b) and flow cytometry (c). Comparable cell counts were analyzed among the PBS, HS, PBS+LPS, HS+LPS, PBS+IL-4, and HS+IL-4 groups. Data were collected from 3 independent experiments. *P < 0.05 and **P < 0.01 versus PBS group in t test. LPS lipopolysaccharide, STR striatum, CTX cortex
Fig. 4
Fig. 4
Efferocytosis of macrophages is impaired in a high salinity environment. a, b ND and HSD mice were subjected to 60min of tMCAO. Brain sections were collected at 3 days after cerebral ischemia. a Confocal microscopy analysis of NeuN (blue), TUNEL (green), and Iba1 (red) triple-staining in vivo. White arrows indicate microglia/macrophages that engulfed dead/dying neurons (Iba1+NeuN+TUNEL+). b Quantification of the total number of Iba1+ microglia/macrophages, Iba1+NeuN+ cells (microglia/macrophages that have engulfed neurons), Iba1+NeuN+TUNEL+ cells (microglia/macrophages that engulfed dead/dying neurons), Iba1+NeuN+TUNEL- cells (microglia/macrophages that colocalize with TUNEL- neurons), Iba1-NeuN+TUNEL+ cells (not engulfed dead neurons), and phagocytic index (the proportion of dead/dying neurons engulfed by microglia/macrophages) in ischemic areas in vivo. N = 3 mice per group. *P < 0.05 and **P < 0.01, versus ND group in t test. c Macrophage viability before and after 4h of neuron-efferocytosis was quantified by LDH-assay in vitro. Data were collected from 3 independent experiments. d, e Phagocytosis of PI+ dead/dying neurons by macrophages was evaluated in vitro with immunostaining (d) and flow cytometry (e). Engulfed dead/dying neurons (PI+) per macrophage (Phalloidin labeled) or the proportion of phagocytic macrophages (PI+) was quantified at the indicated time points. The right images enlarged the boxed area. Data were collected from three independent experiments. **P < 0.01 and ***P < 0.001 versus PBS group in t test. f Dead neurons were treated to macrophages at a ratio of neuron: macrophage = 5:1 in vitro. After 6h, expression of proinflammatory (Tnfα, Il6, and Il1β) and inflammatory resolving molecules (Arg1, CD206, TGFβ) in the efferocytic macrophages was analyzed with RT-PCR. Data represent three independent experiments performed in duplicate. *P < 0.05, **P < 0.01, and ***P < 0.001 versus PBS group in t test. STR striatum and CTX cortex
Fig. 5
Fig. 5
Excess salt downregulates efferocytic molecule TREM2 in macrophages and impairs their inflammation resolution functions. a Macrophages cultured in a high-salt environment were subjected to a PCR array to analyze the expression of efferocytosis-associated receptors in vitro. Data are displayed as fold change relative to macrophages from the PBS-treated group. Experiments were repeated three times. **P < 0.01 versus PBS group in t test. b, c Protein expression of TREM2 in macrophages after HS treatment was evaluated with western blot (b) and flow cytometry (c) in vitro. Experiments were repeated three times. *P < 0.05 versus PBS-treated group in t test. dg ND and HSD mice were subjected to 60min of tMCAO. The brains were collected at 3 days after tMCAO. d mRNA expression of Trem1 and Trem2 in the ipsilateral hemisphere of stroke mice was analyzed with RT-PCR in vivo. CT value was normalized to that of ND mice. N = 3 mice per group. *P < 0.05 versus ND group in t test. e Protein expression of TREM2 in the ipsilateral hemisphere of stroke mice with western blot. N = 6 mice per group. *P < 0.05, versus ND group in t test. f In vivo, TREM2 protein expression in infiltrated macrophages (CD45hiCD11b+Ly6G-) of stroke mice was analyzed with flow cytometry. N = 4 mice per group. *P < 0.05 versus ND group in t test. g In vivo CD16 and CD206 expression in TREM2lo and TREM2hi macrophages (CD45hiCD11b+Ly6G-) in the ipsilateral hemisphere from ND and HSD mice was measured via flow cytometry. The mean fluorescence intensity (MFI) of CD16 or CD206 was quantified. N = 4 mice per group. *P < 0.05 and **P < 0.01 versus TREM2lo macrophages in t test
Fig. 6
Fig. 6
TREM2 expression is decreased in AIS patients with high-salt intake and is correlated with the proinflammatory property of circulating monocytes and detrimental stroke outcomes. AIS patient dietary salt intake was measured with a 24-h urine sodium (24h UNa) with a normal limit of 170 mmol. a Representative images of the MRI-DWI of AIS patients with normal or high urine sodium concentration. Comparison of infarct size of AIS patients with normal (N = 13) or high (N = 25) urine sodium concentration. *P < 0.05 by Student’s t test. b Comparison of 1-day NIHSS, 7-day NIHSS of AIS patients with normal (N = 13) or high (N = 25) urine sodium concentration. *P < 0.05 by Student’s t test. c Heat map showing TREM2, CD206, and CD80 protein expression in peripheral monocytes of AIS patients with normal (N = 13) or high (N = 25) urine sodium concentration using flow cytometry. The function of “scale” was applied for value normalization. d Comparison of CD206 and CD80 protein expression in peripheral monocytes of AIS patients with normal (N = 13) or high urine sodium concentration (N = 25) using flow cytometry. *P < 0.05 by Student’s t test. e Comparison of TREM2 protein expression in peripheral monocytes of AIS patients with normal (N = 13) or high urine sodium concentration (N = 25) using flow cytometry. *P < 0.05 by Student’s t test. f Comparison of TREM2 mRNA expression in PBMCs of AIS patients with normal (N = 6) or high urine sodium concentration (N = 12). *P < 0.05 by Student’s t test. g Correlation of clinic parameters, the protein expression of TREM2 and 24h UNa was assessed with Spearman correlation analysis. *P < 0.05, **P < 0.01. DWI diffusion-weighted imaging, DM diabetes mellitus, HL hyperlipidemia, CHD coronary heart disease, AF atrial fibrillation, WBC white blood cell, NLR neutrophil-to-lymphocyte ratio, BNa blood sodium, CRP C-reactive protein, HCY homocysteine, and Hba1c glycated hemoglobin
Fig. 7
Fig. 7
Enhancement of TREM2 signaling restores the efferocytic capacity and cellular inflammation resolution of macrophages in a high salinity environment. Bone marrow-derived primary cultured macrophages were infected with lentiviral vectors carrying TREM2-GFP cDNA (TREM2-Lenti) or control lentivirus carrying GFP only (NC-Lenti). Macrophages were subjected to analysis at 2 days after infection. a, b Transfected macrophages were treated in vitro with HS or PBS overnight and then subjected to efferocytic analysis with PI+ dead/dying neurons. The efferocytic efficiency of macrophages was evaluated with immunostaining (a) and flow cytometry (b). Engulfed dead/dying neurons (PI+Phalloidin+) per macrophage or the proportion of phagocytic macrophages (PI+F4/80+) was calculated at the corresponding time points. Data were collected from three independent experiments. *P < 0.05 and ***P < 0.001 versus NC-Lenti PBS group in one-way ANOVA. c In vitro protein expression of Arg1 and CD206 in transfected macrophages with HS or PBS treatment overnight was analyzed with flow cytometry. *P < 0.05 versus NC-Lenti PBS group in one-way ANOVA. d, e C57BL/6 mice with HSD or ND were first injected with clodronate liposomes to deplete monocytes/macrophages. Mice were then subjected to 60 min of tMCAO. Immediately after reperfusion, a single dose of 2x10⁶ TREM2-overexpressing macrophages or NC macrophages were intravenously transferred in vivo. d The in vivo infarct volume of male mice was quantified on NeuN (red)-stained coronal sections at 3 days. Dashed lines outline the infarct area. N = 6 mice per group, *P < 0.05, **P < 0.01, and ****P < 0.0001, one-way ANOVA. e Confocal microscopy analysis of NeuN (blue) and Iba1 (red) double-staining in HSD mice. Quantification of the total number of Iba1+NeuN+ cells (microglia/macrophages that have engulfed neurons) and phagocytic index (the proportion of neurons engulfed by microglia/macrophages) in ischemic areas of HSD mice. N = 4 mice per group. *P < 0.05 and **P < 0.01 versus NC macrophage group in t test. f In vivo CD206 (red) expression in Iba1+GFP+ cells was analyzed via immunostaining. N = 4 mice per group. *P < 0.05 versus NC macrophage group in t test

Similar articles

Cited by

References

    1. Kono Y, Yamada S, Yamaguchi J, Hagiwara Y, Iritani N, Ishida S, et al. Secondary prevention of new vascular events with lifestyle intervention in patients with noncardioembolic mild ischemic stroke: a single-center randomized controlled trial. Cerebrovasc Dis. 2013;36(2):88–97. doi: 10.1159/000352052. - DOI - PubMed
    1. Kono Y, Yamada S, Kamisaka K, Araki A, Fujioka Y, Yasui K, et al. Recurrence risk after noncardioembolic mild ischemic stroke in a Japanese population. Cerebrovasc Dis. 2011;31(4):365–372. doi: 10.1159/000323233. - DOI - PubMed
    1. Gardener H, Rundek T, Wright CB, Elkind MS, Sacco RL. Dietary sodium and risk of stroke in the Northern Manhattan study. Stroke. 2012;43(5):1200–1205. doi: 10.1161/STROKEAHA.111.641043. - DOI - PMC - PubMed
    1. He FJ, MacGregor GA. Role of salt intake in prevention of cardiovascular disease: controversies and challenges. Nat Rev Cardiol. 2018;15(6):371–377. doi: 10.1038/s41569-018-0004-1. - DOI - PubMed
    1. O’Donnell M, Mente A, Yusuf S. Sodium intake and cardiovascular health. Circ Res. 2015;116(6):1046–1057. doi: 10.1161/CIRCRESAHA.116.303771. - DOI - PubMed

MeSH terms